
My piece on Joel Greenblatt’s magic formula
3 Likes
Hi Ahmed,
Any new findings since last 1 year. Is this still working? 
Regards,
Vishal
Hi Hiten,
Did you compare it with index(nifty, sensex or s&p 500). What is the marketcap filter you used?
MCap filter - I use top-500 companies and then follow the steps mentioned in the book.
I have run the magic-formula since 1998 and it has fetched approx. 22% CAGR while the nifty / sensex have given any where between 15-17% return.
Since last two years, the system has given a return of 31% and am not complaining
Cheers
4 Likes
What is exact formulae you are using and which date?
Exactly those formulas mentioned in the appendix of the book. ROC and Earnings yield.
Only that I have restricted my universe to top500 stocks ranked by Mcap (available at the time analysis i.e. last trading day of the month). Then I exclude finance, NBFC, stock brokers, DVRs, REITS power generation companies from this Top500 universe.
We will be left with 400-420 odd companies to run the magic formula scanner on it. (ROC + EY)
Based on that, I buy basket of top-3 ranked stocks on 1st Trading day of the month.
Live example, I have run the magicformula scanner based on yday’s closing prices (i.e. 31st March 21) and will buy those 3 stocks max by 10 am today i.e. 1st April.
Hope this helps.
2 Likes
Hi Hiten,
There are two key questions here
- Which data source you use
- Book talks about specific way of calculating earning yield and ROIC, which is different to the ones shown in many websites
And optionally: If you can share your process and data in details, people in this site will benefit.
Regards,
1 Like
I have novice questions. Wikipedia mentions these steps
- Buy two to three positions each month in the top 20 to 30 companies, over the course of a year.
- Each year, rebalance the portfolio by selling off losers one week before the year-term ends. Sell off winners one week after the year mark.
Does it mean to buy two to three top companies filtered? Or is it meant to purchase two to three stocks of top 20 to 30 companies? This is unclear to me.
Also if we spread the buying over the course of a year, how can we sell the winners and losers around the year mark as only the stocks of the first month’s purchase may be nearing an year? Does that mean, after a year of starting this process, we shall do buying and selling every month?
Any help to get a better understanding is appreciated.
I believe it is 2-3 companies of top 20 - 30 companies. Yes buying and selling is spread over the year. If we plan to follow this method, we need to do every month. Every month we may have some stocks for buy and sell.
1 Like
Hi Vishal,
I use Capitaline database. Websites are not 100% reliable so I prefer to calculate ratios and scan the market on my own using Capitaline.
Let me explain the process through a live example for the basket to bought on 1st April 2021.
-
Create the universe - Download the closing prices and m-cap as on 31st March 2021 along with their Sector classification. Select the Top-500 companies based on their MCap. Now exclude companies belonging to Bank, finance, Power generation and distribution and stock brokers sectors. Also exclude all REITs, DVRs and INVITs. This gave me a universe a of 406 companies.
-
Now we need Return on Capital (ROC) and Earnings Yield (EY) - for in-depth calculation and rationale would suggest to go through the Appendix in the book.
2.a. ROC calculation ROC = EBIT / (Net Working capital + Net Fixed asset).
EBIT → Use Trailing Twelve Months (TTM) and is updated every quarter with a lag of 2 months. As per the current rules, companies are required to report the quarterly results within 45-days after the close of each quarter.
Net Working capital and Net Fixed Asset → Since these are balance sheet data, update it annually.ROC is ranked from High to Low, higher the better. Highest ROC is ranked 1st.
2.b. Earnings Yield EY = EBIT/Enterprise Value
This calculation is a twist to what we commonly aware of i.e. inverse of Price/Earnings ratio. Here, EBIT is used as per (2.a) above.
Enterprise value = Mcap + net-debt
Mcap of last trading day of the previous month is used (in our example it is of 31March2021)
Net-debt again this being a balance sheet data, it is updated annually.
EY are ranked from high to low (higher the better). Highest EY company is ranked 1.
- Both the above ranks are simply added and sorted from Low to High. Top three stocks are then bought in equal weight on the first trading day of the month.
This three-stock basket is held exactly for one year.
Exit - Losers are exited few days before 12 months, STCG benefits and Winners are sold few days after 12 months, for LTCG benefits.
The whole process is done every month.
Commitment - Treat this as a Stock SIP and commit atleast one year for investment and at least 3 years cycles i.e. 36-months cycle to complete in order to reap the benefits out of it.
Reinvestment - From the 13th month, its ones choice to reinvest the proceeds along with the new instalment.
Hope this helps a bit.
Cheers!
4 Likes
Every month pick top-3 ranked companies using the magic formula method.
so max stocks you would have will be 36.
Maintain an excel sheet for your monthly buys and treat it like one basket.
Exit this basket according to the method mentioned.
For example.
Suppose on 1st April 2021 you bought 1) Tata Chemicals (10 qty) + Coal India (40 qty) + IOL Chemicals (10qty). We will sell this basket exactly on 1st April 2022, depending on winner or loser we may sell it few days before or after 1st April 2022.
Hope this helps.
2 Likes
Hi Hiten,
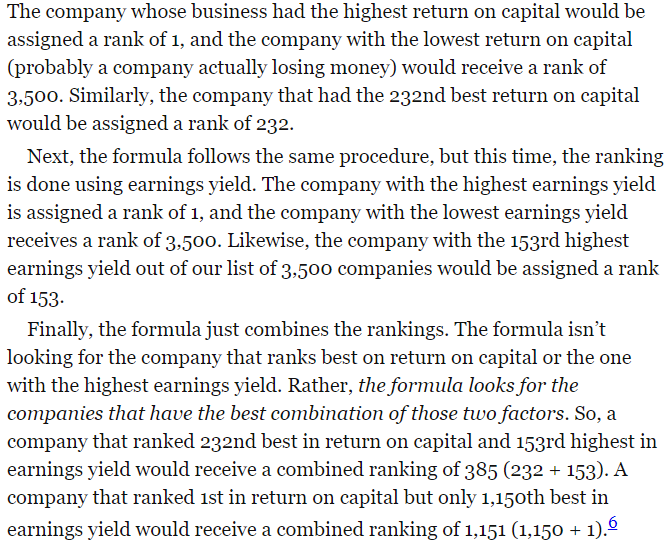
You are telling the formula in exactly opposite way.
You can see the screenshot from joel greenbalt’s book below
High ROC is ranked as rank 1 and high EY is ranked as 1
yeah i stand corrected with respect to EY.
higher the better.
Regret inconvenience
Thanks for sharing all these details. It indeed helps a lot. Just one query:
I use Capitaline database. Websites are not 100% reliable
Is there any reason to think screener.in is not reliable for this? I think it is using capitaline database based on their footnote.
Also Greenblatt stresses on the quality of the database. I wonder if capitaline itself is reliable and if there are alternatives.
I prefer Capitaline you can use any software which you are comfortable with.
1 Like
Hello All,
I have a query about rebalancing the portfolio.
For example, An Investor commits total investment of 2Lakhs in equal weighted Magic formula portfolio of 28 stocks.
Lets say every 2 months starting 5th July 2021, he is buying 7 stocks . So that in next 8 months he will have 28 stocks in portfolio. ( 2 Lac/28 = 7,142 Rs invested in each stock). Keeps repeating until he has 28 stocks in portfolio.
Now, 1st batch end on 5th July 2022. If the net profit out of 7 stocks is 10,000Rs . Do we need to keep aside that 10K and continue invest 7142 in each stock in fresh batch ?
In 2nd batch he might get a Net loss of say 10K Rs. And in 3rd batch may be a Net profit of 15K Rs.
So how do we exactly handle this proft/loss arising out of each batch of stocks ?
Should we keep account of profilt/loss in each batch and then once we have total profit/loss from complete set of portfolio, then do we need to allocate that amt + Initial invested amt equally in next cycle?
Please share your insights . Thank you.
I had the same doubt and the solution i came up with is this strategy.
divide 100/28= 3.57% . This 3.57% is the invested amount allocation percentage for every new stock added.
So in your case, you have 2 Lakhs to start, so you invested 7,142 in each stock until all 2 lakhs is deployed in the first year.
Then when first batch ends on 5-July-2022, you sell your 7 stocks with 10,000rs profit, but this is just profit. you will have cash of (7142 Rs * 7 stocks + 10,000 profit) = 59994 Rs.
Now how to deploy this cash?
The approach i am taking is, Add this cash to your portfolio AUM. and calculate 3.57% of that portfolio AUM and invest in the next 7 stocks.
So, continuing your example, we have 59994 Rs cash. and assuming there is 0 return on the rest of your 21 stocks (just to keep it simple), you will have 59994 Rs + (7142 Rs * 21 stocks) = 209976 Rs. 209976rs is your AUM.
So take 3.57% of 209976 Rs = 7496 Rs . invest this amount in the next 7 stocks. You will be left with some cash in hand. Keep it in the portfolio as Cash which can be used to buy it in the next round
What do you think of this? Happy to discuss
Thank you for sharing your strategy.
I was also thinking about the same. But there could be some challenges ,
Say, 1st batch ( 7 stocks ) profit = 10,000
2nd batch Loss = 12,000
So in case of loss in 2nd batch, our AUM will be 2,000 less. So to compensate for that 3.57% to maintain an equal weighted portfolio, we may have to invest from our pocket ( New capital 2,000 added)
So I was thinking of this below strategy to make it little more simple.
We have to track all Profit/loss till end of the one cycle. Then, based on net profit/loss we can adjust our portfolio.
Say in our example, at the end of 1 cycle of 4 batch in 28 stocks portfolio on 5th July 2023 ( As we will start harvesting only from 5-july 2022) if we get profit of 50,000 rs .
Then, starting in next cycle on 5th July 2023 we can allocate 8,928 Rs in each stock ( 2 Laks initial capital + 50,000 rs / 28 stocks = 8,928 Rs on each stock)
If we make a loss in one cycle, then whatever remaining capital can be divided by 28 and start allocating. In this way we dont want to get into a situation of facing challenge of adding some money when subsequent loss of 2nd or 3rd batch.
Share your thoughts on this.
Yes this could work as well but i think in this way, the portfolio will have un-invested cash of profits for almost a year.
I am yet to finish one year of practical implementation. Let’s see how it goes
Hey @nikunj_patel and @Gautam_Redmi1s_mobil would you be comfortable to share your Magic Formula portfolio, and also your approach - whether you follow it as-is or have your own tweaks (like market cap limit, further quality checks, filters etc)?