Hi,
My question is related to outstanding shares, issued capital and authorized capital
Is issued capital = equity capital. [Not including reserves]
Is issued capital = number of outstanding shares * face value
When a company issues more shares (for whatever reason) then is it possible to find how much more money came into the company because of this act? Where does this money that came into the company sit in balance sheet?
Pasting this below for OFSS taken from screener.in
Mar 2005 Mar 2006 Mar 2007 Mar 2008 Mar 2009 Mar 2010 Mar 2011 Mar 2012 Mar 2013 Mar 2014 Mar 2015 Mar 2016 Mar 2017
Share Capital 37.44 38.14 41.64 41.87 41.88 41.93 41.95 41.99 42.03 42.07 42.31 42.35 42.47
One question regarding dividends by Financial firms -
If they are going to need as much money as possible for growth, why do they pay 10-20% of the profits (looked at the likes of HDFC) as dividends every year.
Especially when a firm is into lending, I simply find the dividend inefficient for it entails an extra 20% tax. Is there a pressure by the shareholders?
BTST stands for Buy Today Sell Tomorrow which at times is also written as ATST.
In India, we have T+2 settlement cycle for stocks. Below is an excerpt from NSE to give details on it -
“NSCCL follows a T+2 rolling settlement cycle. For all trades executed on the T day, NSCCL determines the cumulative obligations of each member on the T+1 day and electronically transfers the data to Clearing Members (CMs). All trades concluded during a particular trading date are settled on a designated settlement day i.e. T+2 day.”
Now, BTST is just another facility provided by the brokers where you can buy a stock on T day and sell the same on T+1 day before it gets delivered to your Demat Account on T+2 day.
Note: You need to be careful of short delivery from the exchange while buying delivery today and selling the same delivery tomorrow as they you will be liable for any auction loss due to short payout from exchange. This happens very rarely in blue chip stocks, but can happen more often in Penny and Trade to Trade stocks. So if possible stay away from doing BTST on T2T stocks and illiquid stocks.
I have heard that one should avoid stocks of companies which have low promoter holdings or those where stocks have been pledged but I have noticed that many experts here have a significant part of their portfolios invested in such stocks. So can someone please enlighten me as to why experts invest in such stocks? Thanks
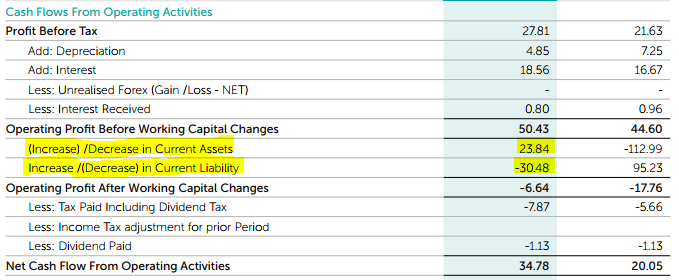
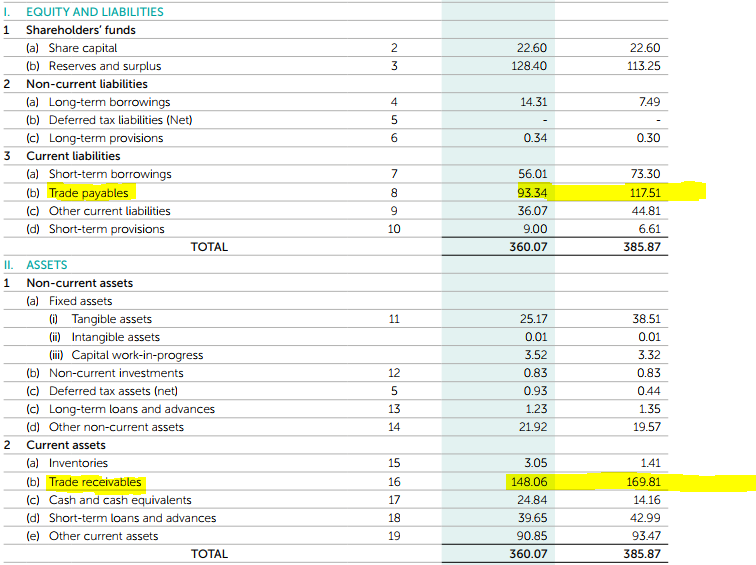
Subtract the Current Assets of last year & this Year.Do same for Current Liabilities for both years.You will get the figures shown in the cash flow statement.
Have a question related to shareholding pattern and pledging
I have been following a company (In the Rural Infra space) and noticed that the shareholding pattern of the promoter has been declining from 72% odd to around 52%. (from FY16 till Q2-FY18)
At the same time the Institution holding has gone up from 2% odd to close to 9% which in my opinion is positive
But at the same time the promoter has pledged close to 80% of his holding
How should some one read this.
Institutes stack going up can be considered +ve but at the same time pledging is a big -ve
Experienced members can you let me know how to read this. I am new to value investing and in learning phase.
Your inputs/comments will help me in how to analyse a company.
Many thanks.
You can get the same from ratestar website, it’s inventory days plus receivable days minus payable days. Which means how quickly you are rotating cash in your business from purchase to sales.
Try to be roughly correct rather than finding precise laser sharp numbers. IMHO Such precision over minor deviations are worthwhile only for an accountant but not for an equity analyst.
Sorry looks like the category links have got broken while individual articles exist
Meanwhile you can get started with the articles directly by clicking on these links below
@pratyushmittal could you please check the “Basics” link on home page and recreate the category links for Investing Basics and Stock Market Basics categories. Thanks.
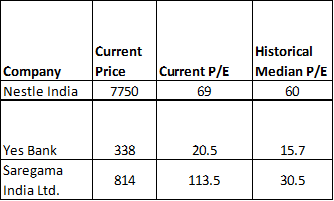
I am trying to understand the relationship between current Price earnings ( and current price) and the growth expectations.
Given a current price ( or /and P/E) (1) how to ( not precisely , but some way to quantify) establish the growth expectations and (2) how much of that growth expectation is already built in to ‘Current price’.
Request your views on this ( if possible with reference to below stocks)

 I was quite curious to know where the difference was