
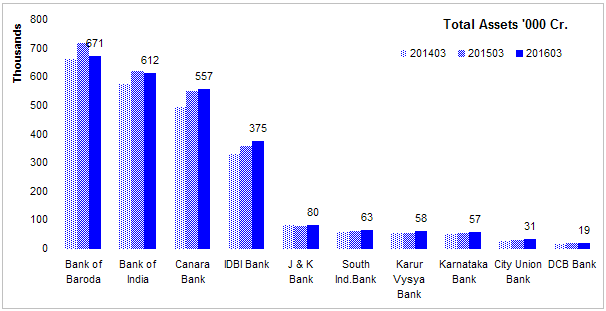
Peer analysis of few more medium and small PSU and private sector banks.
Size PSU banks are much bigger than private sector banks in this list. These private sector banks are niche regional banks that cater to customer in a specific region or a specific type of customer unlike some of the other diversified national private sector banks.
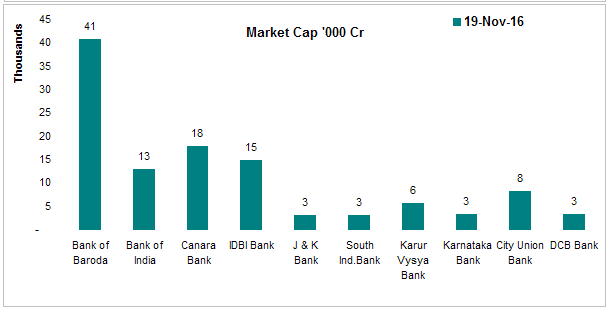
These banks also have much smaller market value compared to their larger peers indicating that despite their asset size, they are not able to generate proportionate market value. Some of these might become a turnaround candidate or an acquisition target for larger banks.
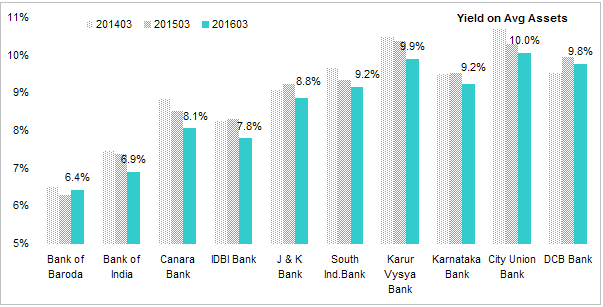
Yield on Avg Assets This it interest income / average interest earning assets. PSU banks have a clear disadvantage here. Smaller niche banks are earning at par with their larger peers.
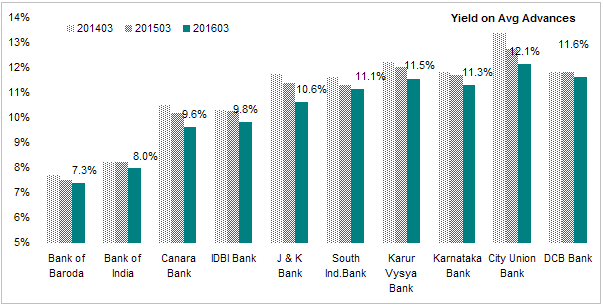
Yield on Avg Advances This ratio focuses only on the yield on risky assets (advances to corporates and general public except government bonds). Same pattern as overall yields.
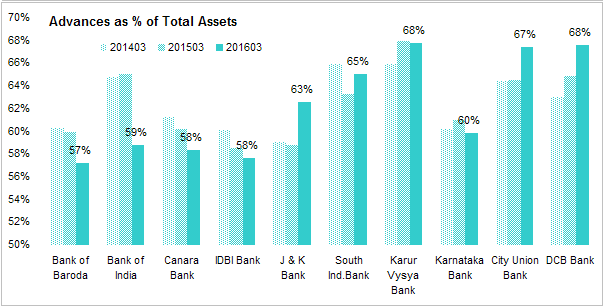
Advances as a % of total assets PSU banks due to their surging defaults have sharply curtailed their lending to private sector. Private sector is already at the maximum limit and picking up share from PSUs. Larget private sector banks appear to have benefited the most at the expense of PSUs.
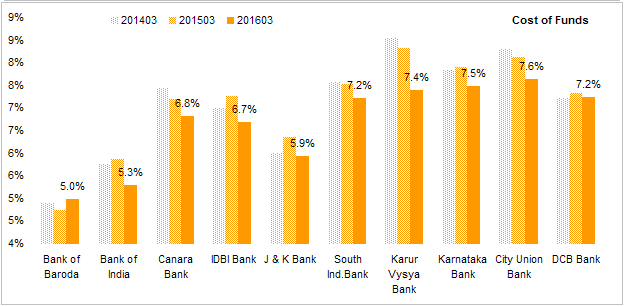
cost of Funds PSUs have an advantage here as deposits in a PSU carry an implicit government guarantee while deposit in a private sector bank is insured only upto 1 lakh. Smaller private sector banks have to pay higher interest rates to attract customers as these are not known for good customer service. Some of these are trying to copy ICICI and HDFC model trying to reduce their interest costs.
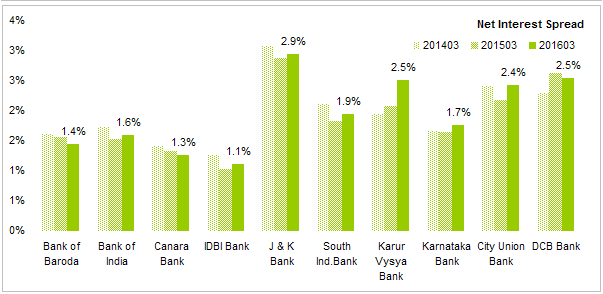
Net Interest Spread This is the ratio that captures basic banking KPI. PSUs are clearly the losers here. small private sector banks are better than even their larger peers mainly because these cater to a niche. J&K tops this chart but in recent quarters it has seen losses. DCB is making good progress.
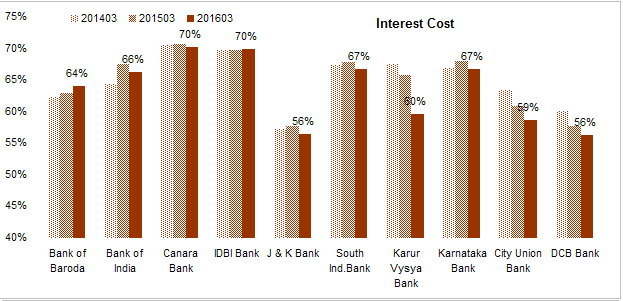
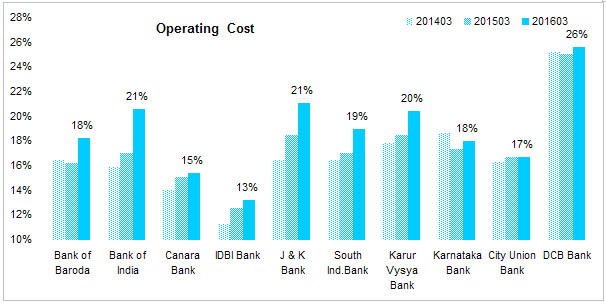
Next few charts compare the cost structure of the banks. Total cost are divided into Interest Costs, Operating Costs Credit Costs and Tax Costs. Costs + Profit Margin should add up to 100%. All cost component are represented as % of Total Income.
Interest Costs - This is the biggest cost component. Interest expense / total income. This cost is generally higher their larger banks indicating larger banks have economics of scale in the core banking business.
Operating Cost This is all the costs except interest, provisions & write-offs and taxes. This is the cost of operating the branch network and backoffice operations. Operating costs are generally lower than larger peers. DCB is trying to emulate customer friendly model of larger private sector banks and has seen it’s costs rise as a result.
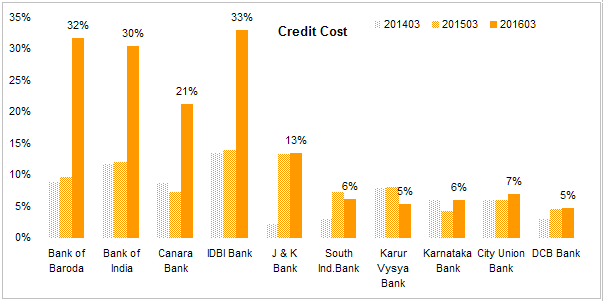
Credit Costs This is the amount a bank has to set aside from its interest income to cover current and future loan losses. This is where smaller banks have a bigger issue. These costs are higher than larger banks across the board. these banks are not able to hire enough talent to get the credit appraisal done correctly. PSU banks have seen a sharp jump in defaults. private sector banks have maintained their (not so good) quality.
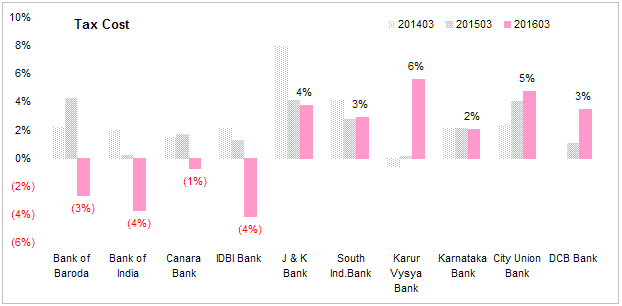
Tax Costs - Taxes are generally lower for smaller banks. -ve number indicate a bank received a tax credit since it may have made a tax provision in earlier years in anticipation of future profit (which turned out to be a loss) that was written back.
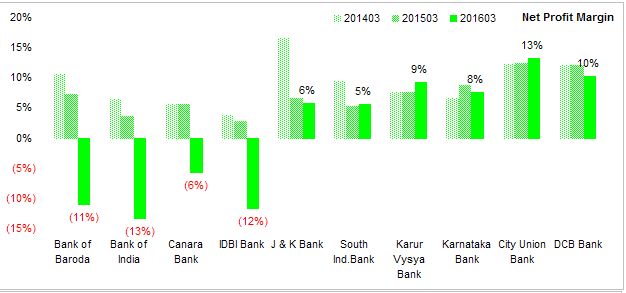
Net Profit Margin - the bottom line. PSUs have seen their profit turn into losses eating into their equity and threatening their very survival. Lower equity will force them to restrict new loans or even stop refinancing existing loans which can result in additional losses. Govt will eventually have to arrange a shotgun marriage with a larger peer or arrange a bailout. Smaller private sector banks are doing OK.
Shareholder Return Ratios
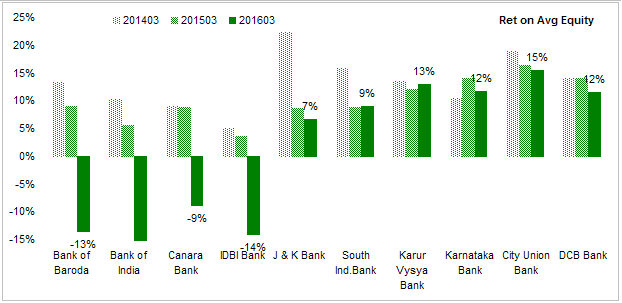
Return on Average Equity - The best shareholder return indicator. Banks in general have low ROE due to commodity nature of their business and regulatory limits (CAR, SLR etc). PSU banks have seen their already low ROE turn negative and private sector banks are barely earning above their cost of equity. Except City Union Bank, none of the banks are earning enough for an investor to risk his/her capital. These are classic value stock that can turn into value traps.
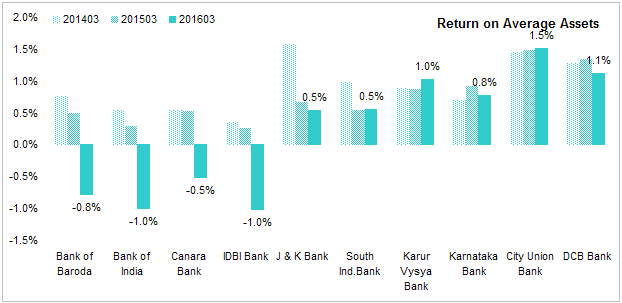
Return on Avg Assets - A bank can earn high ROE by leveraging its equity with debt but in the process it is increasing it risk also. Return on Avg Assets measures profitability without the effect of leverage. City Union Bank has decent ratio.
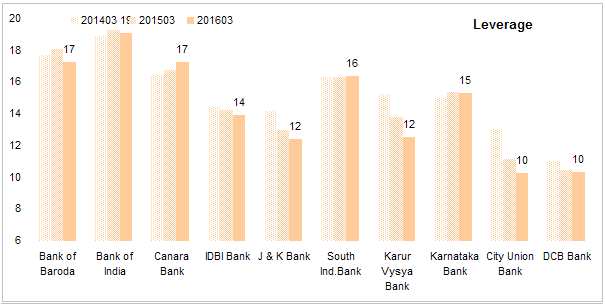
Leverage - Banks are highly leveraged. Leverage is one of the most important risk indicator of a bank. This is the total assets/ total equity. Even if a few loans defaults, banks equity can be wiped out. PSU banks with their implicit govt backing are the most leveraged.
These banks have generally higher leverage (to compensate for their low ROA) compared to larger banks. Since these banks also have higher proportion of risky assets, their risks are generally higher than larger banks. City Union and DCB are good banks in this chart.
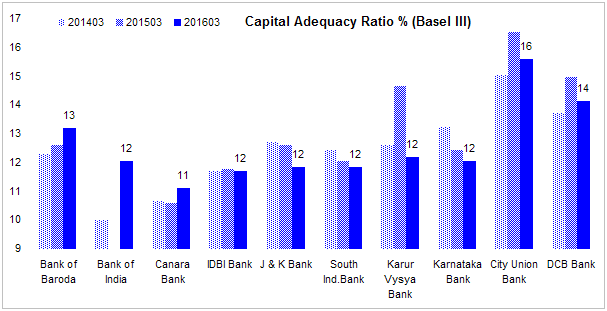
Capital Adequacy Ratio - Since a bank holds significant % of government securities, a true picture of risk is the equity as a % of risk weighted assets where govt assets are considered (credit) risk free. Basel III minimum is 9%. This ratio is generally lower than larger banks indicating a higher proportion of risky assets in their books. Should their capital drop further, they will have raise new capital (which no one but the government will want to buy). City Union and DCB are good banks in this chart.
Non Performing Assets
Banks routinely get into trouble when borrowers default. Credit appraisal is one of the key skill that sets a good bank from a bad bank.
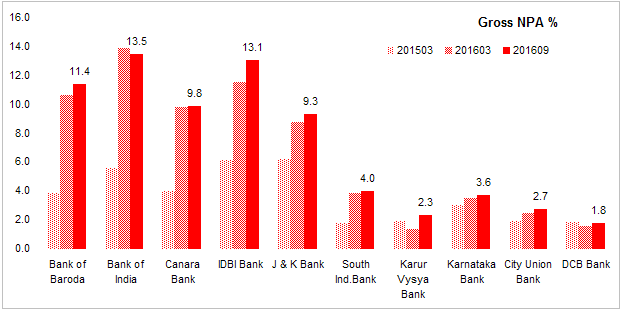
Gross NPA % This is ratio of assets classified as non-performing to total assets of the bank. PSU banks have seen a surge in NPA in recent years. This ratio is (dangerously) higher than larger banks and rising. this is a reason enough for anyone to stay away from these banks.
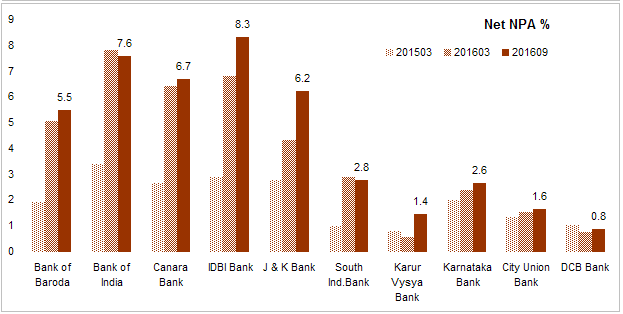
Net NPA % Net NPA is the Gross NPA minus the provisions.From an investor’s perspective this number should be close to zero as banks are suppose to provide in full for loan losses. Since this number is smaller than Gross NPA, banks use this number to diver attention from the GNPA number.
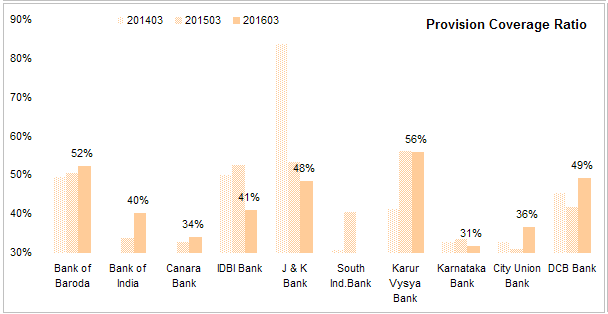
Provision Coverage Ratio - This is the ratio of provisions to gross NPA. This shows how much of the bad loans are already provided for. Ideally this ratio should be close to 100% with international standard is at 70%. None of them even come close to this ratio. Banks don’t make enough provision as their customers have a history of falling behind on payments and somehow managing to catch up much later.
Valuation
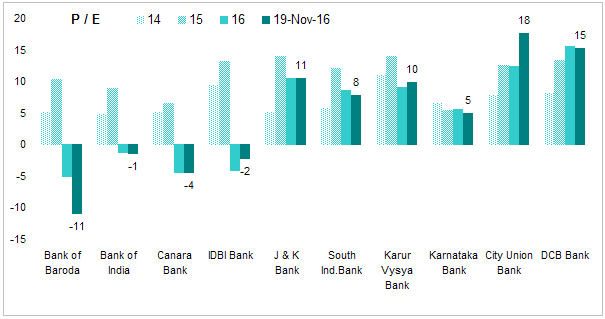
Price to Earnings Ratio - most popular price multiple. This ratio is calculated using annual average price divided by year end consolidated EPS. PE for 19 Nov 2016 is current price divided by TTM consolidated EPS. Valuation correctly reflects their overall low quality.
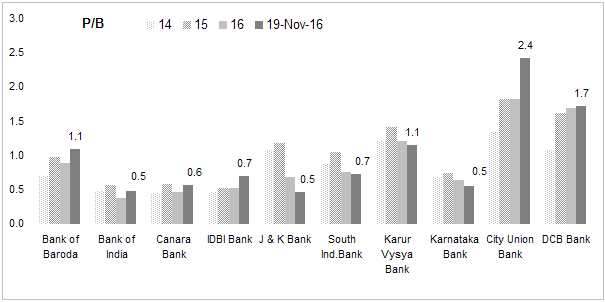
Price to Book Value - Banks are generally valued using PB rather than PE as equity base determine how much a bank can scale its operations. This is also calculated by taking annual average price divided by year end book value per share. PB for 18 Nov 2016 is current price divided by TTM BVPS.
Many of these banks are selling at a deep discount to their book value reflecting their huge pile of bad loans. Market is expecting that some of these loans will go bad and banks have not yet provided for these loans. This a a good area for value investors to dig deeper and see if market is mispricing any of these.
Conclusion - Smaller banks are of much lower quality then their larger peers. Since we are going though NPA crisis some of these may not even survive if things get bad from here. City Union and DCB are the only two candidates worth considering.
Disc - Not invested currently. Previously invested in City Union Bank.