
Hitesh Bhai, KRBL is in downtrend and conclusively broken 200 DMA closed below on weekly basis. On the positive side, Management commentary is good for atleast another few qtrs. On the negative side, Sentiment got a hit due to El Nino predictions and consequent Food Inflation fears. What is your assessment on KRBL given the above factors and still do you hold or closed out. Thank you.
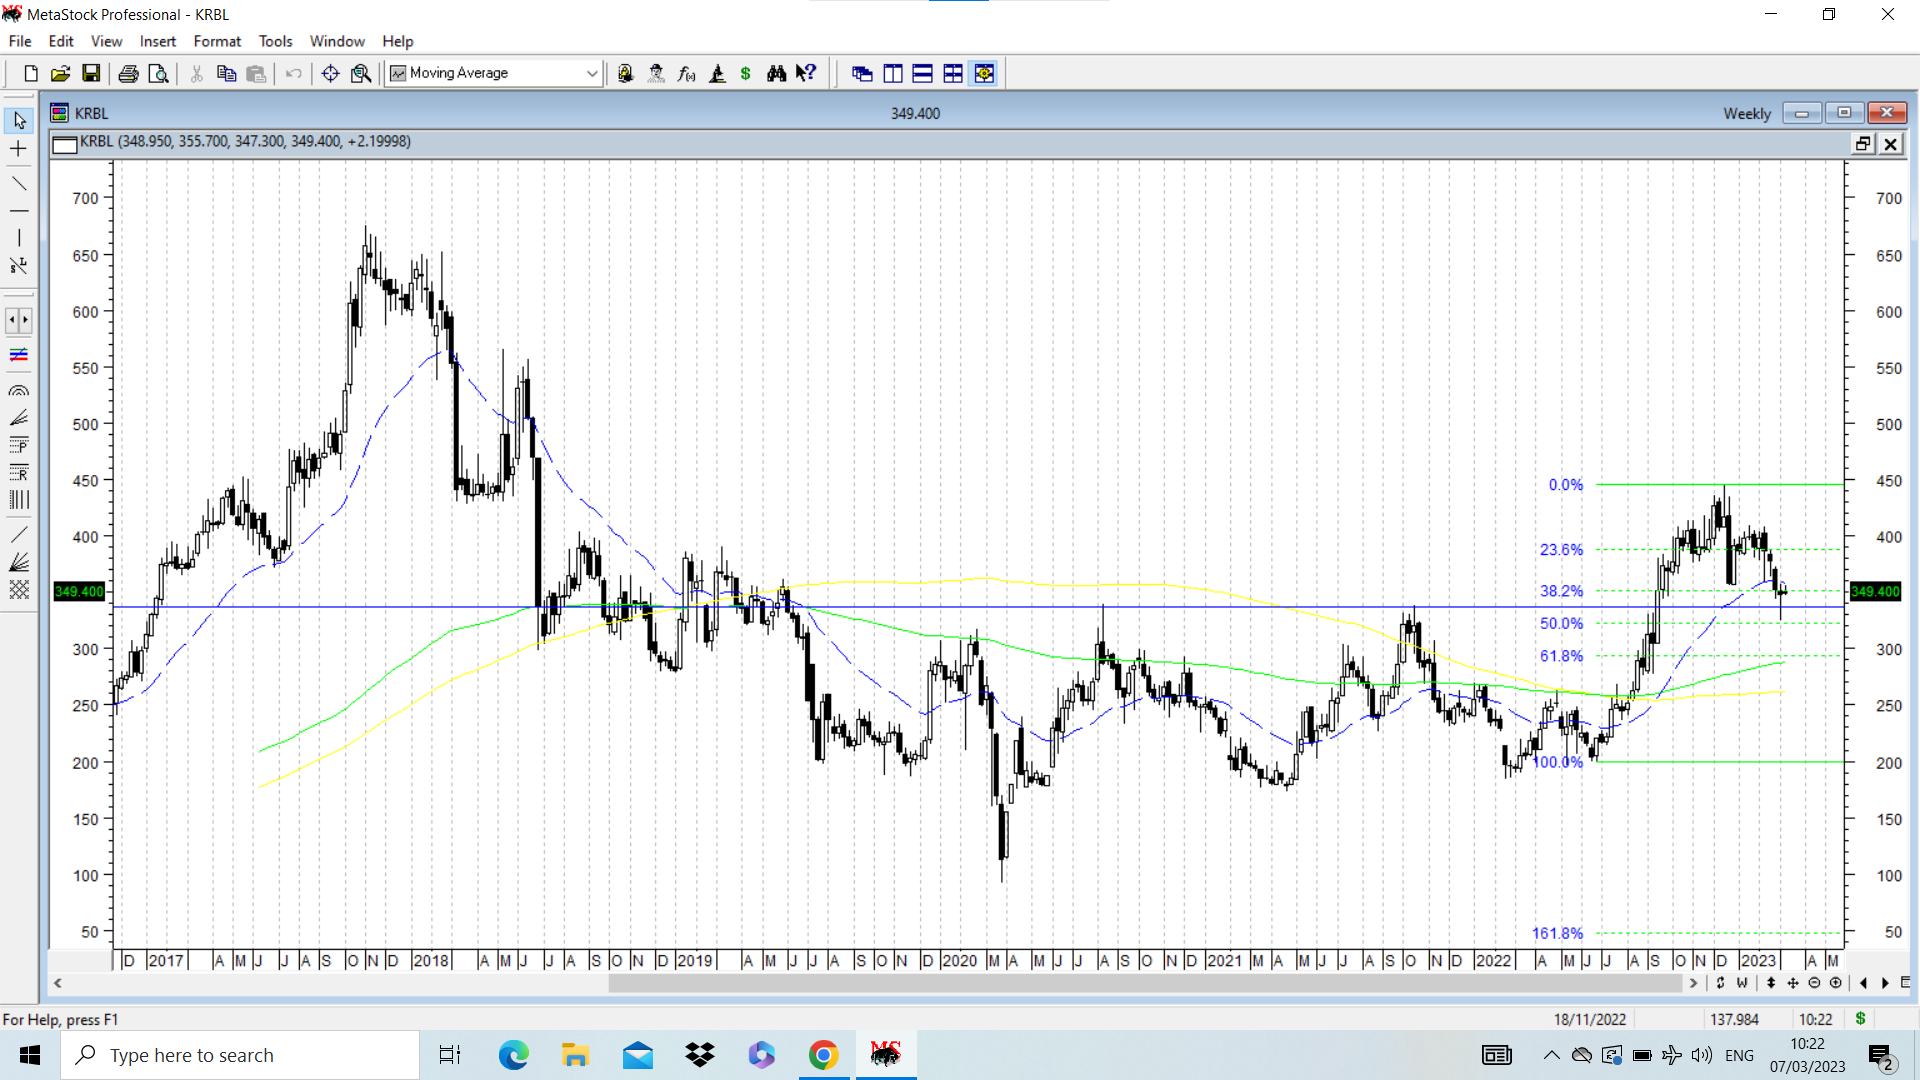
KRBL had a major 3 year breakout above 335-340 and then stock price went up to hit a swing high of 445 and then started correcting. It gave a negative divergence on weekly chart when it hit 445. Post that it started correcting and hit a swing low of 325, which is close to 50% retracement of previous rally and formed a hammer on weekly candlestick, which signifies a possibility ( though no surety) of a weekly bottom in place.
On weekly chart, it seems to be forming a rounding structure . which began from a high of 675 and a low of 92. Overall the structure seems good.
The current correction seems to be a routine correction to the previous rallly from lows of 198 to 445. It also provides a retest of previous major breakout levels of 335-340. Current market price is 349 and the all important 30 week Moving avg is at 360 and is flat. I would personally pefer to see the stock price go above 360, consolidate and then contemplate taking a position if at all I would pefer to buy it. I exited the stock earlier when it started giving negative divergence on weekly charts and there seemed to be weakness on price pattern on daily chart at that time.
Putting up the weekly chart below with 30 WEMA marked in dotted blue line, retracement levels marked in dotted green lines and breakout level of 337 marked in solid blue line. As of now I have no positions, but it remains in my watchlist.
This chart has been shared for academic purpose and is not any recommendation to buy/sell.
14 Likes
Your take on Manaksia correction and chart?
Manaksia is behaving like a typical small cap stock. It recently crossed its strong resistance zone of 85-90 and went on to hit a fresh swing high of 155 and started correcting. On way down it broke down below an important pivot zone of 125-127 and still seems to be in correction mode on daily charts. I would wait for this near term correction to end and some sort of consolidation before taking any call.
4 Likes
HItesh Bhai how do you see GAIL now. Its at 52 week highs and bulish on weekly charts.
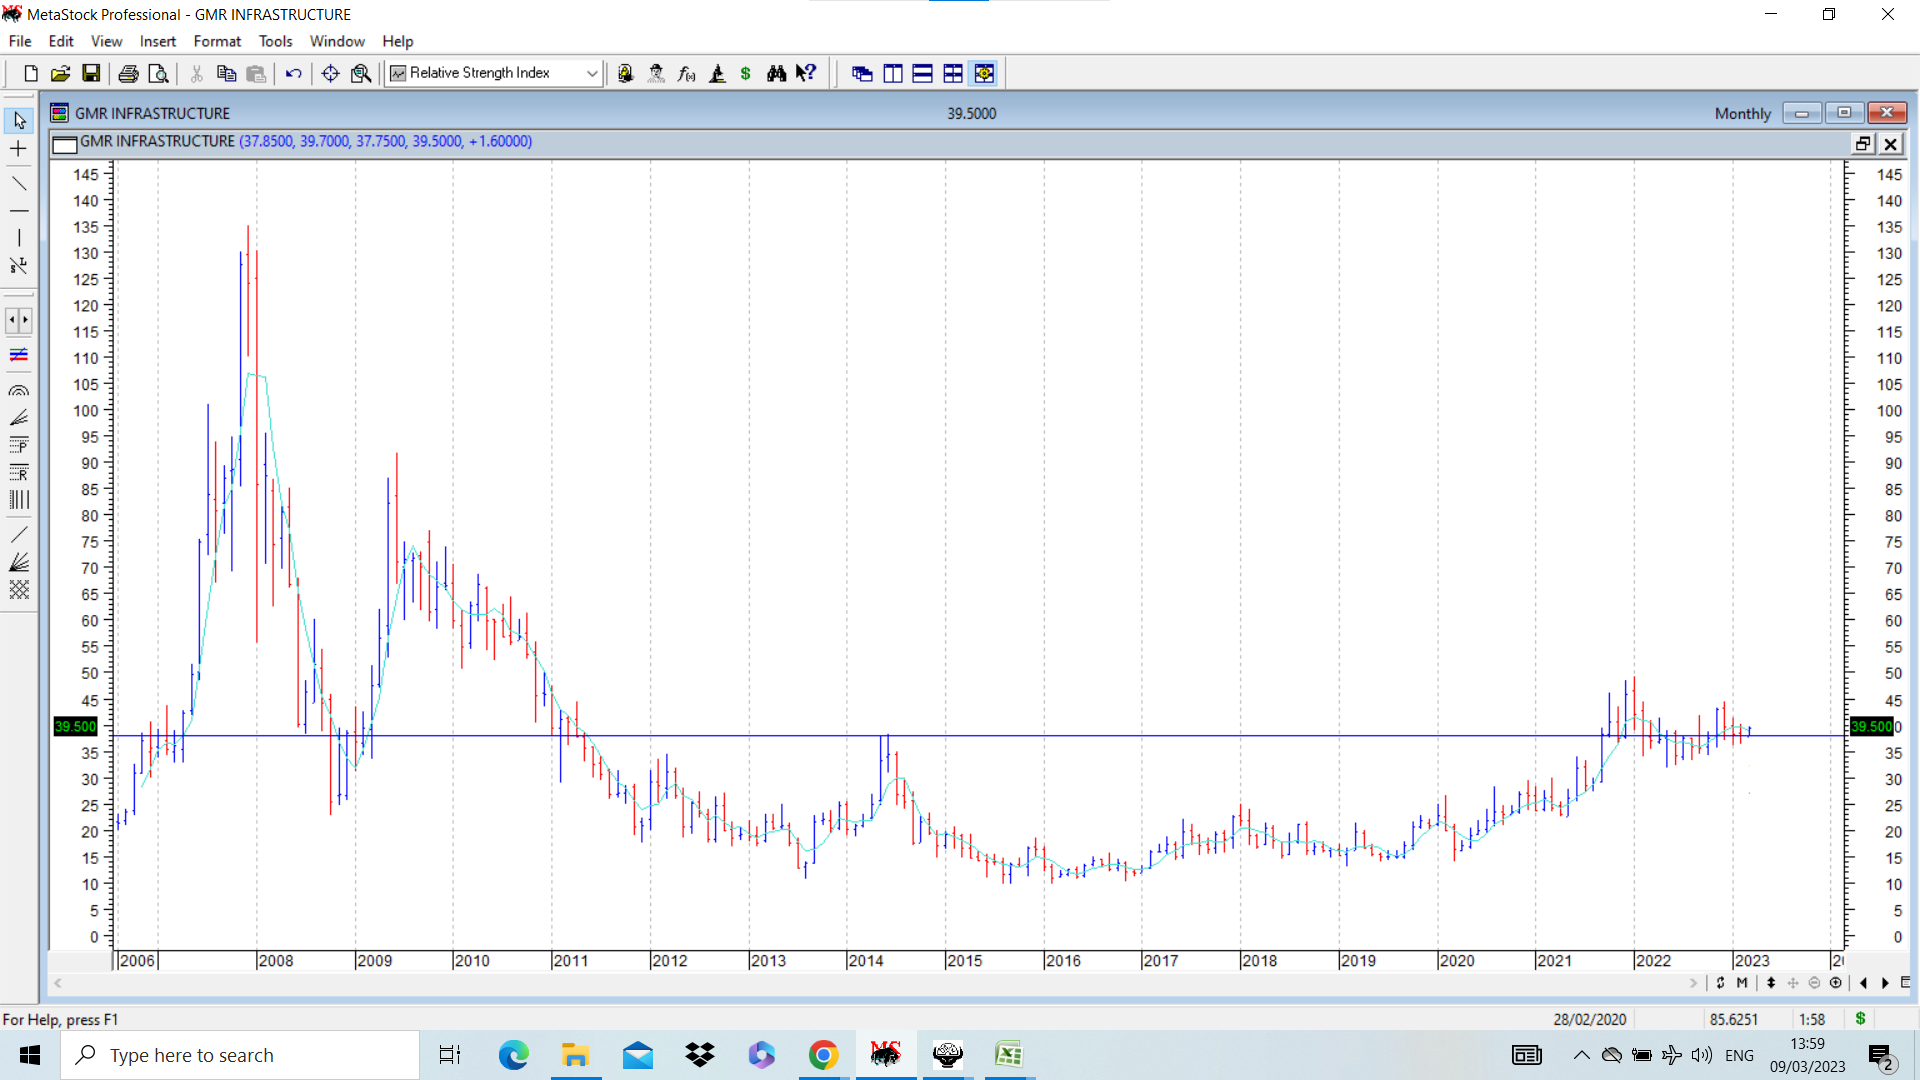
@hitesh2710 bhai GMR has been range bound since quite sometime. ~37 level acting as strong support. Do you still see rounding bottom pattern might play out and target remains in sight. Thanks in advance.
Hello Hitesh bhai. Markets have been going nowhere and we are time correcting in most of stocks where valuation is not very expensive / growth is visible.
My question to you is how do you view current trend in stocks where stocks are going nowhere but aren’t falling a lot as well ( sign of strength ).
Do you hold on to these momentum / midterm bets or is it wise to sell and move to other stocks showing breakout.
And when is it that you change view on the stocks apart from fundamental changing.
1 Like
GMR had broken out of its 11-12 year highs above 38 and went up to 49 and then corrected and retraced down to 32, and currently is around 39. What is important here is that this is a pattern clearly visible on monthly charts and the last major peak was in 2009 at around 92, which is where the stock could be headed if the rounding structure keeps playing on. But for that it will take a lot of time as we are looking at a pattern on monthly charts. As mentioned before, price can fluctuate in a wide range, and one has to be able to digest these ups and downs. And then hope that the pattern plays out and targets are achieved. ![]() Putting up a monthly chart of GMR below.
Putting up a monthly chart of GMR below.
7 Likes
Markets overall as you say have not gone anywhere. And many stocks also seem to be stuck in ranges and not making big moves.
But then there is always a bull market somewhere and it is our endeavour as investors/traders to try and pick up where this bull market is shaping up and try and pick it up as early as possible. And then find good companies to ride it. Easier said than done, but if one tries hard, out of say 5-7 sectors which are going to go up in future, one can pick up maybe 2 or 3 and try to ride these.
Personally I have a core group of high conviction bets that I have bought with a 2-3 year view with an eye on monitoring how the story is panning out. The exact path may not be as I may have expected, but the trajectory should be what I expected. The angle of trajectory may vary from time to time, but overall it should be a growth story. With these companies I hold the major chunk as it is, but in a small portion of holding, I often indulge in short to medium term trading based on charts.
In rest of the part of portfolio, I try to play sectoral themes/techno funda picks etc. But these have a definite buy/sell price, stop loss and time frame pre decided at the time of entry.
In current markets, there is often a lot of consolidation before a major upmove happens and that is something that has to be accepted as par for the course and our style adjusted accordingly.
Any change in view on any pick will happen when there is sudden break down in the structure, or a very fast breakout. In either of these situations, I have to decide quickly and act accordingly.
20 Likes
@hitesh2710 sir any views here?
Hitesh ji,
what is the plan of action now on KRBL… it has taken out 360 like you had asked… fudamentally the basmathi rice sector seems to have tailwinds… i got in at 210 …but not sure what to do now… ?
1 Like
I have put up the technical picture in one of the preceding posts. Plan of action now should be to study those details carefully, go through the concall of the company for q3 fy 23 and then take a call based on these details.
At the end of the day, if we are investing on our own, it has to be our own call after all due diligence.
@fundoo I don’t track titagarh wagons, but the chart seems to be very strong.
6 Likes
Thank you for all the insights though your amazing commentary @hitesh2710 Sir.
I wanted to know your views and opinion on Praj Industries. There is so much to like about the management and company but the stock for me has always been a market performer. While I was lucky to have entered this at 100 levels, I am wondering how much of the story is already in the price. What are some triggers that you will track in this company. Also what are some things that you don’t like about Praj.
Please search in the thread…you will get it.
2 Likes
Hitesh Sir, do you go onto use leverage/ futures/ options etc., when you feel the opportunity is mouthwatering and no brainer? If yes, how do you go about it, and if no, then why not?
I avoid getting into futures and options irrespective of mouth watering opportunities. Not my cup of tea. And I see a lot of rookie investors getting into futures and options without fully understanding the game. Personally I think this is a game that requires high level of skill and should not be attempted by rookies with half baked knowledge.
@chaaip I don’t track Praj industries, but you can go through Praj thread on VP to get a better handle on things.
14 Likes
Hi Hitesh Sir,
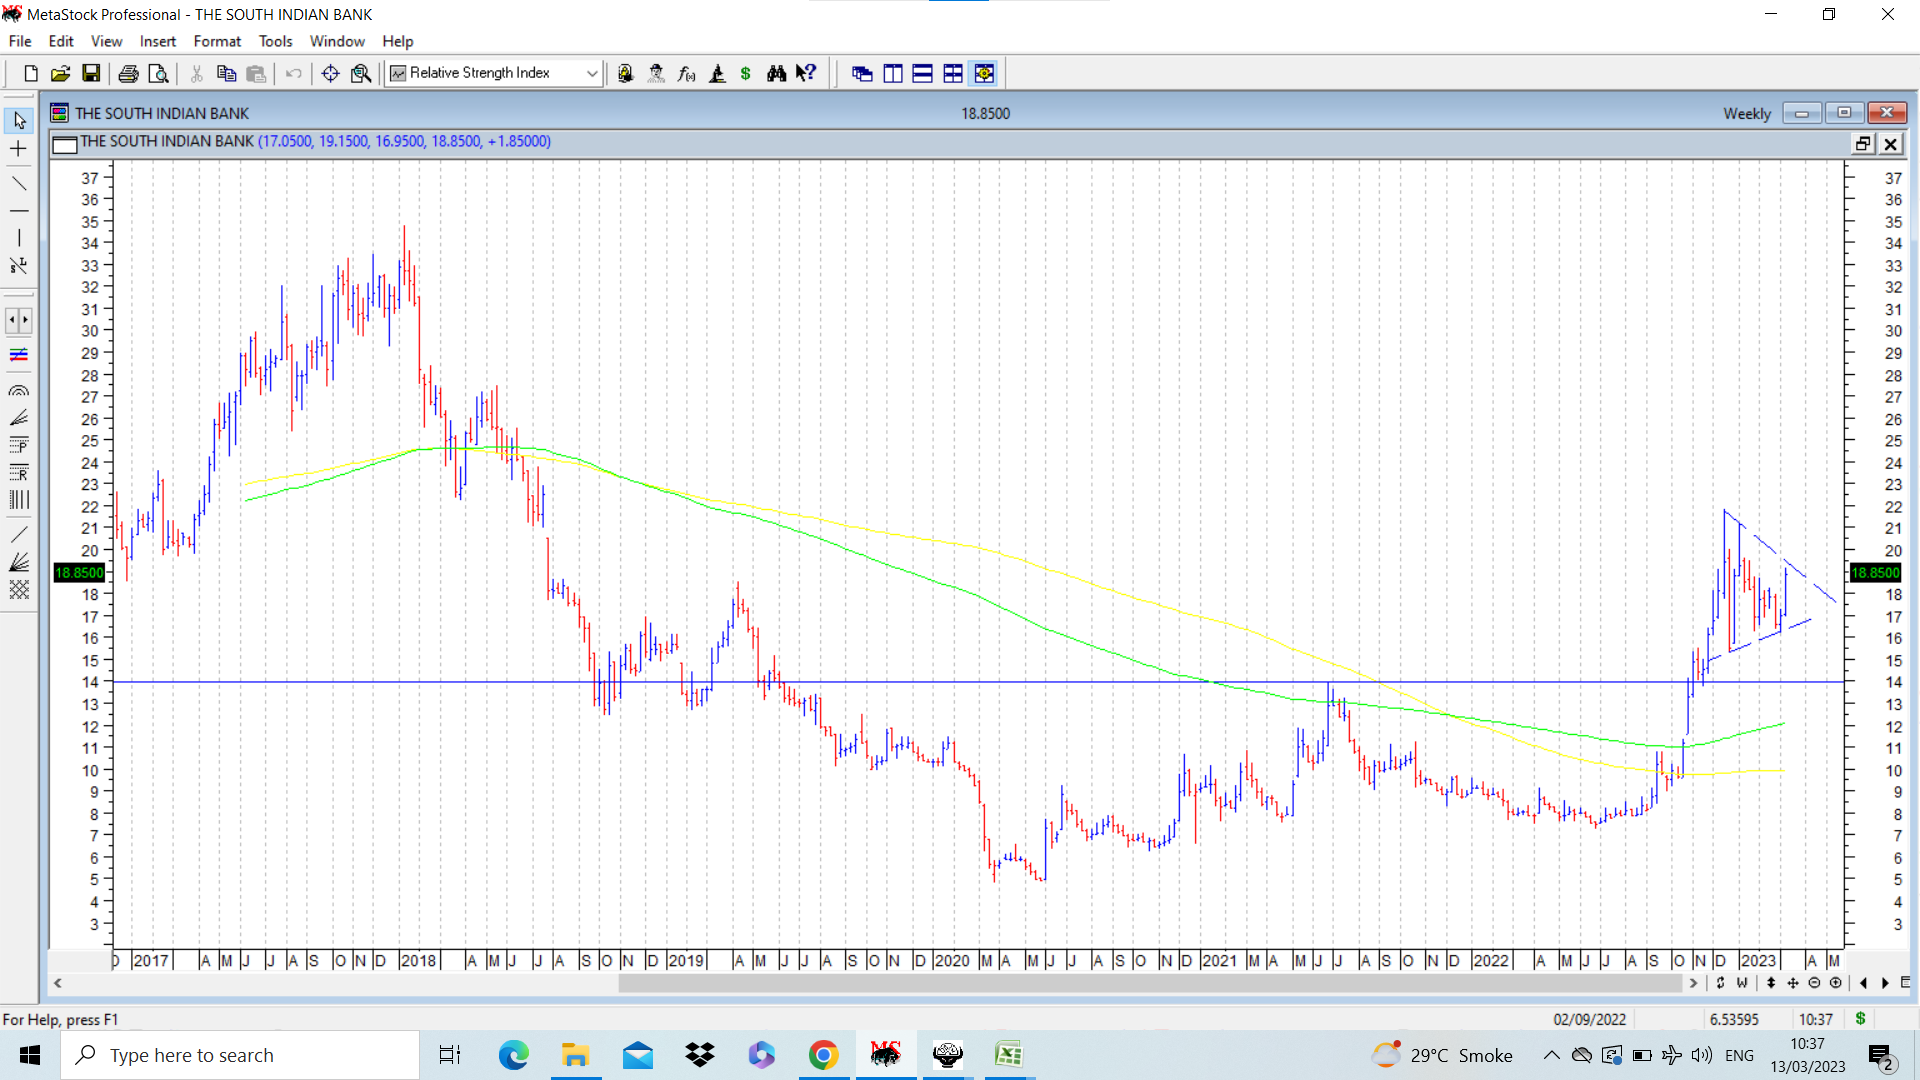
Any technical view on South Indian Bank ?
Hi @hitesh2710 bhai, it would be great if you can shed some light on SCI demerger. There is a lot of news. How can one play such special situations?
Thanks.
1 Like
South Indian bank broke out of a 3 year high above 14 back in Dec 2022 and hit a swing high of 21.8 and went into a corrective/consolidation phase. The consolidation has taken the form of a symmetrical triangle and a breakout on either side is awaited. As of now for me, it remains in the watchlist.
@Keshav1206 I don’t follow SCI anymore.
5 Likes
Hitesh Bhai - Could you elaborate the above?
My understanding was that the formations such as symmetrical triangle, pennant, and flag after a sharp runup are rest areas before extending the prior uptrend. TIA.
2 Likes