@Surender
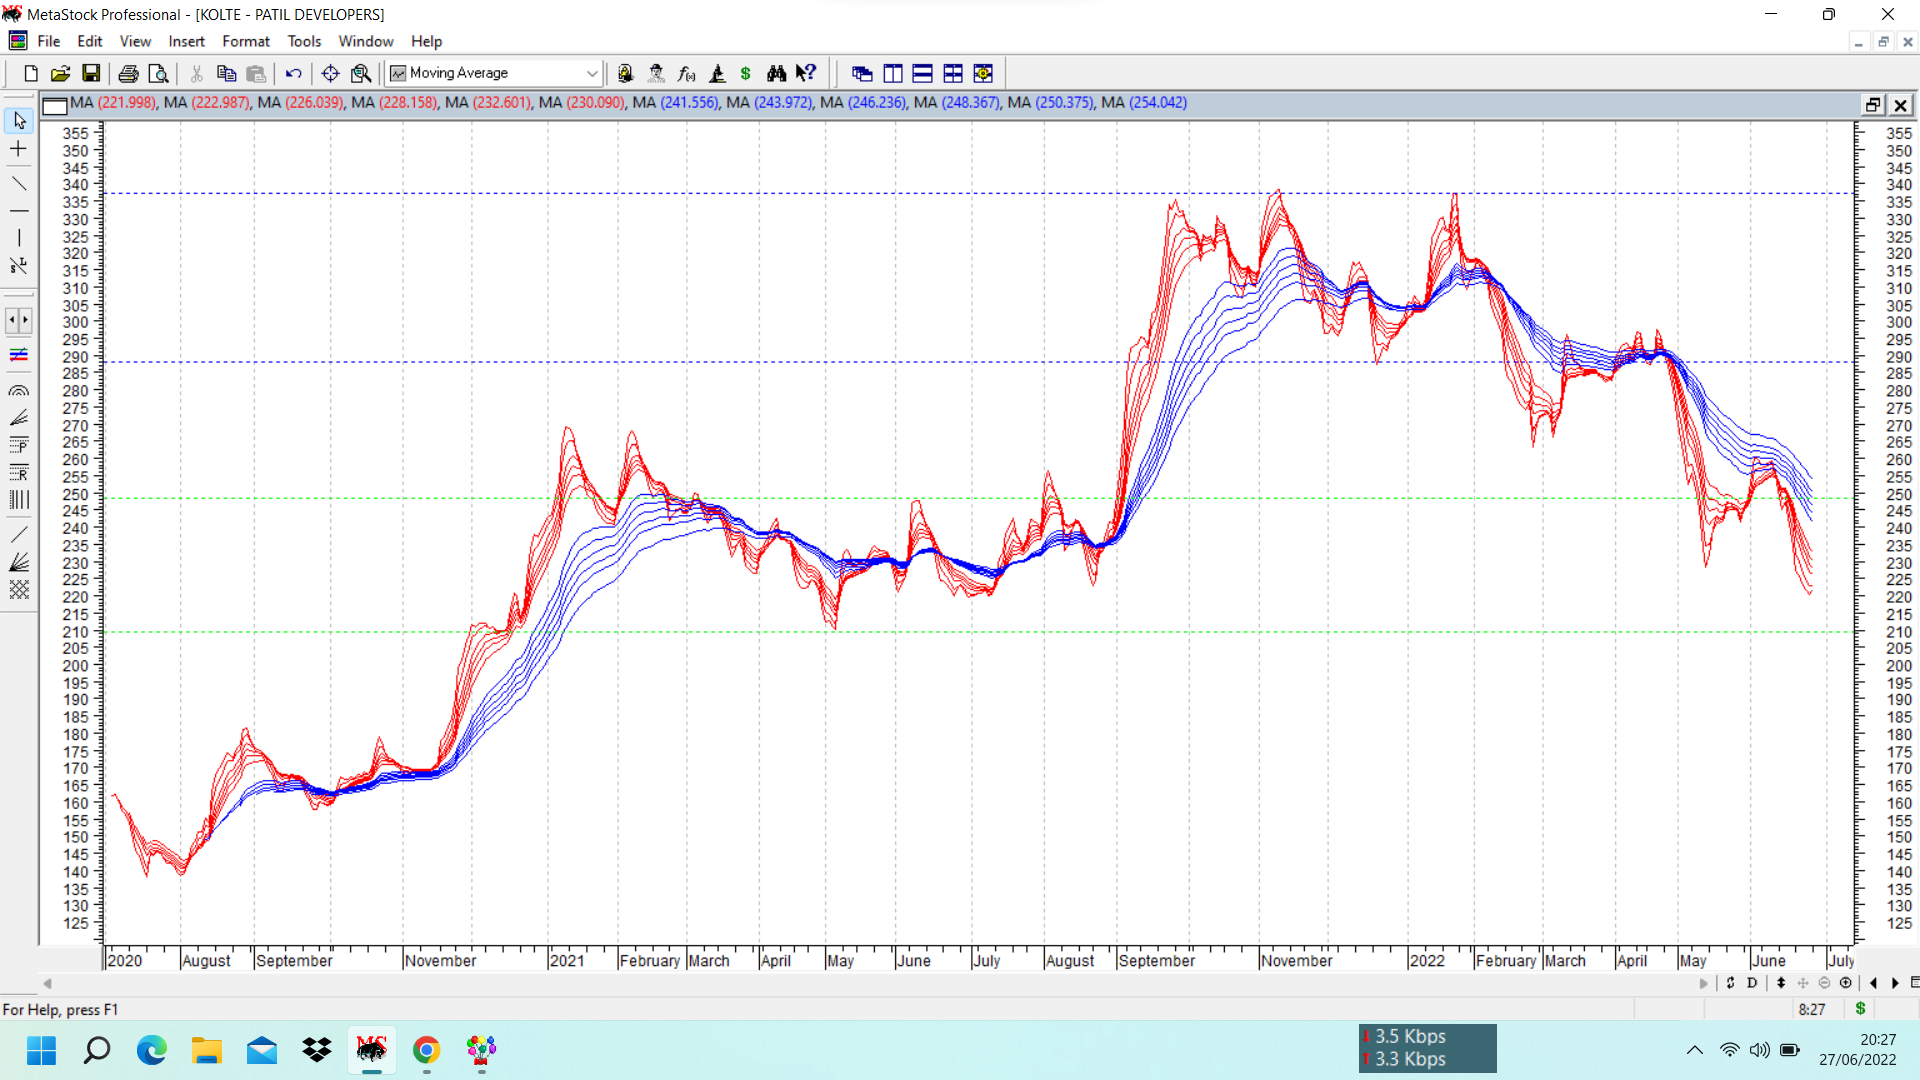
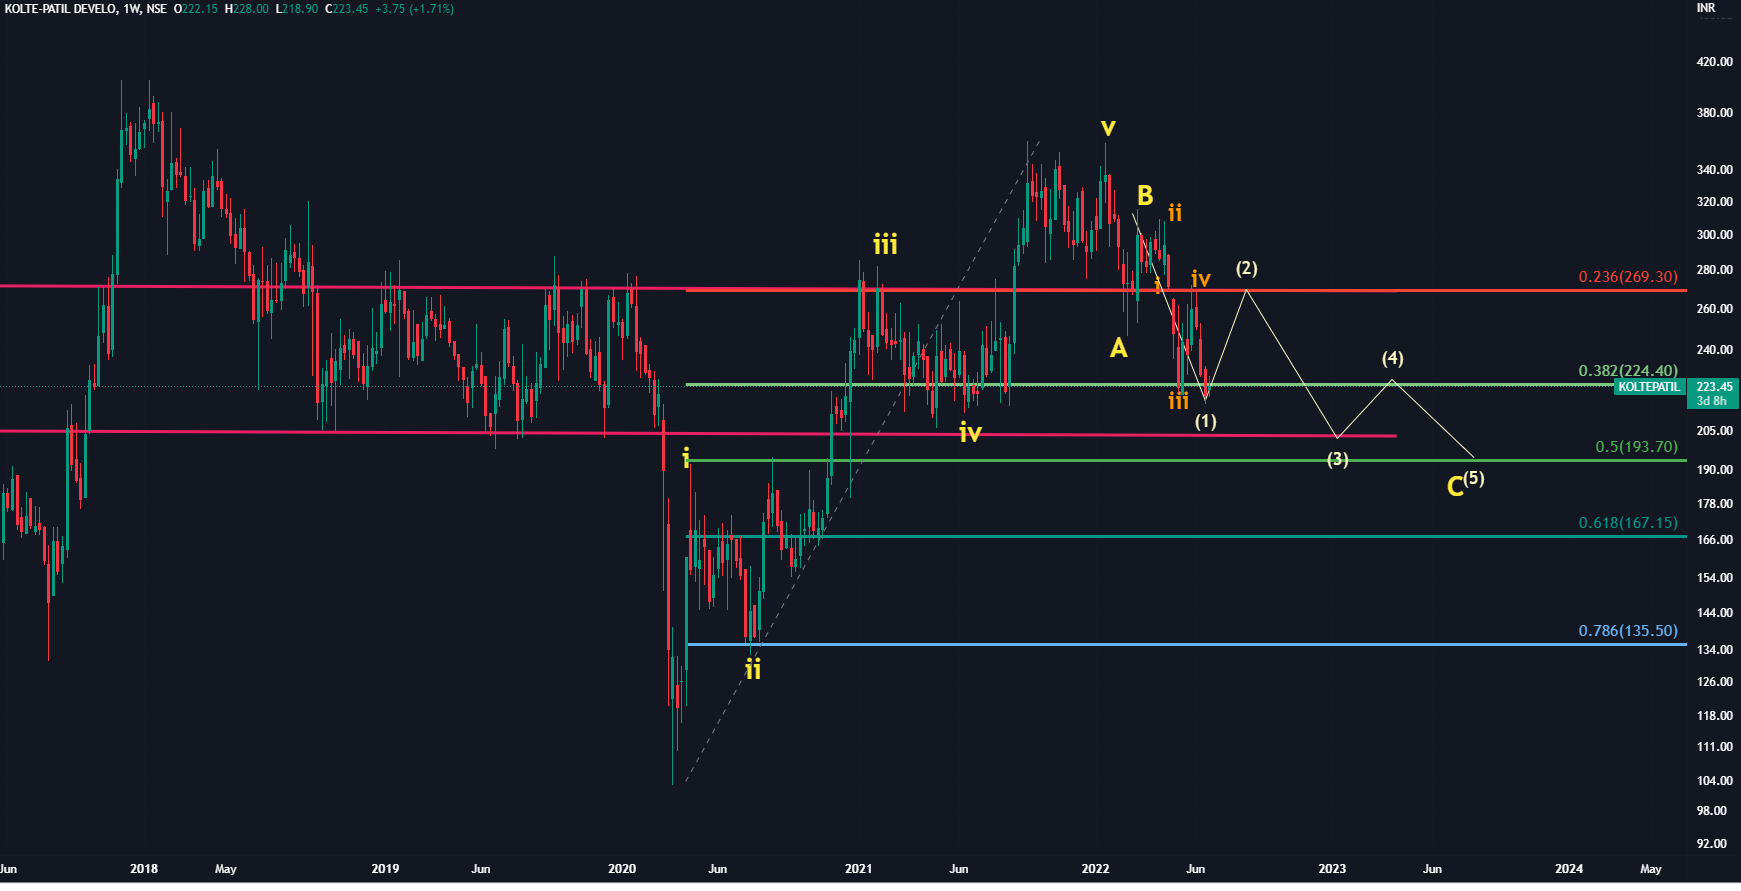
The analysis of Kolte Patil is spot on. But do not depend too much on pattern targets. Do not consider support/resistance in absolute numbers, Consider price zones as support/resistances. On the way up, stock price consolidated between 210-250 for a long time and that zone needs to be watched for any bottoming formation. (this area is marked in green dotted lines)
Stock price made a double top and broke down below 290, giving confirmation of a bearish double top breakdown. (area marked in blue dotted lines).
Overall the structure does not look too good and it might be wise to remain a spectator in these kind of charts.
6 Likes
@Vineetjain111
I usually like to keep things simple, and avoid putting in too many parameters and variables in a chart. So I tend to look at traded volumes and that often suffices. I do not use delivery volumes or any derivative of it.
Looking at the chart put up by you and the delivery percentage details, one thing that immediately strikes is that on days when volumes are high, delivery percentages are also higher. That should be enough for anyone checking the authenticity of volumes.
If you put in too many parameters, there will be some contradictory signals emanating from them and this kind of too much analysis will often lead you up the garden path and lead to paralysis.
Focus only on a few things, but try to be very good at analysing them.
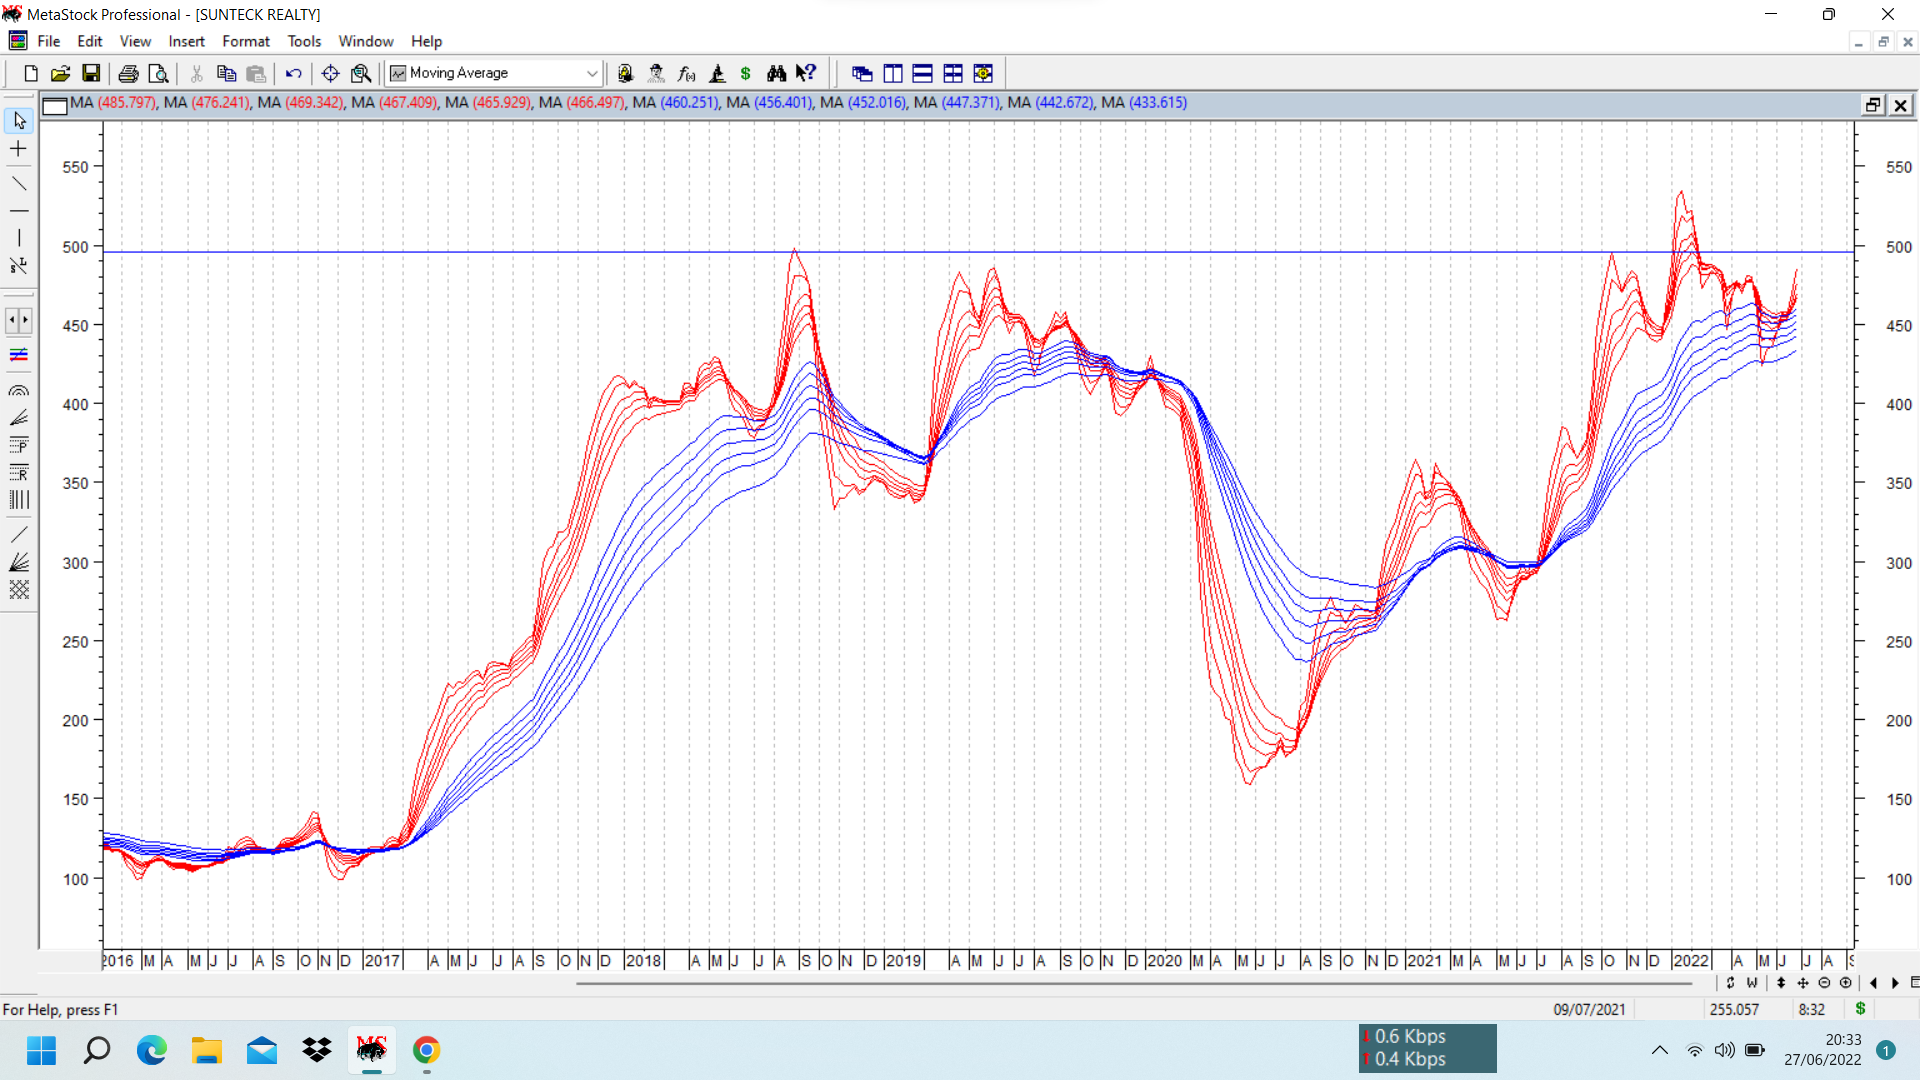
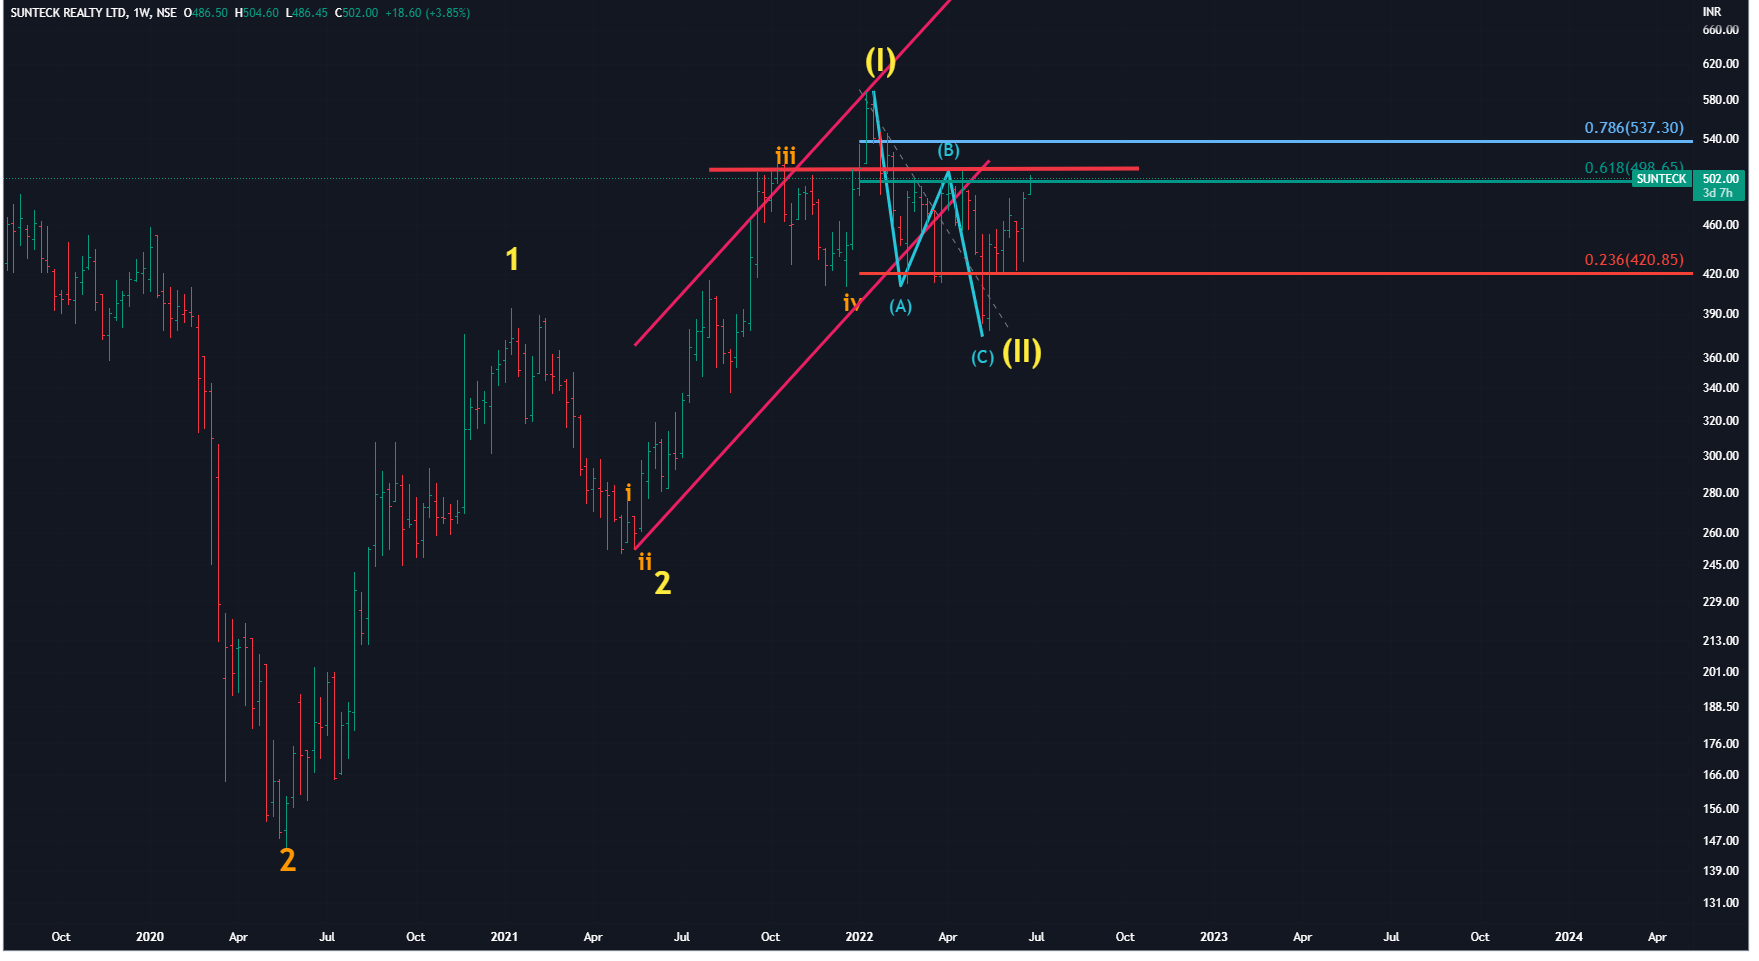
In the GMMA chart of sunteck realty, we can clearly see that stock price broke out above previous all time high of 495, went slightly above it and faced selling pressure in line with weak markets. However the long term moving avgs ( in blue) offered support and stock price in short term too seems to have reversed direction.
Putting below, the weekly chart of Sunteck Realty. With observations already noted above.
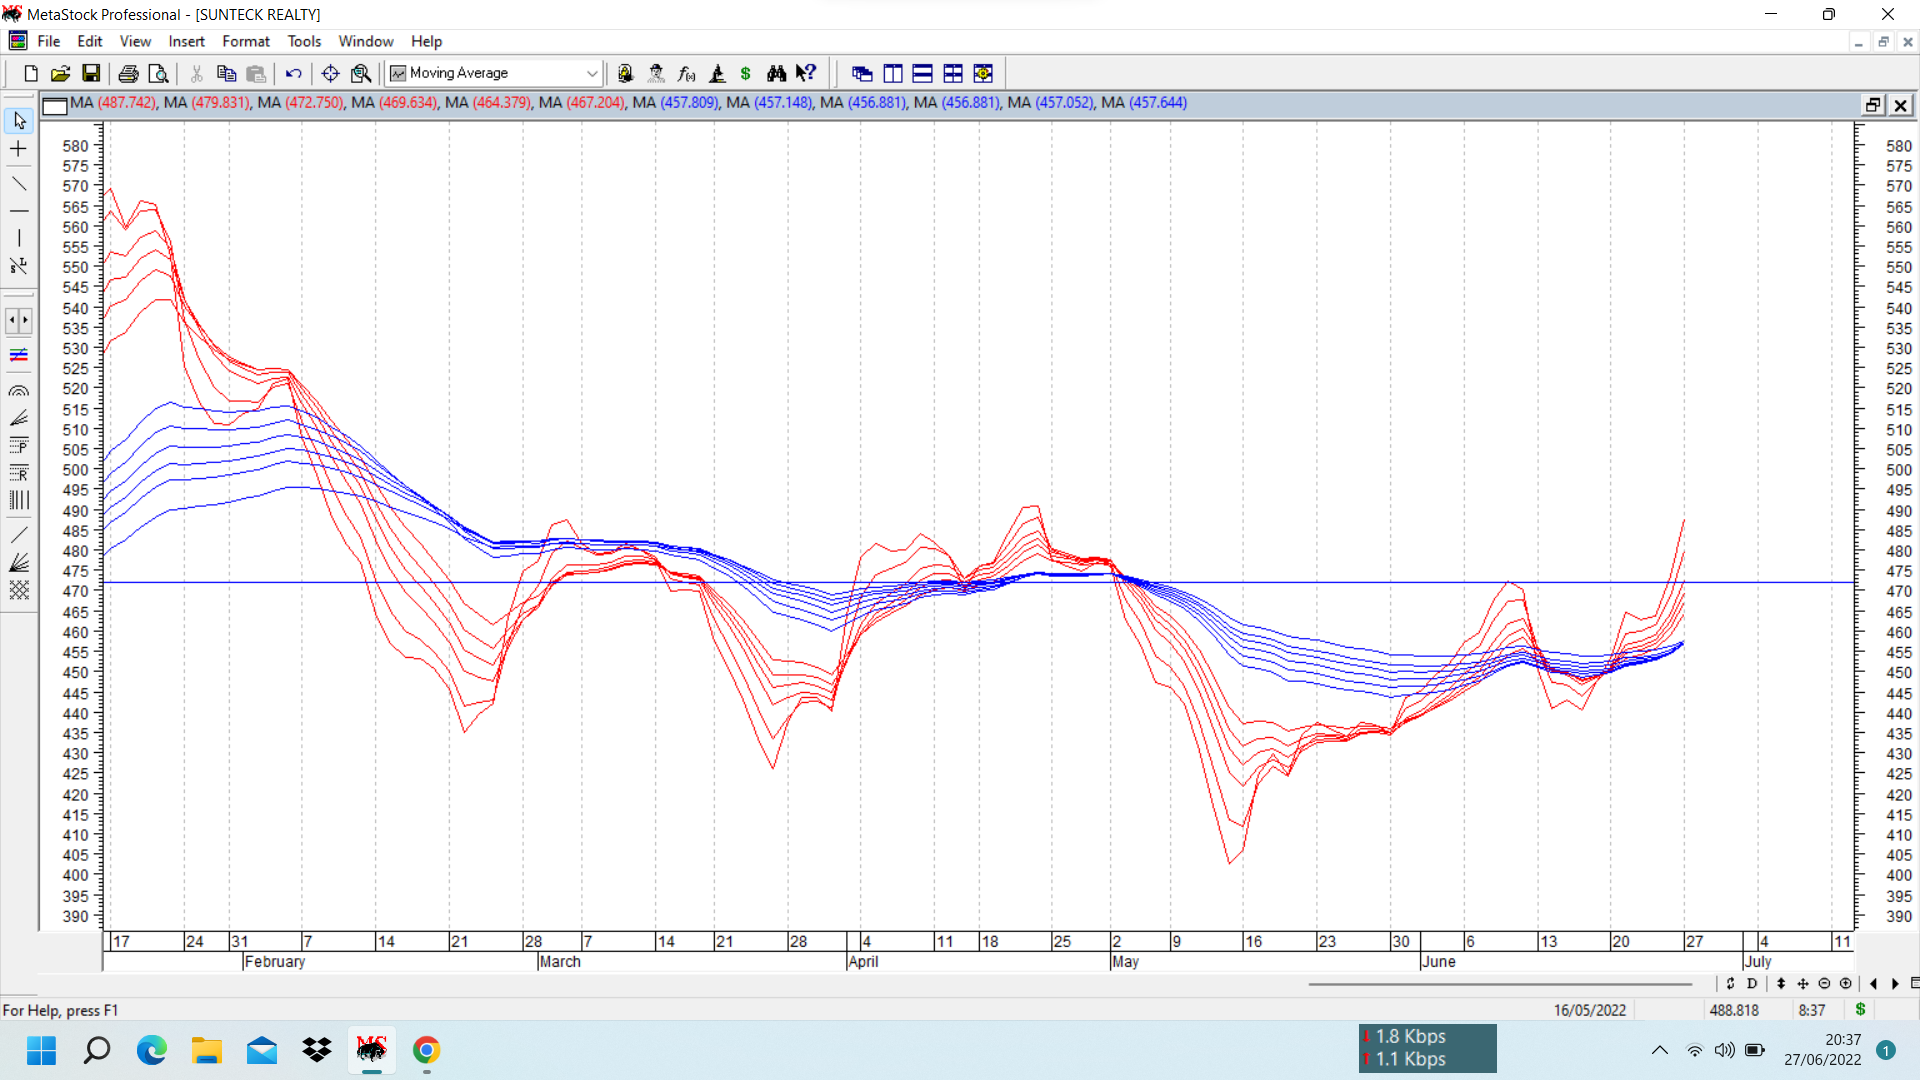
Now coming to short term daily GMMA chart, we can clearly see a small cup and handle breakout above 470. If this plays out, it can provide targets above 540, and ultimately the stock might resume its uptrend. This however depends upon the general market strength and fundamentals of the company.
14 Likes
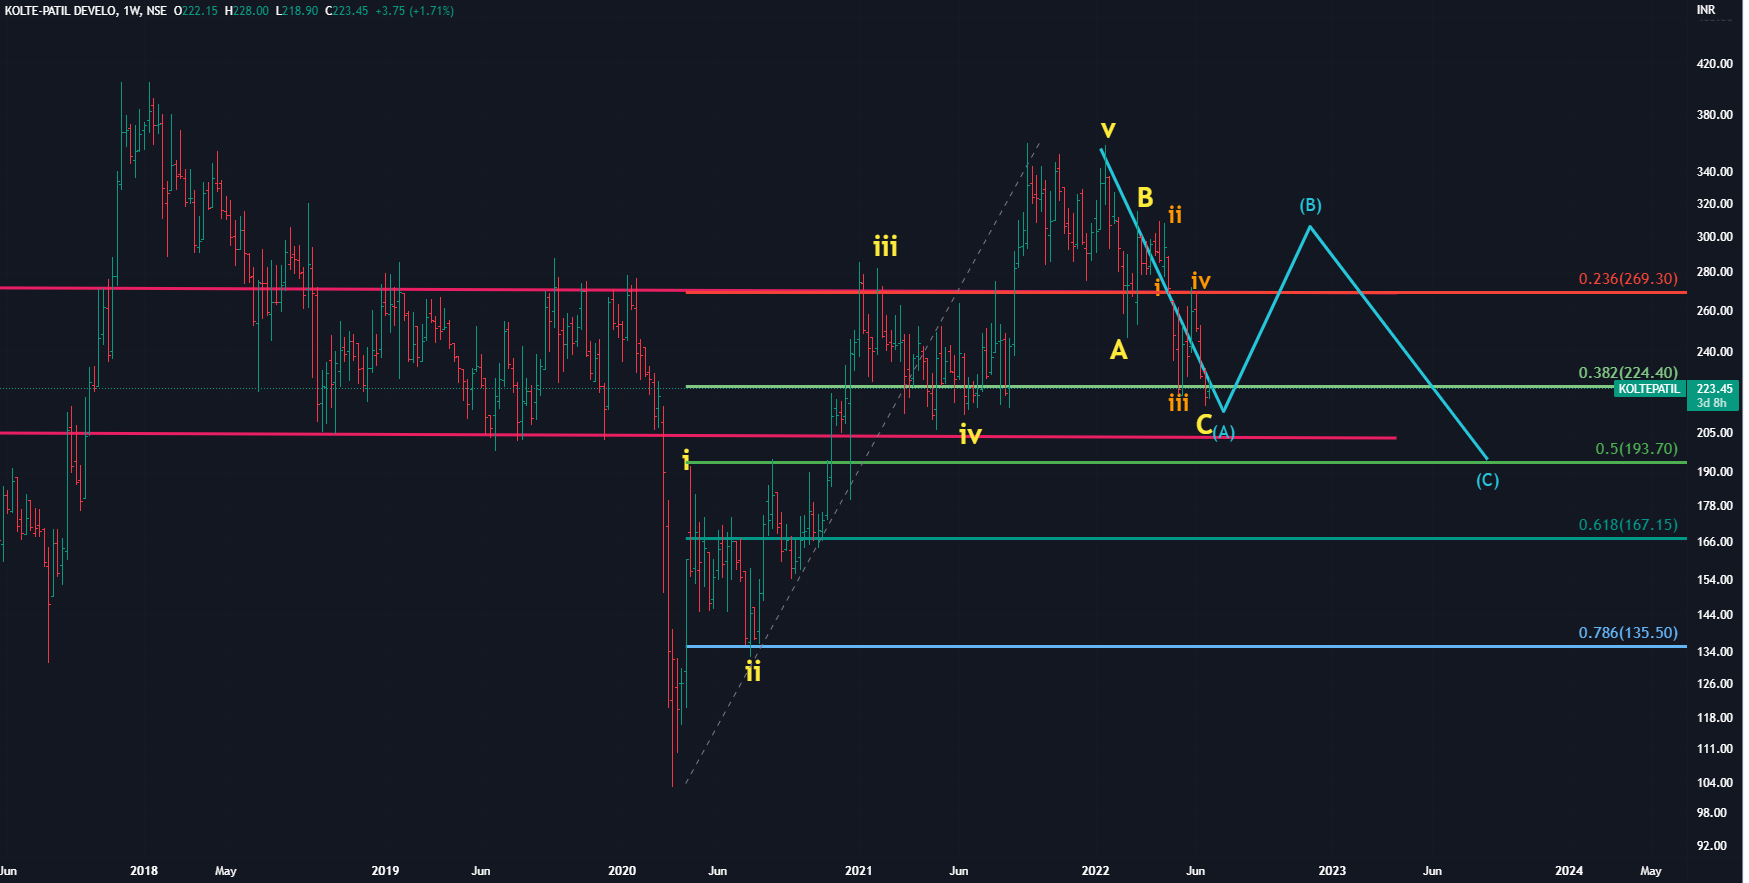
Had a look at the past history of Kolte Patil and tried made few probailistic scenarios based on EW for coming future.
a) Stock has a history of giving deep retracements after every rise…in between 50 % to 70%. Current fall is near 35% retracement. So more can be expected.
b) Every rise to resistance (or new) levels shows bigger upper wicks on candles (on weekly charts ) and drawdown, that means there are buyers always waiting to sell at every level.
c) Most of the real-estate charts ( Godrej Property ,DLF ) don’t give lot of confidence
In above context as well as market & sectoral sentiments ,here are two probability scenarios
Scenario 1.
Assumint that we have completed first zig-zag correction (blue font A ) and now are bouncing back in bigger Wave B (blue font) - then it might be followed by anothe Zig Zag in shape of Wave C ( blue lines ) ( double Zig Zag)
Scenario 2
Assuming that , we might complete the whole correction in this first Zig Zag (ABC) itself.
These both scenarios don;t give lot of conficdence, but they do point out to same thing - 50% retracement for the whole bull run from March 2020 lows ( matches with the past character of the stock, and also EW requirement that many of the retracements happen to end near the lows of wave IV of prvious 5 waves run.)
Keep in consideration -these are weekly charts. Scenario of weekly charts tend to take weeks/months to play out unless it is a voracious bull/bear market.
Disclaimer : These charts are for study purpose. These charts are made on past patterns of several stocks, may or may not work on a specific stock ( can’t generalise everything ) . Hence take these probabilistic set-ups as probabilities only and probabilities don’t come true many a times.
3 Likes
Sunteck
Had a look at the same, although a strong chart but currently laming due to overall market sentiments.
It should cross immediate hurdle of 510 and then 537 to make any singnificant upside move.
Otherwise it would keep lingering in a range .
Disclaimer- These charts are for studying the probability set-ups. These set-ups may or may not work.
3 Likes
I am thankful to Hitesh Bhai answering so many queries . Most of mine are answered when the good Dr answers some one else . I guess this tread must be left to him to put in his thoughts on queries asked and in general his views .
2 Likes
Hi Hitesh sir, what’s your view on RBL bank?
@pcygnii
As earlier mentioned, I got stopped out of RBL Bank when it broke its all time low of around 100 with big volumes. Will review it again if I see strength/consolidation in the stock price.
2 Likes
Hitesh Bhai. Gujarat Flourochem is around 52weeks and is one stock, which didn’t fall in this bear market. Technically how you see the stock?
@ram1984
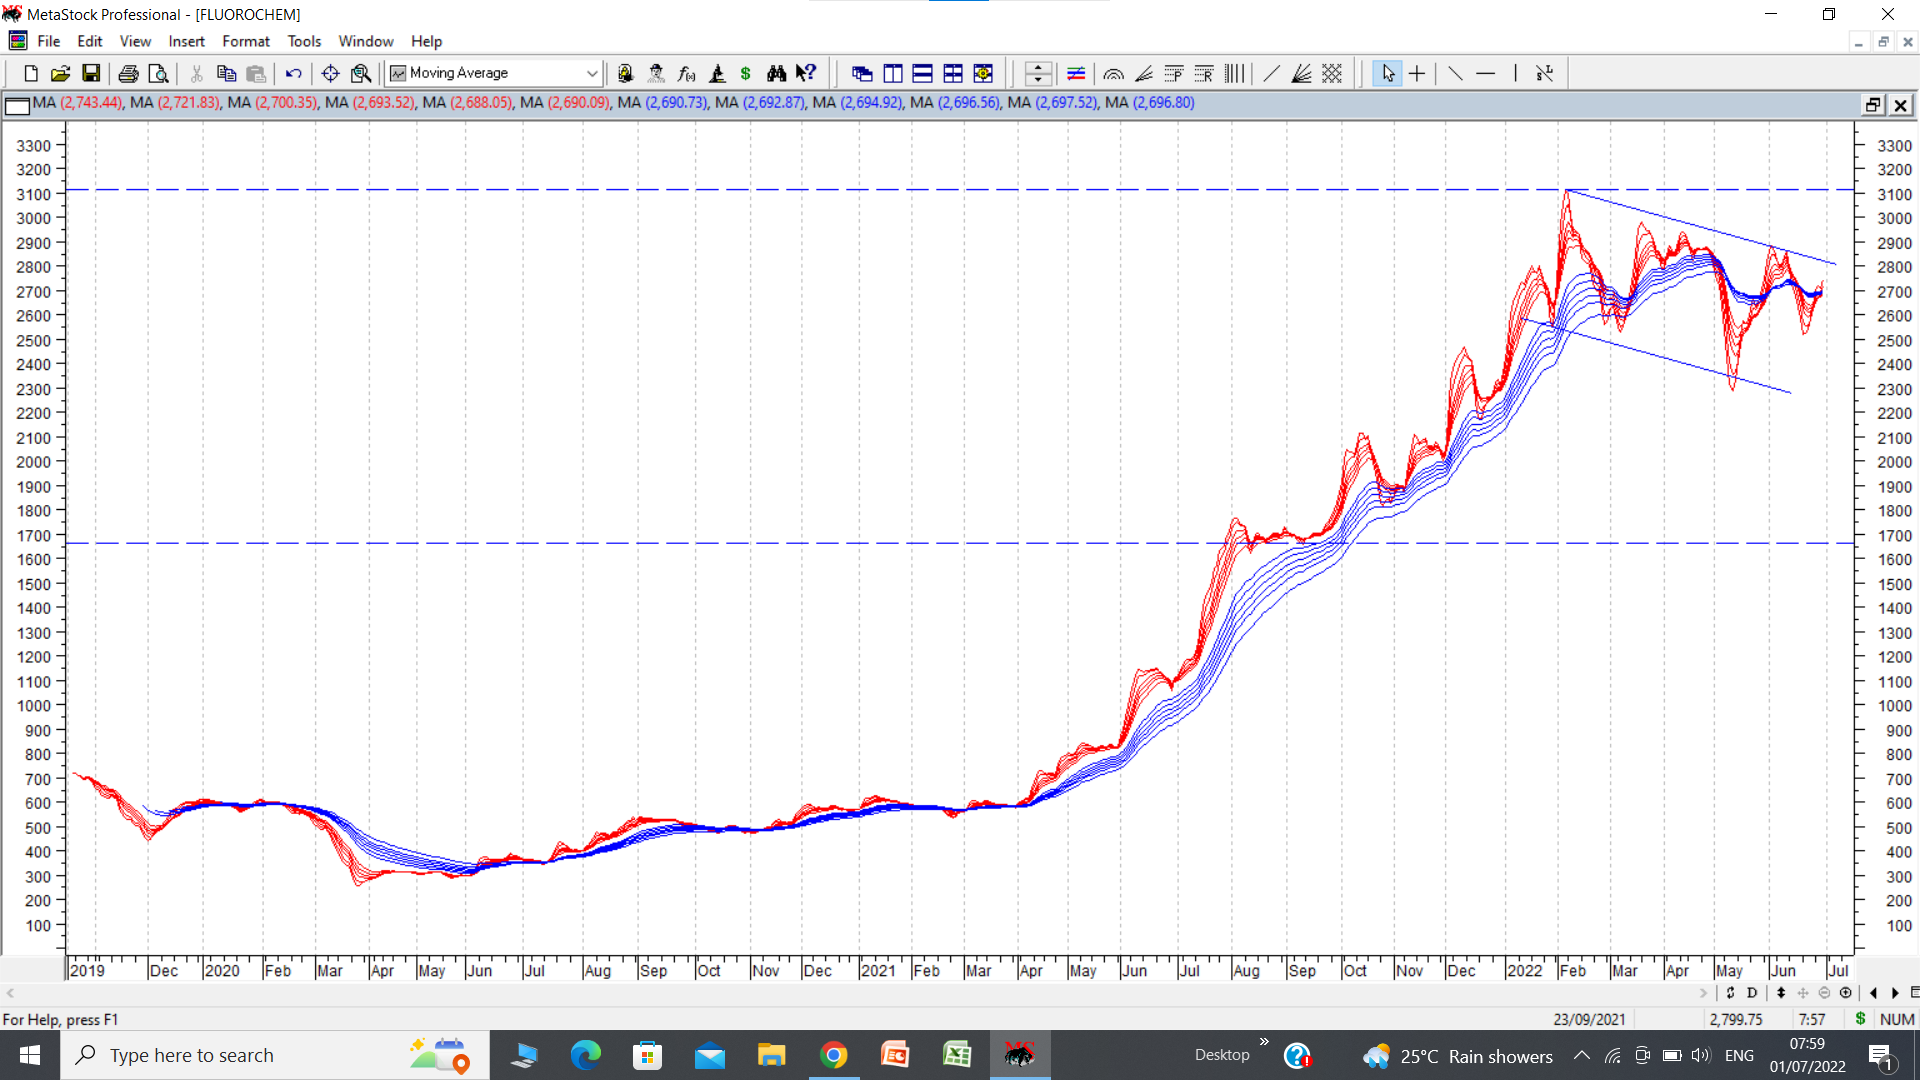
Gujarat Fluoro is a good combination of technicals and fundamentals in a company. From all info available from q4 fy 22 concall, it seems to be on a strong wicket in terms of growth and profitability. One can go through the relevant thread on guj fluoro on VP where a lot of detailed work has been done.
On the charts, it seems to be forming a medium term flag pattern which has a breakout above 2800 on GMMA charts. . If and when that happens stock price can see decent upsides. disc: invested.
11 Likes
Whats your view on LT foods and adani wilmar hitesh ji
1 Like
@hitusohi1
LT foods is a quasi cyclical business, with a lot of variables affecting the business, most important among them govt regulations related to permission to export rice etc… Looking at its history, it comes across as a business destined to remain cheap because even with higher profits, return ratios do not show big improvements. ROCE have remained in a broad range of 10-15% over last many years.
In this kind of business, when there is some kind of market fancy because of whatever reason, one has to keep the fact in mind that this is not a business that is going to find consistent fancy with the markets. So if froth begins to be visible, its prudent to exit.
Adani Wilmar is something which I do not track too closely.
11 Likes
Hitesh Bhai wanted to pick your brains on PE multiple/ratio. How sensible it to invest in growth stock with PE multiples which are not at decent levels.
At times, i have found that when the market sees growth visibility, the stock may not fall much in any market but at the same time the PE isn’t reasonable. Schaeffler for example seems to have good earnings visibility, and all other positive things like management bullish commentary etc., but stock if i am not mistaken even at 1800 levels was richly priced.
So what is your framework when it comes to buying growth stocks? Are these always better only to ride the momentum or there will be logic behind buying and holding them for longer periods like upto 5 years? There is one thought that long term investing for 5-10 years works better if one gets the entry price decent.
1 Like
@ram1984
High PE will sustain as long as earnings sustain. Or till markets think that the runway for growth is intact. And till market is sure about quality of business, quality of management, etc. In short, where all boxes are ticked. Some examples that come to mind are the compounders like Nestle, HUL, 3 M, Page etc. Inspite of a couple of lacklustre quarters, these stocks do not collapse. They merely correct to some extent and once the business momentum returns, these stocks start moving again.
The other set of stocks that bear noticing are the ones which are the flavour of the season and attain high PE valuations after a few quarters of good nos. and start being touted as great growth stocks. These are often misunderstood as high quality companies while they are average companies having a good time with strong tailwinds. One has to be careful about paying high valuations for these kind of companies. Once the tide turns, stocks fall big time. Recent example is that of chemical companies and newly listed companies which were praised to the moon.
My framework while buying growth stocks are to look at growth of the company and not focus too much on the PE. Many a times fast growers tend to grow at very high rates for a few quarters and makes the high PE look cheap after a few quarters. In these kind of companies as long as growth continues, it makes sense to remain invested. The only exception is in some instances where markets get more excited than what company fundamentals warrant the stock prices go up with a lot of froth and hoopla. In such situations we have to think about incremental expected returns from that point of time. In these cases, one needs to atleast trim the positions because inveitably stock prices tend to cool off for a period of time before moving up. This is usually the time taken for earnings to catch up.
Many a times stocks that are current flavour of markets tend to go up much beyond our expectations even if they are not so great companies. Recent examples were GMM Pfaudler, Alkyl Amines etc. Few years back it was the likes of Kitex, Avanti feeds etc which went up a lot. And came down and are yet to see those tops even after many years of waiting.
While investing the idea should always be to look at history of consistent stock market winners and stocks that go up and come down quickly and see if we are able to differentiate between the two, based on learnings from the history.
41 Likes
Hitesh Ji
First things first. Thank you so much for your contribution to this forum.
Interestingly I was glancing through Dixon this morning, which I exited at 6000 levels.
I like this business a lot. Price is down to 3500 levels but still the company commands a PE of 100.
Your views on such cases where growth visibility is high.
Also your views if any on peg ratio. In the case of Dixon the peg comes to 0.5.
Thanks in advance.
2 Likes
hitesh ji Thank you for your analysis. Just 1 query, I was under the impression that Alkyl Amines is a good company…Its management is also good and from long time its sales, Margins and other business performance has been good. In recent past , its margin went off the roof…but generally speaking , i was regarding it a good company and also part of my portfolio with average sizing. It has fallen 45% from its recent high. But its capex plans have been good and timely execution. Kindly advise the reasons for putting it under “not so great” companies list. Thanks
1 Like
Might be a great company, but no chemical stock which is a B2B business deserves to trade at those multiples untill the growth is 50-60% per annum. Alkyl was a story of peak margins+Peak Valuations.
Once the story fails and Margins fall. Past winners take a long time to come back. As mentioned by Hitesh bhai countless times in the case of Ajanta pharma, Mayur uniquoters or Avanti.
26 Likes
Hitesh Bhai in the bull market no one wanted ITC and in the present market ITC hits 52 weeks highs. FIIs who were consistently decreasing have now increased their stake by 2% (10% to 12% - dec 21 to march 22 Qtr).
Fundamentally nothing has changed here. Infact one can argue, margins may be in a bit of pressure on account of inflation. How do you see this one technically at 52 weeks highs
3 Likes
@ram1984
Markets and stocks move in mysterious ways. ITC at around 200-220 was a butt of ridicule and there were a lot of memes going around related to it. When a stock suffers from neglect to ridicule, and has reasonably decent business model, a bottom is not far off.
And when stock price starts is upward journey the narrative also starts undergoing subtle transformation. Things which were being touted as negatives suddenly turn positive.
ITC represented what Peter Lynch descrbied as a fallen angel. There was no change in business environment or prospects, but there are times when there is big fancy with other sectors/names and people want to sell stuff like ITC which is not moving and get into faster moving stocks. And once the fancied sector and stock falls from grace, and there is a rush to safety, people start remembering the virtues of companies like ITC. That’s markets for you.
And there is enough of a street lag for convinced investors to load up to their heart’s delight in such names. Many a times the merits of a company are so obvious, that it feels unbelievable why markets do not recognise this. But as every dog has his day, every good company also has its day.
On charts ITC has shown amazing resilience and strength all throughout the latest phase of market correction and according to conventional wisdom imparted to us by the Gurus like Minervini, William O Neil, and others, these are the very stocks that will outperform when markets recover and resume their uptrend.
42 Likes
Hitesh bhai,
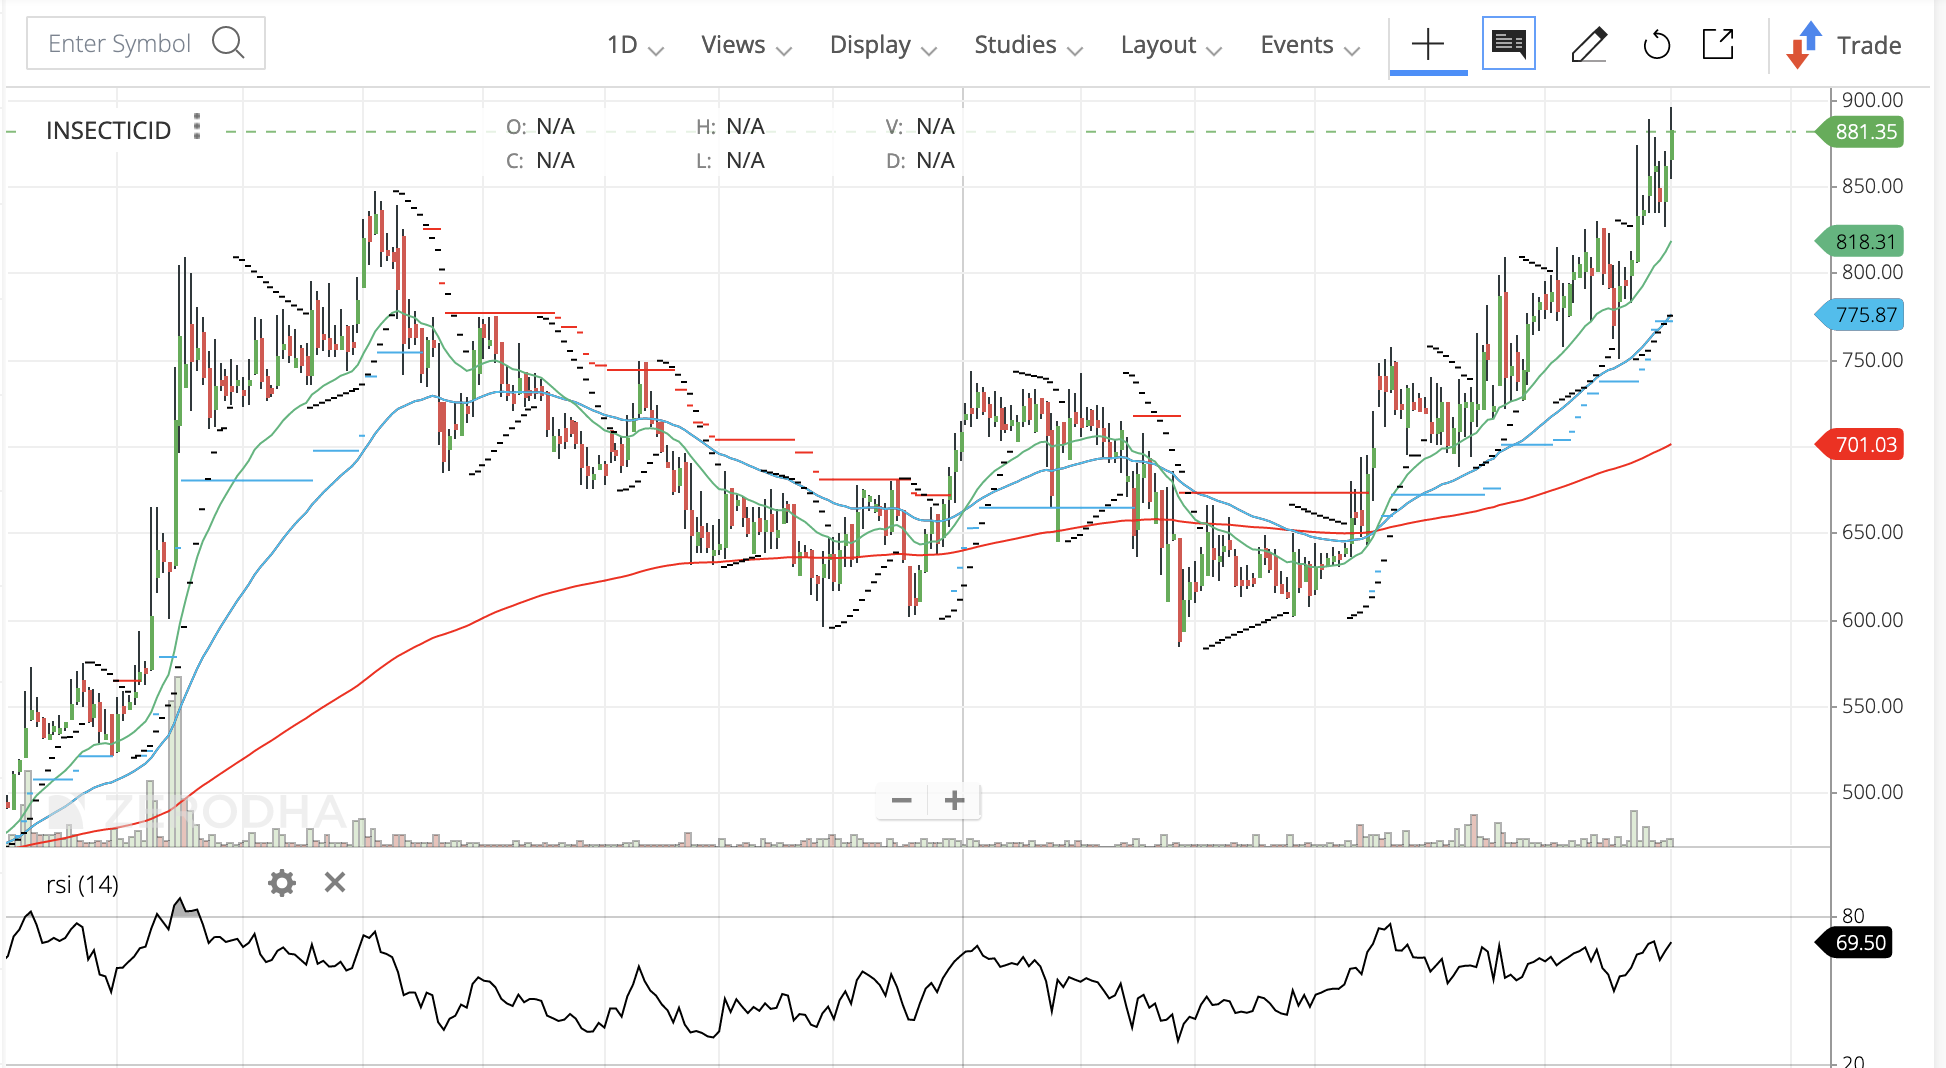
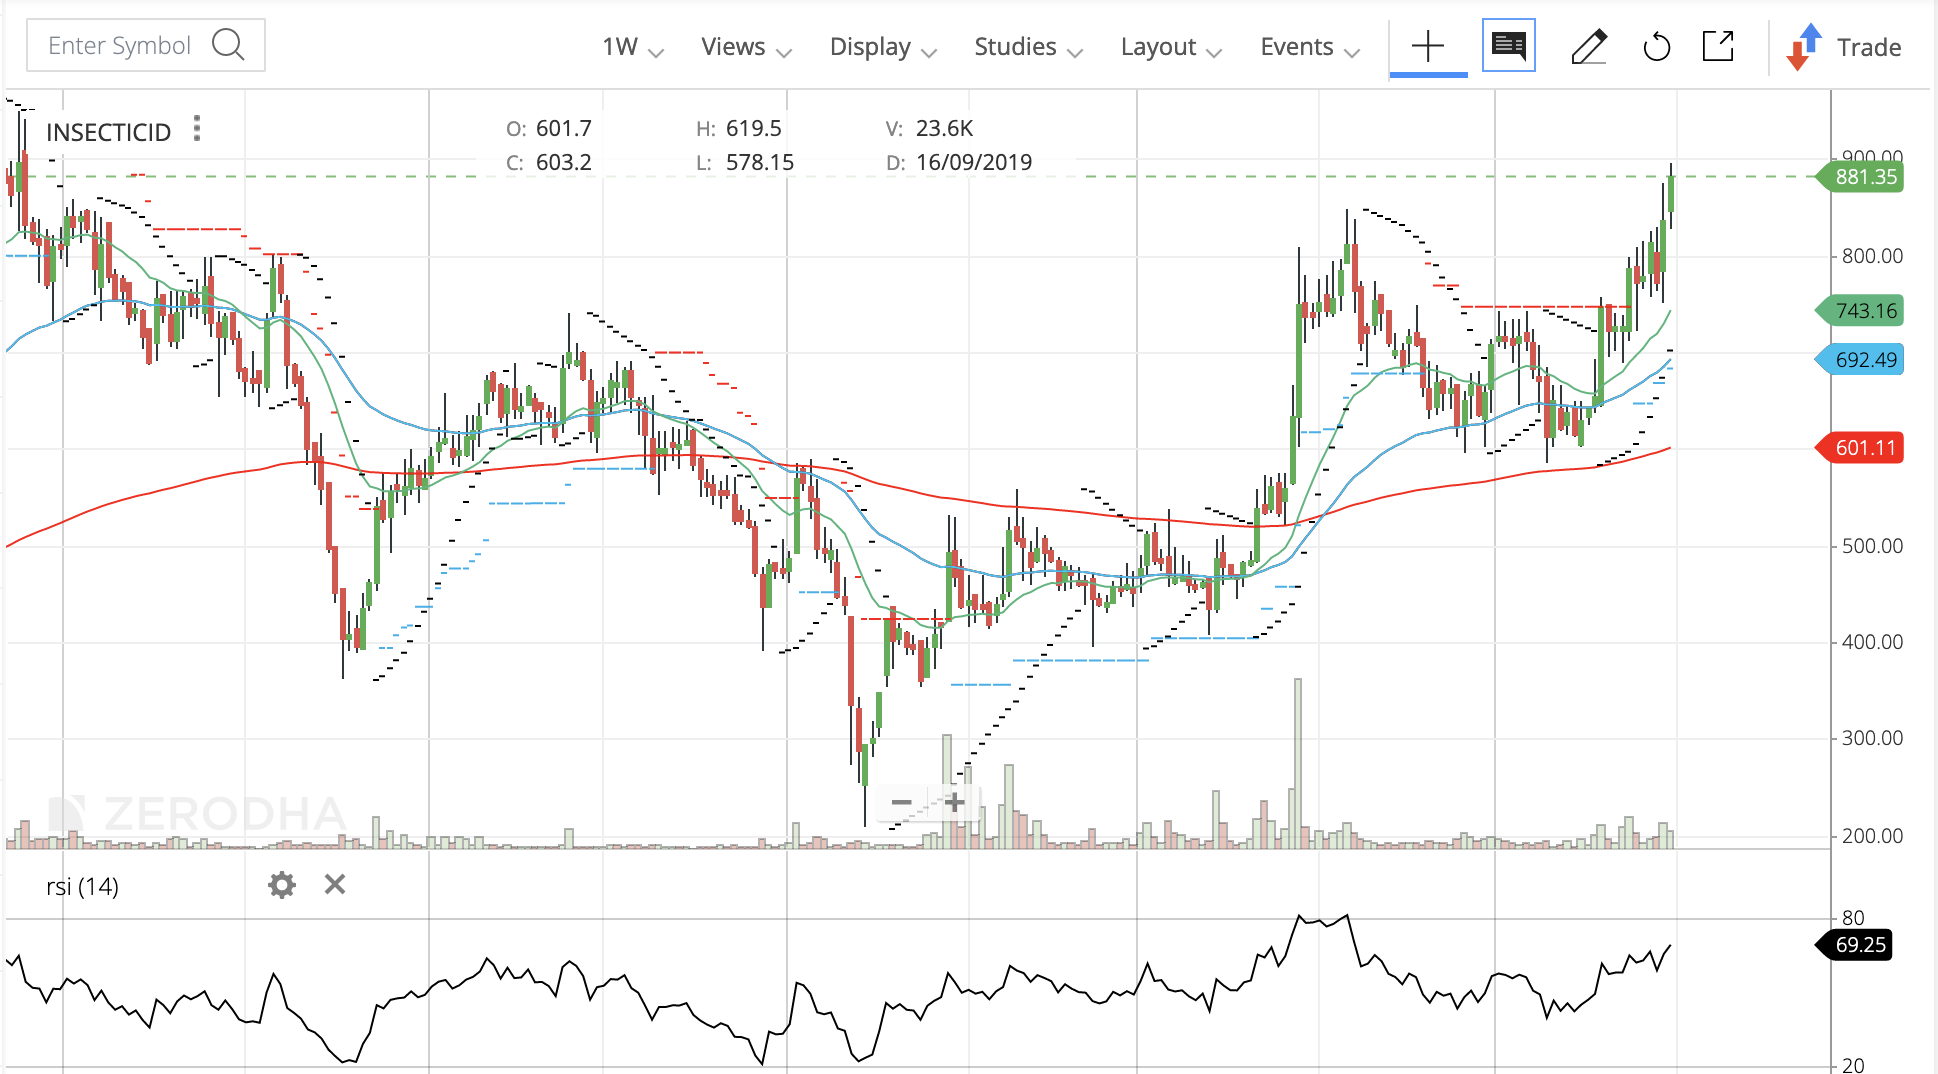
I was trying to look at good technical setups in this down trending market. One of the charts that looked promising to me was Insecticides India. I am attaching the daily and the weekly chart here:
Since, I am relatively new to technicals, I would love to pick your brains on the following:
- As can be seen on the daily, the stock is making new 52 week highs in this market with a rise in volumes. I also notice that it has formed a good rounding pattern. Would you agree with that observation and would that qualify for your first filter for screening ?
- In the last few candles where it is trying to make a new high, I see long wicks in the candles indicating that there is some supply pressure. Do you look at wicks while taking a buy decision on stocks trying to break out ?
- The weekly charts show a cup and a handle pattern. Is it ok to use cup and handles on a larger time-frame or are they more of a shorter frame pattern, in your experience ?
Any other observations you have on the charts will also be really helpful.
Thanks as always 
4 Likes
@manpritaurora
Insecticides India chart you put up shows a very good base formation in the form of a rounding bottom. It had a major resistance at 850 region which seems to be crossed. Next resistance is closer to 950-960.
I try to find sideways tight consolidation for a few days in such strong stocks and buy on any signs of breakout from these, with appropriate stop losses. If I am convinced about the fundamentals of the company, stop losses can be placed pretty deep.
Cup and handle pattern would work in any time frame. But for that to happen, markets have to be uptrending and company specific tailwinds have to be there.
13 Likes