Question from a rookie technical analysis student. May be its a basic question but I have not been able to get an answer after reading 2-3 initial books on technical analysis.
When should one use daily charts vs weekly charts? Are there situations when when should one use just one of the charts and not the other one?
William O’Neil wrote following lines in his book How To Make Money In Stocks:
To capture the biggest gains, it’s important that you use both daily and weekly charts, since they offer different views on the stock. You will get more exact timing indications from the dailies and the big picture from the weeklies.
At least my rookie eyes don’t see much difference between daily and weekly charts.
If you can share a real example demonstrating the difference that will be much appreciated.
Thanks a lot for helping VP community members become better investors.
Hi…Hitesh Bhai @hitesh2710 …Thank you for sharing your experiences and educating us…
1)Can you share some parameters which made you to exit market in March?
…Technical + Fundamental both
2)Selling at appropriate time is one of most important thing for profit making.Can you share some important parameters to track for selling decision …
If possible please explain with past example
Thank You…
Hitesh Bhai, What is the maximum allocation you give to a stock in portfolio and what is the minimum you give?. Also do you cap sector allocation?. Would like to see your views and rationale behind it and learn from it.
Hi Hitesh bhai,
Am a completely noob in technical .
1 So was confused as to what’s the relation between the price pattern and good results ?
2 Also have heard a lot of times as to market discounts results and in case of stock like graphite, it started falling many months before the bad results that followed the price decline while the preceding results were actually good still stock price nosedived much earlier than result. What’s the reason that mkt anticipates and correctly finds especially in cyclical stock when full euphoria is on ?
Request you to pls simplify the above
Many thanks
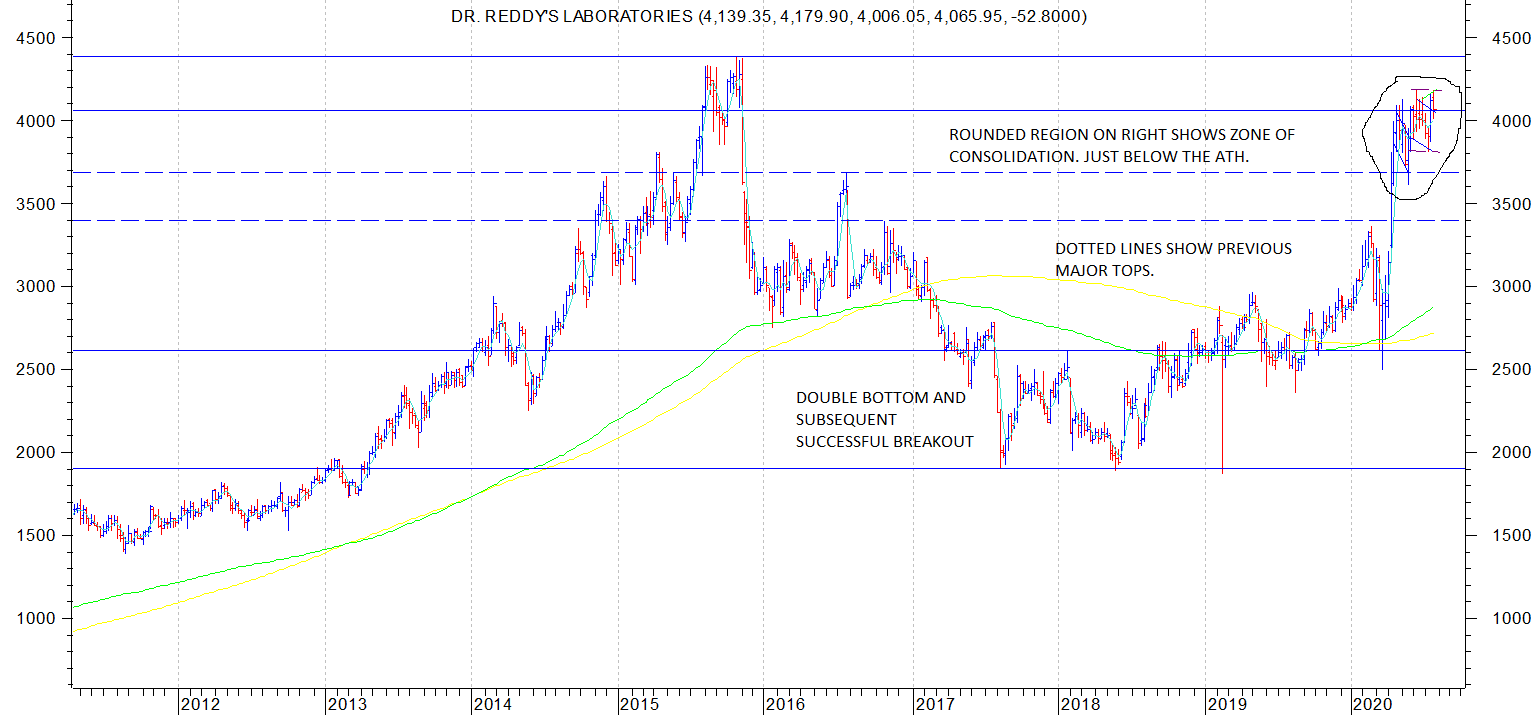
Long term investors usually look at medium to long term charts. The logic is obvious, because they want to remain invested for long periods of time. If you have to look out for stocks which are clearing all time highs, sometimes which are 5 year highs or 10 year highs then these are not going to be visible on daily charts. You need weekly or monthly charts.
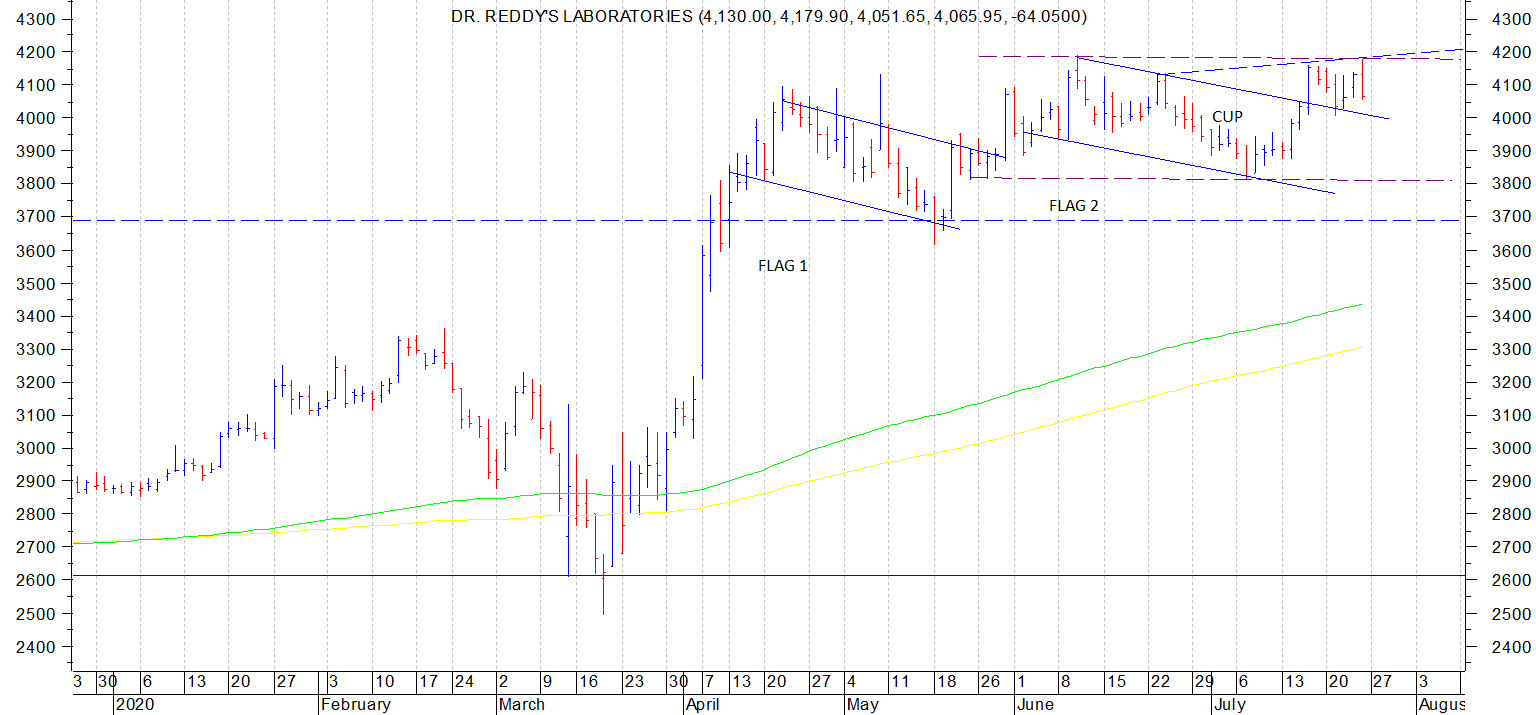
As a further refinement for more precise entry points, daily charts are very helpful. Say a stock which has crossed all time high starts retracing post clearing all time high, (as is usually the case. It is a very rare ocassion when stocks clearing all time highs start blasting away without any stops) the daily charts provide important support levels like 50 day or 100 or 200 day moving avg (or any other moving avg you follow) or some specific retracement level of the last leg of the rally, or some smaller time frame bullish patterns like inverted head and shoulders or cup and handle etc.
If I have to give an example, say you have been given information that there is an elephant with a tusk of gold in the forests. (hypothetical. ) How do you find it? The most obvious answer is that elephants move in herds and so you hire a plane and scan the forest for herds of elephants. And then you land near the herd and try to look for the specific elephant on the ground. That’s how the time frames work in technicals. Longer term charts will give you aerial view of the movements and shorter term views provide specifics.
Coming to specific examples, I am trying to give a live example as a lot of us are interested in dr reddys as an investment candidate.
Weekly chart shows an all time high of 4379. And a lot of heavy consolidation as shown by the region marked in a rounded area on right side of long term chart. And if we go one time frame lower on daily charts, we see a sort of base on top of a base (both flags) type formation. (described by William o Neil) . Couple of other patterns visible are a small cup and handle and a double bottom (rectangular consolidation) formation. All these patterns need a close and sustaining above 4150-4200 to complete the bullish picture brekaout. If you have read the Next Apple book, he clearly mentions to look out for stocks which have cleared all time highs after proper base formation.
You yourself have answered the question. In most cases usually markets know most things in advance and price moves accordingly. So sometimes it surprises me when chart patterns suggest upsides and when I look at fundamentals I cannot make out anythng to suggest the bullishness in charts. News often come later.
But this is not the gospel truth and there are exceptions in markets too as they are to most rules.
In case of a company as widely tracked as dr reddys, I think analyst community have a fair estimate of what to expect. If those are exceeded then prices move higher.
As investors our focus should be to try to find out companies which are likely to provide positive surprises in terms of company’s performance and which the markets may not have factored to the full extent. Or may not have factored at all. That’s where a lot of money is to be made.
About cyclicals and turnarounds, there are a whole host of experts who keep working on things with data points and newsflows and scuttlebutts who know a lot more than the average investor and hence stock prices tend to move ahead of the results. I know quite a few chemical sector experts whose knowledge continues to surprise me. One guy explains me the whole manufacturing process of chemicals concerned and how a company x has a benefit vs a company y. I cannot digest most of it but it often helps me in deciphering what I see on charts.
My question is on Granules India. I have written a lot below to explain my query. But the main questions are – Can we classify Granules as a (1) compounder, and (2) a core portfolio stock? Request your views on this please.
Basically, the query arises because of multiple factors. The stock has almost trebled in past one year. There are continuous positive newsflows, be it surge in API demand, Govt’s thrust in pharma & specialty chemicals, good results, capex announced etc etc. However, most of the company’s revenues come from the most common NSAIDs where complexity / required chemistry skills are minimum and competition is maximum. Still, the company is showing good traction with increasing contribution from PFIs and FDs.
Dear Hitesh Bhai @ hitesh2710.
I am invested in many sectors but entered in Pharma quite late.
I invested in recent past in Ajanta Pharma ( x amount), Divi ( 3 x), Dr Reddy (x)and Abbott ( 3 x) but want to consolidate at max 2 companies to have better focus in future.
I am confused as all are good companies and not able to decide.
Thanks to give your opinion please.
Hi sir,
Aarti drugs have come out with v good results in Q1. The share has been rising for the last few days and infact rose more than 7% on last Friday, a day prior to results . I don’t have much knowledge about pharma. Do you feel there is still some steam left or it’s there in the price? How do you see the future of the company?
Secondly Britannia recently crossed all time high as well as 52 week high. Does it qualify your technical analysis to move ahead in times to come?
Rgds
I wont get into specific advice on individual companies. It is after all one’s own call and if we invest our own money into companies, we have to develop our own conviction so that even if the stock price corrects 20-30% from our buy level for whatever reason, we have the strength to hold the stocks. Its no use my saying how much upside stocks which have broken out from all time highs have left mainly because I myself have no idea.
There is no alternative to doing the work ourselves and getting the hands dirty by listening to concalls, reading annual reports and read learned comments on individual threads on VP. With so many resources at one’s disposal, I think one should try to do some individual effort and try to come to conclusions.
I try to put forward balanced views in companies I am interested in and do not track other companies too closely and hence no comments on companies like granules, aarti drugs, britannia etc.
The max and minimum allocation to any individual company in my portfolio is a function of the risk reward involved and the conviction I have in the company.
The minimum allocation question is easy to answer for me as I usually do not go below 5% allocation. That is the minimum I look out to invest in a company. If I don’t feel like investing 5% or more in a company for whatever reason, I give it a pass.
Maximum is something which varies with the general market trend, and specific sectoral trends or company specific tailwinds. Usually I don’t go above 15-20% allocation. But if the allocation goes up much higher because of run up in stock price, I try to ride even higher allocations. For me portfolio allocations is dynamic process and I dont have a one size fits answer.
Ideal thing to do would be to have one’s own philosophy regarding portfolio allocation so that it suits our own temperament. Many a times I have had 50-60% allocation in a single company and have not lost too much sleep over my position. But I don’t carry these big positions for too long and trim at opportune moments.
My question, again, is not from a particular stock’s pov, but more of an asset allocation strategy-based.
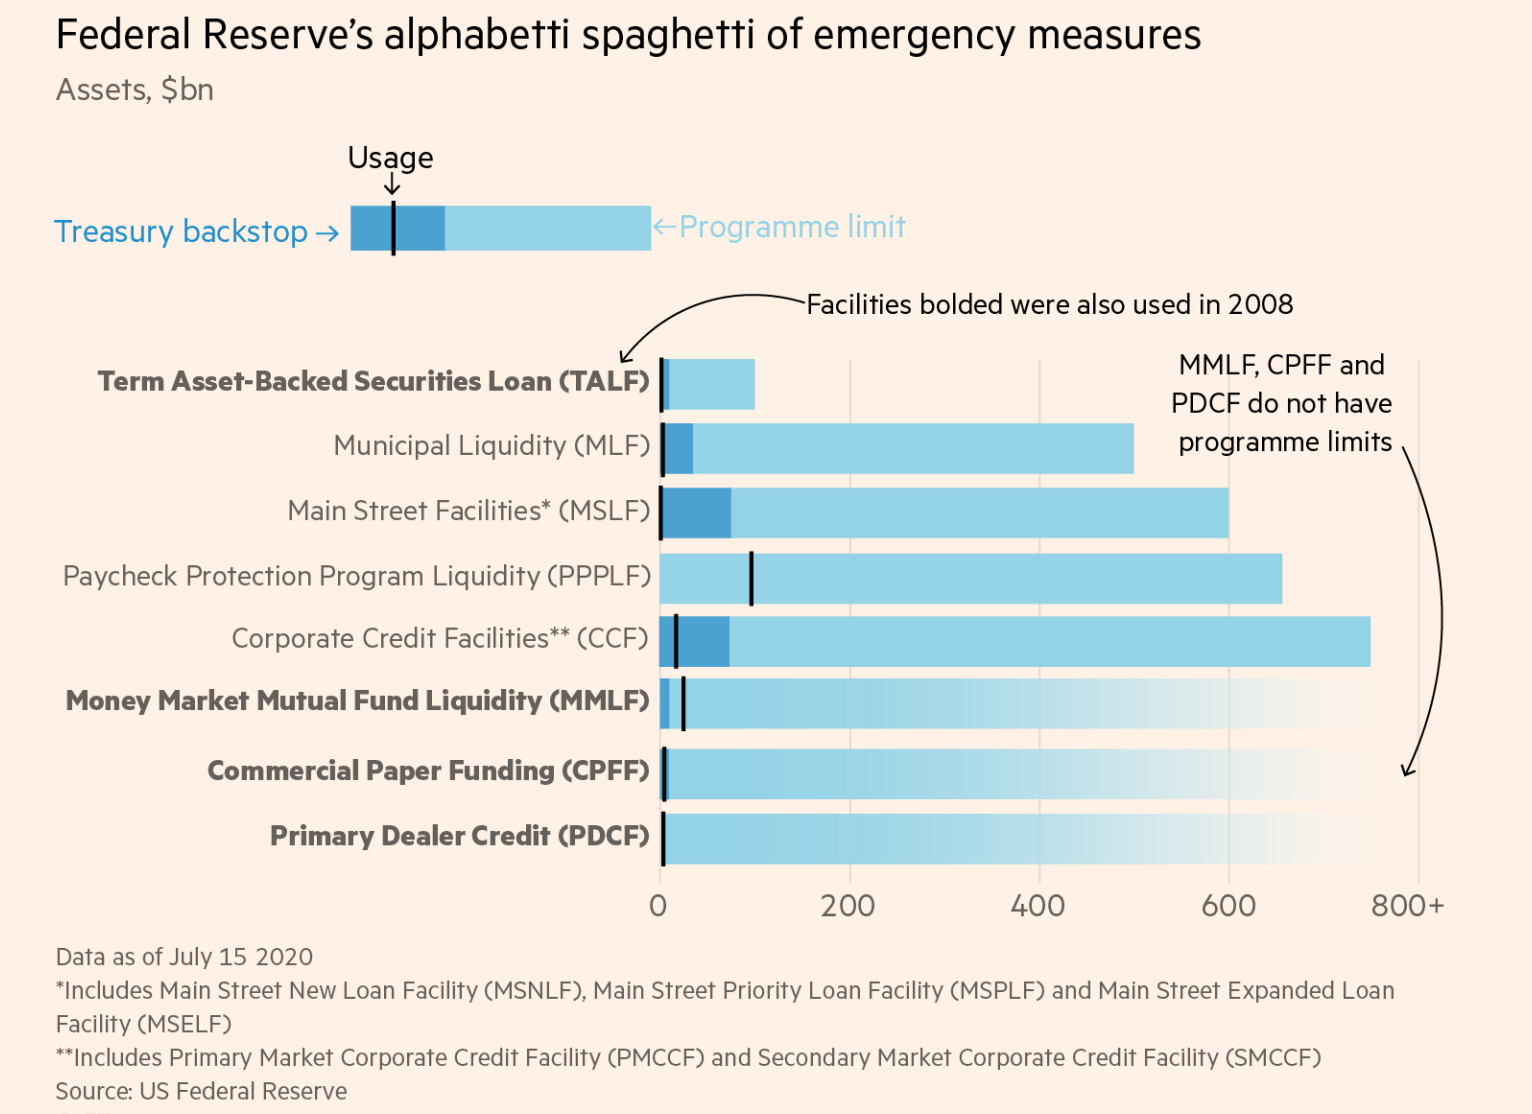
We all saw what the US govt. (and pretty much every other govt) did in March to save the capital markets).
Similar thing was done by Indian govt too last year when they reduced the corporate taxes.
It seems like they are assuring the investors that whatever happens, they won’t let the indexes fall (by saving corporates) at any cost, either by reducing rates or printing more and more money.
From BusinessInsider —>
In recent weeks, the Fed has used both old and new programs to ensure credit flows where it’s needed, signalling to investors that the public health crisis won’t necessarily translate into a financial-market collapse.
Over the last several weeks, the central bank has shown it will go to unprecedented lengths to stimulate the economy and prevent further market disruption. Those signals have, in turn, stabilised stocks and allowed them to retrace a significant chunk of their post-coronavirus loss.
Put simply, the Fed has been indirectly backstopping the stock market by reducing investor worries around how much the coronavirus lockdown will hurt corporate profits and strain outstanding debt.
So, in a way, we’re getting sovereign guarantee about equity markets too.
Doesn’t it make sense, more than ever now, to remain invested constantly in the markets?
@dineshssairam Would love to know your views too, since you are more than 50% in cash.
The Fed has not actually done as much as they said they will. As Prof. Damodaran puts it, the fact that people think the Fed has that much power is what actually gives it that power in the first place.
Being a noob, what I could grasp from the AD Sir’s blog is, just because FED assured about intervention (but didnt intervene as much), the markets rose?
In a simple way, the markets rose not due to FED’s action but on its “promise” to take action?
So FED’s promise just propelled Retail and Institutional investors to bag equities?
But I still don’t why you’re in cash? Why won’t this happen every time when markets start showing bear signals? In the end, don’t you think FED would actually have to put in the money, if nothing works?
Yes, that’s the gist of it. Fed is essentially promoting investors to take risk, which may not end well in my opinion. But I honestly don’t care about Macroeconomics much at all when it comes to investing.
My being in Cash has nothing to do with the Fed Stimulus. I’m not able to understand the impact of this crisis on the businesses I track and own. I either need more clarity or more bargains in order to invest.
Edit: Feel like this is going off topic. Please post in my thread or DM me if you want to continue this. Thanks.
I have seen Elliot waves being used by many investors for getting the bigger picture of the market.
The price patterns like Cup And Handle are capturing the psychology of the people participating in that stock…like ‘U’ area of cup and handle scares out weak holders, A more solid foundation of strong owners ,who are much less apt to sell during the next advance is thereby established. But the Volume in these price patterns are important to capture the psychology.
My question is regarding Elliot waves, what is the underlying psychology? How can you Capture the nature of people (whether it be in one stock or of the whole market ) without any volume confirmation?
How do you capture idea about the direction of the markets in the short/medium/long term with Elliot waves?
The markets and the Economy are showing divergence hence the recent rally may not last, but how can we say the wave C will be deadly…
Future market corrections are a function of future events. what if few good triggers comes and the wave C is not completed like it has to be in Elliot wave?
Also do you feel whether the levels reached by Nifty in march 2020 ,will be seen again?
Thanking you for the loads of patience that you show for clarifying our queries…
Dear Sir,
The question is with regard to buying a stock when it has ran up quite a lot. I was recently researching on Paushak ltd- part of alembic group which is into manufacturing of phosgene derivatives. While I was about to complete the research, for last few trading sessions the stock has free run of more than 60%.
My question is how should be our psycology when such type of things happen? It is really frustrating that we could not purchase eventhough we have made very good efforts towards researching a stock. What should be our strategy for purchasing such type of stocks afterward. Should we still look at such stock at current level for puchases or move on?


 In most cases usually markets know most things in advance and price moves accordingly. So sometimes it surprises me when chart patterns suggest upsides and when I look at fundamentals I cannot make out anythng to suggest the bullishness in charts. News often come later.