Can anyone help me with the old annual reports of Hawkins?
Thanks.
Can anyone help me with the old annual reports of Hawkins?
Thanks.
Only till fy 2010 are available at website. I need older than that as far back as available. At report junction annual reports till fy97 are available but they are paid. I will get it from there unless I get help from some good Samaritan here.
Thanks.
Investor Relations of companies oblige the request for old reports
Thanks. I was able to obtain annual reports going back to FY 1997 from report junction.
Sales jumps 13.26% PAT jumps 13% Dividend hiked to Rs.70 Full Year EPS 86
Some signs of revival, good dividend
Decent set of results from Hawkins. And good dividend too.
While comparing Hawkins and TTK quarterly nos, I found out that in case of Hawkins, March is usually the strongest quarter every year. While for TTK, March has been the weakest quarter every year.
Both are almost same lines of business and still this anomaly is something I cant figure out. One guess I could come up with is that the companies push out inventories at different times in terms of quarters. Not too sure about this though.
Anyone tracking the sector can provide insights into this anomaly?
disc: invested in hawkins. no positions in ttk.
I think in case of Hawkins, entire sale to CSD is booked in March quarter. Making Q4 the strongest.
Hawkins also revises the price at start of new financial year, so dealers tend to stock up resulting in high Q4 and low Q1
Last year they didn’t raise prices as was mentioned in AR, as raw material cost was less, it has always been a 2% yield stock but surprised to c market Luke response on dividend side,
Not sure about why q4 sales of hawkins is better than TTK but last fiscal, Hawkins created 1,500 new dealers, more than twice compared to any of the previous years. It set up and trained 50 Hawkins authorised mega wholesalers across the country. It also opened 118 Hawkins showrooms in 83 towns.
Hawkins has over the years been a very interesting case study in investor psychology and market reactions to various news and recommendations.
As a business it remains a very simple to understand business. And the characteristics of a good business like a long run way, great balance sheet, high dividend payout and high ROCE etc are all there all these years. Whats been missing is consistent growth. One important aspect for any company to command premium valuations is predictable growth which is missing in Hawkins. But since Dec 2015, if one looks at comparable quarters, barring 2-3 quarters there has been slow but steady growth especially in topline. Here its important to look at topline growth because over a long period of time profitability tends to adjust to normalised levels with a few quarters being here and there.
The stock made its all time high in Jan 2015 post discussion about it by BM on TV. This was followed by two weak (in terms of profitability) quarter in June 2015 and Dec 2015. This was promptly followed by drubbing of the stock price down to 2030 levels where it formed a sort of double bottom which got confirmed once stock went about 2730 but there was no follow through buying maybe because investors were so disgusted with the company that no one wanted to have a look at it even though barring Sep 2016 quarter, the results in terms of profits have been largely good.
There was a brief spike to 3600 levels in Oct 2016 on the back of recommendation by a blog by Dhruvesh sanghvi. Post that the stock has been lacklustre in terms of price movement. Now March quarter has probably been the best quarter for the company in terms of sales with sales of 178 crores. This correlates with reacher’s post above mentioning higher focus by co in form of higher dealer network and opening of hawkins showrooms etc. The impact of these measures would be interesting to watch out for in the next few quarters.
I think part of the spiky moves have been because of very low traded volumes because of which there is always a stampede to get in and get out in times of good and bad news.
Coming to current levels, with an EPS of 86 per share, the stock trades at a PE of 35 times its trailing earnings and 2.4% div yield. This is not too cheap but in the context of current market levels and the kind of valuations some stocks are quoting at its neither too expensive. I think TTK is quoting at nearly 1.5 to 2 times the valuations of Hawkins with much lower div yield. So I expect the stock price to remain rangebound unless some big shot comes on TV and talks or recommends about it.
disc: invested and no trades in last 30 days.
For those who wish to read the blog titled “Hawkins the Coca Cola of Cookers” mentioned by Hitesh above here it is
It looks like EBITDA margin was down 160bps if I am right. Gross Margin was up nicely but Employee Costs and Other Expenses were clearly the drivers for this margin decline. Any thoughts on what was behind this? Are they opening more stores owned by themselves, raising gross margin and SG&A expenses at the same time? Thanks in advance.
hitesh sir what could the impact of gst on hawkins, i mean to say dealer stocking and destocking
Disclosure: No holding as of today but used to hold it in past. In order to learn the skill of equity analysis, I took Hawkins as an example due to few number~40 of pages and easy to understand AR. Below notes are taken from various sources such as AR’s, ICRA’s Credit Rating note and the template (attached below with this note–Filled using Data from Screener) for the below analysis.
Hawk.pdf (819.5 KB)
Thanks @hitesh2710 Bhai for the detailed note. Few points that I noted during my study
Pros:
• Comfortable operating profitability.
• Minimal increase in net working capital requirements.
• Low capital expenditure requirements. Capex of ~ 30 Cr. in last 10Yrs.
• Strong brand equity.
• Vast experience of the promoters and management in the industry.
• Healthy financial risk profile: industry leading ROCE, robust cash generation from operations resulting in net debt free status, strong debt protection metrics and strong cash flow generation. Net Profit and Owners Earning are almost same. Net Profit: In 9 Yrs— 307Cr. Owners Earnings: In 9 Yrs— 293 Cr.
• Strong pan India distribution network
• Growth prospects of the pressure cooker and cookware segments on account of favorable demographics, increasing urbanization, rising number of nuclear families, low penetration of pressure cookers and cookware in the rural areas, rising rural incomes and a shift to branded products.
• 56% promoter holding. Ethically, promoters and management, could be assigned a Gold standard Benchmark.
Cons:
• Vulnerable to Aluminum (major Raw material) Prices.
• Intense competition- other leading, regional and unorganized players.
• Liberal dividend policy that has constrained the build-up of net worth: ROCE and ROE would have really helped if net worth would have increased considerably. Considering the fact that Promoter, Family Members and Relatives earned ~ 21 Cr (in FY17). via. Salaries, Dividends, Commissions and Interest on Fixed Deposits, I do not see a possibility of trend reversal.
• Concentration in cooker and cookware segments, limited market size in cooker segment. Pressure cooker sales for Hawkins and Prestige are ~ 1100 Cr (In FY17), which represents almost 50% (???..Not sure) of market share. If so, Opportunity Size looks to be Pretty Narrow as Hawkins Management does not show any signal to diversify in the adjacent product category as done by TTK Prestige.
• Borrows in the form of fixed deposits - to enable flexibility in managing its operations, to meet any cash flow mismatches during the year and provide adequate buffer for contingencies.
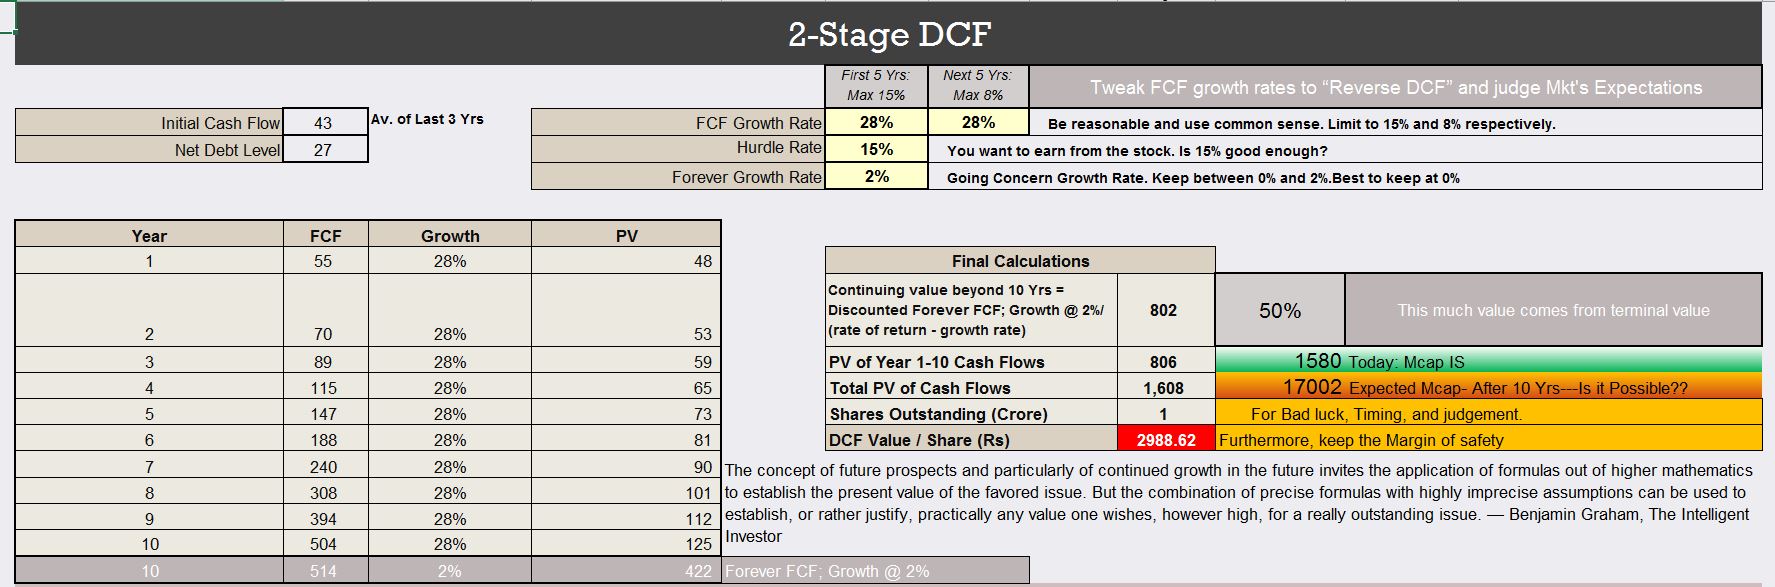
Business generates ~ 40 Cr <average of last 3 yrs> as Owner’s earnings. What would be the Multiple one would like to Pay? As of today, Market is assigning an X factor of 40 i.e 40 times.
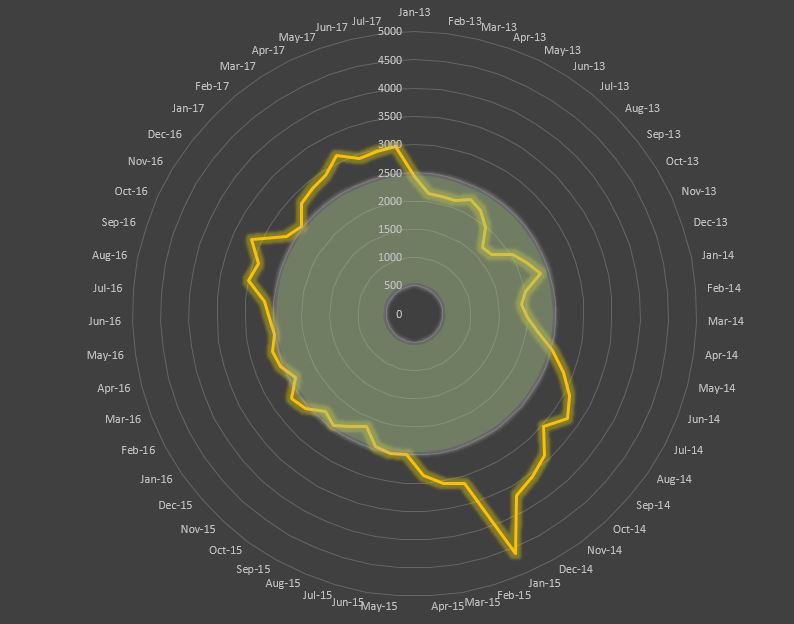
Price action of last 4 years, below image, shows that market loves to Lap it up at 20 times i.e @ the price of ~ 2000:
Hawkins has characteristics of a business that could be valued using DCF to understand the Market’s Current expectations. I did so as a theoretical exercise using the calculator available at:
Earnings: EPS of 86.25 is taken from results of FY-17.
Growth Rate for Earnings: In order to justify the CMP of ~ Rs. 3000, market expects this to be at 25 % for next 10 Years although past history and lack of any new evidence does not support such an expectation. A more realistic number might be 12~14%.
Terminal Growth Rate: Set at 2%, although I was tempted to keep it at a higher level, at least at GDP growth rate but alas I am poor at forecasting, I cannot even forecast what I would be doing after an hour which rules out the possibility of forecasting at such a long horizon. Be informed that, keeping it at 2% is considered as very high as per articles I have read to understand the DCF.
Discount Rate: The expected Rate of Return an individual would like to earn from an equity position. I set it at 15%, which most people would like to be on higher side although I felt that figure as a decent return from a long term position.
Here is the Image:
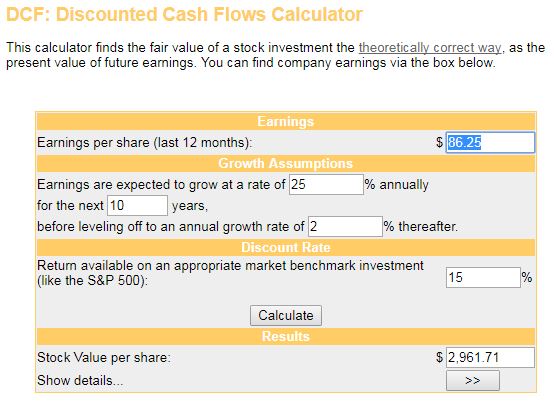
Note: Assume $ as Rupee.
i think there is a dichotomy in prediction of 10 yr growth rate of 25% which is too high- may be 12-14% is optimum and 2% growth for terminal value which is too low- may be 7% assuming volume growth to saturate and considering only inflation rate.