Guru Mantra 16- Competitive Advantage: Racing for Uniqueness (The Second Part)

MEN who are WORKING- QUALITY OF MANAGEMENT (II)

Bernard Baruch- A legend who dreamt freedom for human

Walkover investment legends Warren Buffett, George Soros or even giant speculators like Arthur Cutten, Jesse Livermore; Bernard Mannes Baruch was undoubtedly the most influential investor of all time. There is seldom any debate on this question as no one influenced five American presidents, two world wars. All major political leader of the era has once travelled in the back seat of Baruch’s Rolls Royce. Such was influence of Bernard Baruch he was awarded Army Distinguished service medal by the President then. Baruch was investor, speculator who turn to political advisory before world war which perhaps saved him from wrath of 1929 crash. Otherwise known for grand philanthropy donated 63 kilometres of land among many other things. Please do read about Bernard Baruch in case you haven’t; these kind of personality comes once in a hundreds of years.

He has wrote several books, you can find them all in Amazon. Here is link to his biography

http://www.amazon.in/Baruch-My-Own-Story-Bernard/dp/1607969130

Few very important quotes of I came across during classroom session ongoing! It may be relevant for the threads like this:

“I keep an important fact in mind that I am very unusual. You call it my biological upbringing , I like to repel my cognitive biases and that’s the basic DNA behind my career of investment.”

“I knew investment was right decision for me as I was always an individualist, never afraid to disagree with authority.”

“I want to define myself at deathbed whether I made a difference , whether I lived fully and well.”

“People don’t follow their dreams due to single fact they are afraid of falling in their endeavours. They like to follow predetermined path as they know they can achieve rather than one of their own making where they will be tested.”

“If we don’t take a certain step we don’t believe we will succeed, we have placed a barrier in front of that success that is far stronger than reality. If we try we may fail but we may succeed. If we never try at all, we make it impossible to succeed.”

“I learned more from mistakes than accomplishments, this could never have been possible without risking failure.”

“Don’t worry about how much time you have spent on a career you don’t like or how much you have invested in relationship that you know will not work. “

“It is easier to make a lot of money if you don’t really want it badly. Being wealthy doesn’t make you happy. I know. I have tried it several times. I went bust many times, it didn’t affect my life as I was sleeping in same house on same bed before and after wealth”.

These are quotes from Curtis Faith, Bernard Baruch and so on. No CAGR, no cash reserve or yield anywhere. Food for thought?

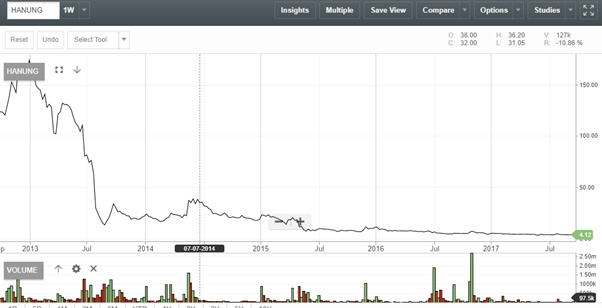
Fair, lets grind back to topic of management. Last time we said management must take decisions on five things:

  1. Operational efficiency
  2. Above the line decisions as business restructuring
  3. Accounts, finance and control
  4. Capital allocation
  5. Trading off rewards and risks

Great, how do we know all this? No matter what ever we do, we may not get all information. The idea is to draw a reasonable conclusion.

This is what I am trying to do:

  1. You get what you see- available crisp and clear information
  2. Reading between the lines- moving from literal interpretation to objective interpretation
  3. The triangulation technique- using different methods for checking same subject

You can only perform any of 3 activities above if something somewhere to start with, isn’t it?

  1. Management communication- financials, management discussions/presentation and all other communications to stock exchange.
  2. Analyst review and analytics- all sort of wise analyst publishing different reports on buy, sell call or even commentaries on management. Idea is to screen them not believe them.

Here is a little known secret, the second best information prepared and analysed is not available to us. These are income tax authorities, second is financiers if they are involved. Nevertheless we can do only what ever is available to us:

How to establish a relationship tools against available infrastructure, bellow is a table I use:

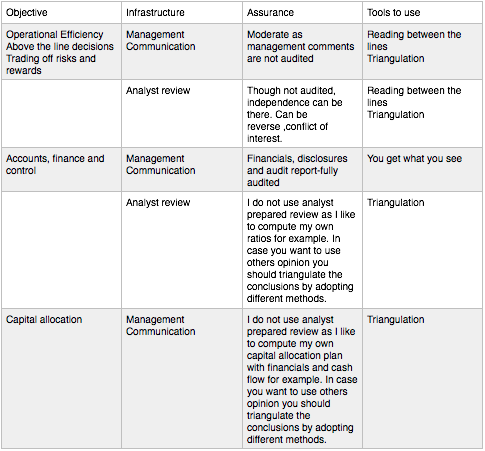
Rather than going a complete analysis which will take time let me pull out some specific workings and its basis here:

A. Operational efficiency

Management operational efficiency begin with published numbers, what are the ratios help you is :

Around profitability- consistent tax rate, net margin, asset turnover, ROA, financial leverage, ROE/ROIC, interest coverage
Growth- sales, operating profit, net income and EPS
Cash flow- operating cash flow growth, free cash flow growth, capex/sales, FCF/Sales, FCF/Net income
Financial health- current ratio, quick ratio, financial leverage, debt/equity
Efficiency- Cash conversion cycle with break up, fixed asset turnover, asset turnover

All these ratios are well known with detailed commentaries. The trick is level basing and interpretation.

For example take a case of level basing:

When I calculate Return on Assets I use Net Operating Profits After tax. Two major reasons it removes all below the line effects and neutralise tax rates. Second my cost of capital for valuation calculation is basis NOPAT, every margin above cost of capital is a economic profit for me.

Now interpretation:

This can be complex and easy depending on methods you are using. Say over years my assets have gone up by 45% of which 80% of increase is supported by tangible asset. This is good and bad both. Liquidation and balance sheet valuation goes up where idle asset may hit your ROA/ROE. Hence use PL and Balance sheet ratio combined for an interpretation.

B. Above the line decisions

This is a specialised area for assessment. If you are beginner my suggestion is avoid. We may need separate thread for this. You can read this book meanwhile:

http://www.amazon.in/You-Can-Stock-Market-Genius/dp/0684840073

C. Accounts, finance and controls

This is the most assured area as large amount of transactions are audited. The task is here to tie management discussion, financial statements and disclosures etc. For example:

In Management discussion and analysis:

Management says we feel receivables are good and recoverable. And we have not provided any provisions accordingly.

In notes to account auditor says:

An amount of XXX receivables is more than 2 year old, in management’s opinion these are recoverable and accordingly no provisions have been made.

Come next year management has written off all old debts at one go. Here it become a battle of intent- was it purely business decision or manipulation of balance sheet?

Investment stated at cost than M2M….can be double edge sword.

D**. Capital allocation**

Use five year cash flow statement and spot following:

  • growth and maintenance capex
  • dividends paid
  • buybacks
  • acquisitions
  • borrowing repayment
  • investments made

Idea is to compute A. Gross Capital distribution-all adjustments stated above B. Gross surplus/deficit- cash flow from operations minus gross capital distribution C. Non operations funds managed i.e. borrowings or capital taken to manage deficit or pay off surplus via dividend/interest. D. Net surplus/deficit- Gross deficit/surplus minus non operations fund ; if management is managing capital efficiently net surplus should be minimal which is nothing cash balance held for working capital max.

E. Trading risks and rewards

Spot changes in management compensation to two variables, one is performance i.e. ROE, second trade off decisions.

For example by taking a decision of leasing an asset on lease instead of buying management has been able to reduce capital expenditure funding. The return on invested capital is superior to cost of capital which resulted higher ROE/earnings. It deserves a case for compensation rise.

Few other questions from the book “The Investment Checklist”

http://www.amazon.in/Investment-Checklist-Art-Depth-Research/dp/0470891858

  1. Whether management is owner operator or hired hand? This is a good point but most of good small cap are owned significantly by promoters in India due to unfavourable valuation and reluctant financiers.
  2. History of manager to rise - if he has spent lot of time from floor to board room considered as an asset. Bit dicey to me, likes of Bansals or Zuckerbergs will vanish then.
  3. Compensation to ownership- preferably one should own more shares than taking big salary. This is again debatable, it depends on governance structure. Vishal Sikka leads Infosys well, but don’t expect him to own 15% of Infosys…he just can not afford to. Mukesh Bhai reducing his salary every year, does it really matter?
  4. Management buying and selling- valid point, if management is selling what is the point of buying. Except the intent, if Mukesh Bhai sell 200 shares it may be some technical requirement, how does it become relevant to his burgeoning billion dollar wealth.
  5. Involved in day to day operations- agree, that’s why I call them Men at work.
  6. Earnings guidance- if company is issuing guidance management may be under pressure to achieve target and in process takes decision which are not good for long term health. In India few issues earning guidance , small cap almost zero.
  7. Decentralised business- agreed, but struggling for long time…how? And what is the impact on competitive advantage?
  8. Valuing employees- no comments!
  9. Capital allocation- agreed
  10. Buy back- agreed, part of capital allocation decision
  11. Passion- love business not money; great but how do I know?
  12. Moment of integrity- lots of good guys never publish goodies what they do. If you know fine.
  13. Management communication consistent- agreed, we spoke in detail

Lastly few years back one of my seasoned investor friend was gung ho about a owner promoter who was chatting with normal shareholders at break during AGM. I immediately drawn his attention to iconic William Durant who was known for all these chit chats, ultimately he went bankrupt along with feel good investors! Not trying to say every story echoes in same way.

The point I am trying to make is 98% efforts should be applied for reading between the lines, triangulation than AGM chit chats, news paper philanthropy. For that I guess we need to be least bothered if my CEO use chartered flight as long as he is delivering stellar returns and profits for us. Not all of us like same lifestyle, frugality is a feel good factor, but can it be forced decision???

Good wishes

1 Like

Few good books focussing on specific aspects of management in my eye would
be :

http://www.amazon.in/Investing-Between-Lines-Decisions-Communications/dp/
0071714073


pd_rhf_dp_s_cp_5?encoding=UTF8&pd_rd_i=1422162672&pd_rd
r=189RVCZB5PSKMVEC0JE6&pd_rd_w=2xu7k&pd_rd_wg=IL3FO&psc=1&
refRID=189RVCZB5PSKMVEC0JE6

Apart from this most of vanilla investment books would have a section on
management aspect.

Financial Analytics- peeping behind the numbers

Now assume the company is enjoying a competitive advantage or comes with new landscape such as Blue Ocean with a more than decent management who is driving the company. Question I always encountered how do I know numbers are stacking up, can I see them in financials? Financial analytics is also used for screening of stocks but that’s not something we are focussing today.

Financial analytics means we are trying to use the accounting numbers that is recorded and information that is available. The most popular financial analysis of course is common size balance sheet/PL, ratio analysis.

Answer is you can but before that few important category I use and before I get into financials:

Category 1 :A company with existing competition who has a customised or tailored value chain (please see various discussions above to know what is tailored value chain, a fit etc) the above normal earnings and equity value should have been start kicking.

Category 2: If a company is in process of tailoring the value chain, numbers may not reflect but there exist better ways of gauging the advantages to come. Many people call it as “emerging advantage”.

Category 3: Now a Blue Ocean type of company (more like a growth and new value proposition) where numbers may not tell you everything.

Category 4: Last category is a company who was enjoying competitive advantage and messed it up in middle (for whatever reasons like bad management) and now on a come back trail.

Second aspect is the objective of financial analytics:

  1. To see and feel numbers including balance sheet, earnings and cash justifying your hard work on business understanding and analysis of competitive advantage or a Blue Ocean.
  2. This one is dicey, to compare my company with similar companies where information is available (either listed or not). In realty no two companies are similar head to toe, very important to know the differences then.
  3. Next one compare my numbers with a industry metrics and benchmark.

Now the challenges and opportunities:

  1. Any standardised portal like Morning Star, Economic Times, Screener, Money control have ratios, and KPI calculated ready made.
  2. These tools compute based on standard programming, so if you want variables to be customised may not be possible. Except in Screener where you can create your own ratios using variables.
  3. Ratios themselves have no standard framework like GAAP (Generally Accepted Accounting Procedures). It is up to the user of these KPI to interpret for their own need. So ROA for IT company and ROA for infrastructure company are not comparable.
  4. The ratios are calculated using audited financial numbers, so accuracy and validity of numbers can be trusted to a large extent unlike when you pull consultant published industry metrics who doesn’t take any accountability.
  5. KPI’s are evolving with industry progress e.g. EBIDTA was not used few decades, even EVA etc. Expect the ground line to move again.

Let’s come to action, the financial analytics centres around :

  1. The profitability
  2. The growth
  3. Cash flow
  4. Financial health
  5. Efficiency

The Profitability

How much company is profitable? Is higher profit also means higher margins? Has the tax rate levelled? Has the profit resulted return to shareholders?

Although we would like to have 3 margins (namely Gross, Operating and Net margins) our financial doesn’t provide all of them ready made.

Our ground lines in financials looks like this:

  1. Profit before taxes
  2. Profit after taxes

Yes that’s it (not confusing with extra ordinary items). So only Net Margin can be calculated straight forward from published numbers (profit after tax divided by Revenue)

How do we know Gross margin and operating margin? And in first place why it is important to know?

When we take out cost of goods sold or services from revenue from operations we get gross profit. Gross profit divided by revenue gives us the gross margin. Cost of goods sold indicates the direct cost required to produce the goods or services. And this is not easy for any retail shareholder to calculate, this is why:

Not all costs can be easily identified as direct cost. Discretions are used including apportionment of costs between direct and indirect. Example a plant financial controller is considered as direct cost, well he does a lot of thing for head office as well.In service industry it’s more complex, everyone and anyone can theoretically prove they are directly attributable to producing cost of services.Google it, you will get plenty of examples further. In real life situation company maintains MIS which breaks down the goods and services into multiple variables like product costing, SBU accounting etc. Company is not obliged to disclose these informations.

Theoretically higher the gross margin company has better reserves to manage other costs and obligations. If a gross margin is falling you can increase either price or cut down cost.

Next operating margin, this is to gauge operational performance. Operational performance depends on nature of operational expenses which is required for operations. Now you can say are the direct costs above in gross margin not operational cost? No, these are costs which are not directly attributable to production e.g. Research, Sales & Marketing , Administration over heads etc. Operating margin how much we are making before financial and regulatory charges hits us i.e. from operations. If your gross margin is higher and operating margin is lower you need to manage operating expenses properly. This is a pure cost management, price increase is part of gross margin maintenance.

Do we get numbers ready made? No, Research is reported separately in directors report. Sales and marketing may include multiple cluster accounting heads. Further let us understand one more thing:

The capital expenditure is not charged to financials same year because the benefits from assets are expected more than financial period. So only we consider operating expenditures for both gross margin and net margin calculation. Operating expenses include depreciation which is an amount kept aside every year against wear and tear of asset. You can say maintenance capital expenditure. What about purchasing assets for business growth? We call the as Growth Capital expenditure, this is not part of margin calculation, of course depreciation chargeable would have been included in expenses.

Lastly net margin , this is what left out after paying everyone. This is owner’s money which can be utilised for paying dividends, retain for further growth etc. The net profit after tax is a resultant number, so we do not have classification issue like operating and gross margin. However Net profit margin tells confusing story always, when interest comes down net margin goes up. It’s not necessarily good for company, a leveraged company (who has taken loan) utilise the advantageous cost of capital for shareholder return. If loan is reducing and interest costs coming down possibly growth avenues are stagnant. Take another example, a favourable tax rate due to Govt’s incentivisation may be temporary which can inflate net margin.

How do we use these margins for analysis?

  1. Year to year comparison to say are we improving?
  2. Second comparing with similar company to see whether are we delivering superior margins?
  3. Third if industry has a benchmark like say 20% operating margin where are we?

Suppose we get a positive answer for all three above. What happens? Multiple answers can be there, keep 2 key things which can be used in valuation:

  1. Assets are superior which are delivering stellar results.
  2. Management has been excellent to manage cost and price

If by using asset at a cost of capital 10% I am able to generate 40% operating margin and 20% net margin consistently this is nothing but called as competitive advantage of company.

Note: Tax rate- if tax rates are lower for some reason then normalise profit to that extent.

Lets think how we can use the margins for category of companies:

Category 1: Numbers should be healthy while comparing to peers or benchmark. Even internally improving YOY.

Category 2: this type of companies spend big bucks for creating resources. They may not deliver good net margin due to high leverage, sales may not have kicked off. Comparison with peers is of little use as every emerging company would be at different stages.

Category 3: Blue ocean type of companies, they don’t care about what competition does as they are on their own territory. No point in comparing with others. Even if you are going to compare internally you need to be careful vis-a-vis their value innovation, the activities are always on move

Category 4: come back companies will throw up divergence. Meaning operating margin goes up due to freshness of assets where as net takes a hit as loans are still getting repaid.

Every margin improvement should result superior return for shareholder otherwise its meaning less, how do we measure?

Return on equity- this is the return for equity shareholders, in other words earnings divided by equity. Return can be attributed to superior margins, efficient utilisation of assets and cost of capital required to fund assets and resources.

Margin combined with asset utilisation is nothing but return on assets. This tells us how much we are squeezing asset to get earnings out of them. Now few of the between the lines here:

  • A superior ROA with a lower depreciation can be dangerous as capital assets are not replaced in time.
  • Similarly high ROA with lower tax rates which can be temporary.
  • ROA for service industry can be subdued as intangible assets are floor to accounting book keeping. They are more supervisory and discretionary.

The second fire power comes from funding the asset or financial leverage. Cost of capital varies a lot depending nature of funding. For example shareholder’s fund doesn’t have a fixed cost, so if my balance sheet is 90% equity and 10% debt this can add superior returns. Also I am making 15% net margin on my product and cost of funding (loan) is only 10%. Every 5% minus taxes goes to owner.

Return on equity can be managed by delivering excellent operational management (ROA) or financial management (Financial Leverage).

Now few between the lines:

  1. Considering lower cost of capital for equity capital is some time questionable. Everyone invests with an aim for capital appreciation and dividend. Ignoring capital appreciation completely can be error prone and not close to ground realty.
  2. Loans incentivise (subsidised) will enjoy leverage temporarily.

Now put your category companies for own understanding.

Finally Return on Invested Capital (ROIC)- this was a magic ratio when Prof Porter highlighted ROIC is the best ratio to measure competitive advantage of company.

Its basically a measurement of return to those who provided capital, doesn’t matter equity, debt, bonds etc. As only operating profits neutralised with taxes is used it reflects the return that has come from operations than below the line items. Companies within a superior industry enjoy high ROIC. For companies with high capital base this is an effective indicator, in other way if ROIC is more than Cost of capital every pie goes to shareholder.

Will ROIC work for Blue Ocean company, yes it will but to the extent for internal comparison only!

Next lets focus on growth and cash flow.

Few suggested readings:

Five Successful Rules of Investing by Pat Dorsey

Financial Statement Analysis by Fernando Alvarez

10 Likes

Lovely! Rarely have I come across something as lucid as this. Thanks a lot Suvi and others who made it happen!

Suvi, How did you arrive at 73%,Why you are discounting 22.99 why not with 59.63.Sorry if i sound stupid.

Suvi, i could not understand any special situation and understated situation could you please make me understanding.

Sorry friend
Not been here for a while. Apologies for the delay; let me reply your questions if I can:

Special situations are those cases which are not reported through published number. Say company has bought a land in 1978 in Bandra for 5 cr. The land is stated at cost in balance sheet, unless the management revalues the asset the price you will see in balance sheet is only 5 cr. And revaluation is a management discretionary activity. In real terms the stated land in 2017 may be well over 200 cr’; one has to dig underlying information to know the exact business realty.

In this case when a company hold shares of associate company which are stated at cost say 10 rs per share. But the business would have grown multi fold and 10 rs may not be the right price, perhaps way beyond that.

Example: see GMDC holding in Gujarat State Petronet at cost value or the land in Ahmedabad at cost.

Please let me know if you need further clarification.

3 Likes

As this is a old post, I don’t have numbers at finger tip now. I will explain the rationale with same example and let me check old laptop; it may have the calculation file. I will come back to you either tonight or next week end.
Thanks

1 Like

Super threas i think i will get addicted to this …:apple:

1 Like

Financial Analytics- Efficiency; measuring outputs against input

It’s a performance indicator involves human and machine alike. A relationship of output against inputs. This also indicates drop outs or waste in the process. The genesis of efficiency comes from economic efficiency which is a state where resource is rationally allocated so that maximum benefit can be derived. The economic efficiency exhibits management standard on capital allocation including cost of funding, production efficiency with technology attached thereof and more importantly directing efficiency where it’s required.

Summary will be efficiency is a measurement of effectiveness to identify man and machine required to produce competitive goods and services.

Financially efficiency focus on key operational numbers i.e. sales, inventory and vendors. Also, fixed asset as engine of growth. So, we come straight to the ratios now:

  1. Receivables turnover and days sales outstanding
  2. Inventory turnover and days inventory
  3. Payables period
  4. Fixed Asset and total asset turnover
  5. Cash conversion cycle

Receivables turnover and days sales outstanding

Credit management of customers, how often you will give them credit? What would be period of credit? How does credit cost factor in pricing? What is the amount of credit you should allow?
So, we divide credit sales (sale made on credit) by accounts receivable (average of opening plus closing by two is more acceptable as it smooths out period) to get receivables turnover. Days sales outstanding is how many days company sales are outstanding or yet to be collected?

What does it tell us then? This is what I look for:

a. If the gross margin is say 2% and credit period is 90 days I have an issue with management lending below risk free return. But selective customers at 90 days something require a different eye.
b. If days sales outstanding goes down year after year it would mean management is collecting money faster.
c. If days sales outstanding are smaller than competitors it may tell a story that customer is ready pay quicker to my company and this may be due to superior product quality.

What it doesn’t tell us?

a. At end of day accounting is a number, if I clean up bad debts from receivables the base would come down and ratio will improve. But writing off bad debts regularly is scary.
b. The numbers are for a day i.e. balance sheet date. It can vary dramatically within period.
c. Related party transactions can distort any ratio, you use faster credit period for related parties. It averages out slowness of other customers.

Nevertheless, how does it will look for five company categories:

Cat 1: this would be mostly same for all ratios. Internally improving ratio YOY and with peers.
Cat 2: selective credit management are likely, I recalculate ratios after removing related party transactions if any and all other extended known credit period transactions.
Cat 3: every Blue Ocean company activities are linked to value innovation. Ratios are meaningless for this category.
Cat 4: Check write offs and clean ups. If credit is extended margin may be have been expanded, check for divergence.

For categories of company and Blue Ocean please see posts above.

Inventory turnover and days inventory outstanding

Calculations are same like receivables turnover, of course we use the inventory number as denominator and cost of goods sold ad numerator.

What does it tell us then? This is what I look for:

a. Purchase and sales are directly linked here. If you make high purchase you have to sell it equally high or else inventory turnover just deteriorate.
b. For lower inventory turnover, I check associated costs though it would be difficult for a retail shareholder to know carrying and storage cost. Yet look out for abnormal number if disclosed.
c. Margin analysis is one major key driver behind all efficiency ratios. Either I have high inventory turnover and low margin or low inventory turnover and high margin.
d. Purchase price symmetry with inventory levels. Low inventory turnover ratio where inventory prices are increasing is good where as decreasing inventory prices can be painful. This is a regular problem for commodity and cyclical companies where prices are decided on a market place which includes an element of speculation.

What it doesn’t tell us?

a. Just in time inventory concept or low inventory levels are good as long as we don’t know the opportunity costs of sales foregone. Losing revenue and customer without inventory can jeopardise the future of company.
b. Remove obsolete inventory and your ratio looks healthy. Once again obsolete inventory on a regular basis demonstrate inefficiency.
c. We have same average period problem, it’s a number on reporting date.

Categories stacking up

Cat 1: same as receivables turnover.
Cat 2: there could be high level of inventory, one way is to see consistency. If story is same over 10 years period you may have an issue.
Cat 3: same as receivables turnover except focussed Blue Oceans may have huge inventory build-up for cracking an idea out of the box.
Cat 4: same as receivables turnover.

Payables period and days purchase outstanding

Calculations are same like inventory turnover, instead of inventory use purchase numbers,

What does it tell us then? This is what I look for:

a. In conjunction with inventory turnover and receivables turnover- if my customer doesn’t pay and I can’t sale the goods faster I would delay payment to vendors. :blush:
b. Vendor payment period is higher than customer credit period if available.
c. Link with amount of purchases you made, delayed payment period may come with high prices charged by vendor.

What it doesn’t tell us?

a. Statutory charges and insurance like stuffs would have gone through vendor management system and faster the payment cycle. But in reality, you don’t have choice there, can you delay tax payment?
b. Payments withheld due to large defective products purchased.
c. Cash purchases outside the vendor master and charged off as below the line item. Meaning not debited to cost of goods sold.

Categories stacking up

Cat 1: same as receivables turnover.
Cat 2: same as inventory turnover.
Cat 3: same as inventory turnover, some vendors may be funded by Blue Ocean companies. These varieties worked on strategic partnership model to build a concept or innovation.
Cat 4: same as receivables turnover.

Cash conversion cycle-CCC

Days inventory outstanding PLUS Days sales outstanding MINUS days purchase outstanding
Summation of payables, receivables and inventory. How effectively management is using one account against other. Example if I collect late then I can pay late and improve my liquidity. Or if I have sales return I send them back to vendor if I can.

Few points:

  1. If a company does not deal with inventory it becomes a comparison of purchase and sales. But issue happens say like IT companies where purchase is not significant cost rather its human cost.
  2. CCC period against gross margin should be healthy. More sensitive if you have cash credit or loan against working capital.
  3. Improved CCC on vendor strength could be temporary, consistency is important to demonstrate.
    CCC you can define also as TIME FOR INFLOWS MINUS TIME TO OUTFLOWS
    Note- you can read details further on internet. Not trying to repeat academic stuffs a lot here other than bare necessity.

Fixed and Total Asset Turnover

Net sales to fixed asset for Fixed asset turnover where as net sales to total asset for total asset turnover. A gauge to understand how efficiently assets are used to make money.

Points to note:

  1. Do not use in industries like IT or financial services. They won’t have much tangible asset.
  2. Do keep an eye on sale of fixed asset, unproductive asset sales are good but not forced selling of productive assets.
  3. Financing of fixed asset has a lot to do, if I have soft financing I can go slow in targeting a higher turnover ratio to accommodate customer demand and margin.
  4. Depreciation itself is a confusing interpretation, Income tax and companies act themselves do not agree.
  5. Total asset turnover includes entire asset side of balance sheet which can include purchased goodwill which is meaningless sunk cost at times.

I would stop here, you let me know if you have questions. A number of boarders can address.

Happy investing guys!

7 Likes

The Valuation- valuing my possession in agreement to crowd

After years of grinding through first thing I want to tell you is a stock can never be valued in a single parameter. Research is different from execution, business valuations are not determined on stock exchange, different people use different methods, many people don’t use any methods. The list of permutations and combinations are endless.
You might have a stock with strong tangible asset but languishing in market. How do we know, because we compare with peers? The truth no two companies are comparable head to toe. Second, we take lots of assumption and presumptions for valuing tangible asset which others do not believe or use different assumptions and presumptions. Third market is a discounting place meaning estimating the future prospects not current.

The CMP- Current Market Price is determined in the market place or a stock exchange through a mechanism of free demand and supply. And all market participants do not follow or think same way while looking at current market price. We may say buying a share is buying a piece of business, many others do not believe in our saying. We can call them speculators, traders etc; fact remains lot of them are serious smart player & highly disciplined with time tested propriety methods and have outperformed many for centuries. No one is right or wrong here, different strategies to adapt your own beliefs. In short if you have a margin of safety as per your calculation it may not be rewarded by market for decades. Leave ego and adjust yourself, don’t ignore symmetry of time with capital appreciation.

Use valuation method with a pinch of a salt

Again, very important to understand business valuation as speculation interest cannot drive a stock price for long time. Speculators play on money management which forces them to look at time angle far more seriously. If we need the stock price to outperform for a long time the footprint of fundamental investors is imperative. And a good number fundamental investor use a method to spot business valuation for company.

Me and my group do not over emphasize any valuation for taking a decision of purchase and sale. Stock exchange or market place is the most unpredictable place sort of thing and if it’s constituents wildly swinging no point in fighting against them till the dusk settle down. First lesson for all of us is DIFFERENTIATE EXECUTION FROM RESEARCH. This means you are excited with your favourite stock with a margin of safety 50%, I don’t jump and buy unless market environment and stock environment is conducive. What is a conducive environment I will put my thoughts in my other thread ‘The Art of Speculation’. Second if the market does not agree for a long period I do not fight and step back till the time market agrees with me. I do not buy and wait market to respect me, rather I respect market and my intelligence both when converge together. My problem market disagreement can cost me a lot of capital and unfortunately my money management is centred around the capital gains I received in past along with savings from salary and rental income. I do not use OTHER’S MONEY. Fourth some of us in my group worked in institutions including me, an investment decision is not an excel model and click a button. It’s much more beyond that, there is a team for thematic and macro analysis, discussions with management and layers of debate. In simple term as an individual I cannot replicate all the activities carried out by an institution with respect to a buying decision, so cutting out a piece may not fit at all. Fifth and last, I am here to make money. If market does not agree with me I will go back and improve my timing if I can (which is possible) or amend any other thing that is required than fighting with market valuation. This is my realisation and group’s that we cannot predict but YES WE CAN TIME.

Valuations are either based on underlying business of company or expectations of crowd. Crowd behaviour let us talk in other thread, we will stick here to business valuation. There are two types of valuation styles, one is intrinsic and second is relative. Intrinsic value is a perception value of business, where as relative valuation the use the price of business to market price.

Relative Valuation- PE, PBV, PCF etc

Price to Earning, Price to Book Value, Price to Cash Flow

The most popular among them is price to earnings ratio, rightly so as shareholders are all interested about earnings only. I personally have an opinion, EPS is one of most effective KPI a company produce but problem is with ratio; yes, it’s function of two not one. You have a numerator and a denominator. Second usage of the ratio, put a context and you get a unique answer for yourself. I do not use PE ratio as over valuation or under valuation. Neither I compare PE of one company with industry group or peers. Why? Fundamentals follow crowd behaviour, yes you heard it right. The price takes a sharp downtrend for no reason and you will find result bombed in next quarter. Or results are brilliant yet stock tank by 15%. I do not call them as Mr market as irrational but try to understand what Mr Market is trying to tell me in first place? Is the decline phase underway which is known to others but not known to me? Have the expectations been too high and now it’s time to work within normal trajectory? And this has helped me in last few years to sell a stock ‘INTO THE STRENGTH’. A lot of this what I have observed will write in the other thread in short PE ratio I use as PRICE EXPECTATION RATIO. PE ratio reflects a sentimental value of crowd expectations. Meaning if PE ratio is 60/70 or more I see it as crowd thinks this as a Mercedes not Maruti. Whether their expectations are wrong or right is another debate.

Have you ever realised why a historical PE ratio is not available on internet easily? It’s uses are more centred around coffee table conversation, it undermines the future earnings as it takes historical earnings as disadvantage to start with.

Nothing called cheap or expensive in stock market- if a stock has a low price it’s considered cheap by many. The beauty is definition of cheap, it’s low in price to similar items or services. What if other items are services are also hammered. It’s like the whole class failed in examination and I have secured highest among them. Here it’s actually we choose the low PE and land up choosing the lowest mark student among all fail students! Stock market is a buying and selling price. Constructive price behaviour is decided by buyer and seller based not market. Market does not value anything, it’s just a mechanism of economical demand and supply. It’s the buyer and seller put a price tag and they all differ dramatically to each other. Wisdom suggests not to go against crowd, you may not think like crowd. Mark Minervini says value does not move stock prices but people do by placing buy orders. Value is one part of the equation, ultimately you need demand.

Let us use Avanti Feeds as an example:

The five-year chart of Avanti Feeds below (unit-weekly)

Remarks: rule book company, PE expansion happened with fundamentals growth. The speed catches up as acceleration catch up, see the amount of incremental EPS from 2014 onwards. Why not an 80/100 PE company then? The long run expectation of crowd is below 20% despite gigantic growth of company. Crowd is wrong, or right? We do not fight, but let’s not fight with crowd. PE has expanded five times, it may further. Think of what you should do not what you want to do.
Can you buy on low PE and sell on high PE this stock?

Peer comparison- if you take Morningstar classification this is a still low PE stock. If you take Money control it’s one of high PE stock. Going by Screener.in it appears to be fairly valued.

Absolute number- if we think PE of 3 is too cheap then on what basis first place? Second most of bankrupt companies hit a 2 or 3 before going for oblivion.

Now Symphony

Remarks: Despite of stagnant acceleration last of couple of years expectation has been high. The PE expansion has come in a year with moderate growth of EPS, around Sep/Oct 14 Symphony was quoting at PE of 50 plus went on to deliver 100%.

Caplin Point

Remarks: The year 2014 and 2015 saw a big leap of EPS resulting a big PE expansion to 40 plus. Despite slowdown in growth expectations has been too high still, price has moved from 1000 to 1900 almost in 18 months (390*5).

Era Infra

Remarks: first example of low PE company went to bite the dust and finally knocked off from brouser.

Hanung Toys

Remarks: same as ERA Infra, massive wealth destruction from low PE.

In short low PE stocks are not cheap as what is low to me is high to others. PE alone cannot determine anything. I take as expectations measurement; low PE means low expectation. I am more comfortable buying a stock trading at higher PE but with an important caveat EPS is accelerating. I won’t buy stock where EPS is crashing down and PE is shooting up. If EPS goes from 10 to 15 and PE goes from 20 to 25 expectations is building up. Crowd is singing along, go there and sing and enjoy. Of course, nothing takes away in determining legitimate reason behind EPS growth.

Price to Book or Price to Cash Flow: I call this hopeless KPI and don’t even look at it. Apologies but I have my logic for views.

  1. The book value determination is specific to texture of a company. Tangible asset and intangible asset can distort the whole picture.
  2. Nowhere inflation accounting plays a hard game, the value of asset may be severely understated or overstated. Rather I would use reproduction value of asset even with couple of assumptions. Intangible asset may need serious impairment as well.
  3. Company’s capital allocation decides book value to large extent which is a discretionary decision. Company with high dividend or shareholder pay-out will have a low book value. Not necessarily bad for shareholders.
  4. Cash flow statement of movement of cash inflows and cash outflows. The way we determine free cash flow can drastically impact our measurement. For example, deferred revenue expenditure is excluded as non-cash component.

My argument is not against cash accounting or book value concepts but measuring crowd behaviour against determinants. I had little success in past, these days I don’t pay attention at all. Of course the utility of book value and cash flow statement have significant usage, be its determining asset efficiency or unearthing creative accounting practices.

I will move to more sensible two other approach Discounted Cash Flow (DCF) and Franchise Model Valuation (FMV). I rarely do a DCF these days as well, even if I do just a view point; not a sole choice.

Good wishes.

11 Likes

Situation 1: Salary and expenses go up by 10%and indirect income grows by 10%
Sir,

Sorry for querying on this after such a long time since you posted it.

Could you please explain how the numbers for the Indirect Income grow in this chart? As also the "The 159% return in 20 years, if we bond rate of 8% it gives a multiplier of 73%. If we buy today we will pay 73% of 22.99 a share which is 16.78 a share. The current PE is 8.85 we will get 148.50 which is a roughly intrinsic value as entry check point. and how does one arrive at this.

Shall be obliged if you could kindly guide.

Regards and thanks in advance

This is one method I was using in past for few years, inspired by book value discounting with risk free rate. But that’s not an excuse for replying to your answering.

What I will do rather is, extract old laptop and prepare fresh examples and repeat this example as well. Let’s put a new post altogether. I will give an attempt post 15th, same weekend should be able to reply.

Apologies for delay.

1 Like

Sir,

Request you to kindly help with this.

Regards,