
Is polycab issue an advantage to Finolex cables re rating?
Finolex has its own issues related to ownerships. Otherwise it would have never traded at such low multiples to its peers.
4 Likes
This NOTE does NOT delve into Finolex specifically but provides an Insightful Sectoral overview of ALL the 20 listed Power Cable companies (as categorised by Screener.in) in India.

Power Cables are to Electricity, what Roads are to Automobiles.
If we’re going to hit the 5$ Trillion GDP mark, we’re going to need a hell lot more Energy/power/electricity!
Wires & cables being the carriers of Electricity, are fundamental to our growth goals as a nation  So, In this note, we’ll conduct a mostly Quantitative Analysis of 20 Listed Power Cable companies in India.
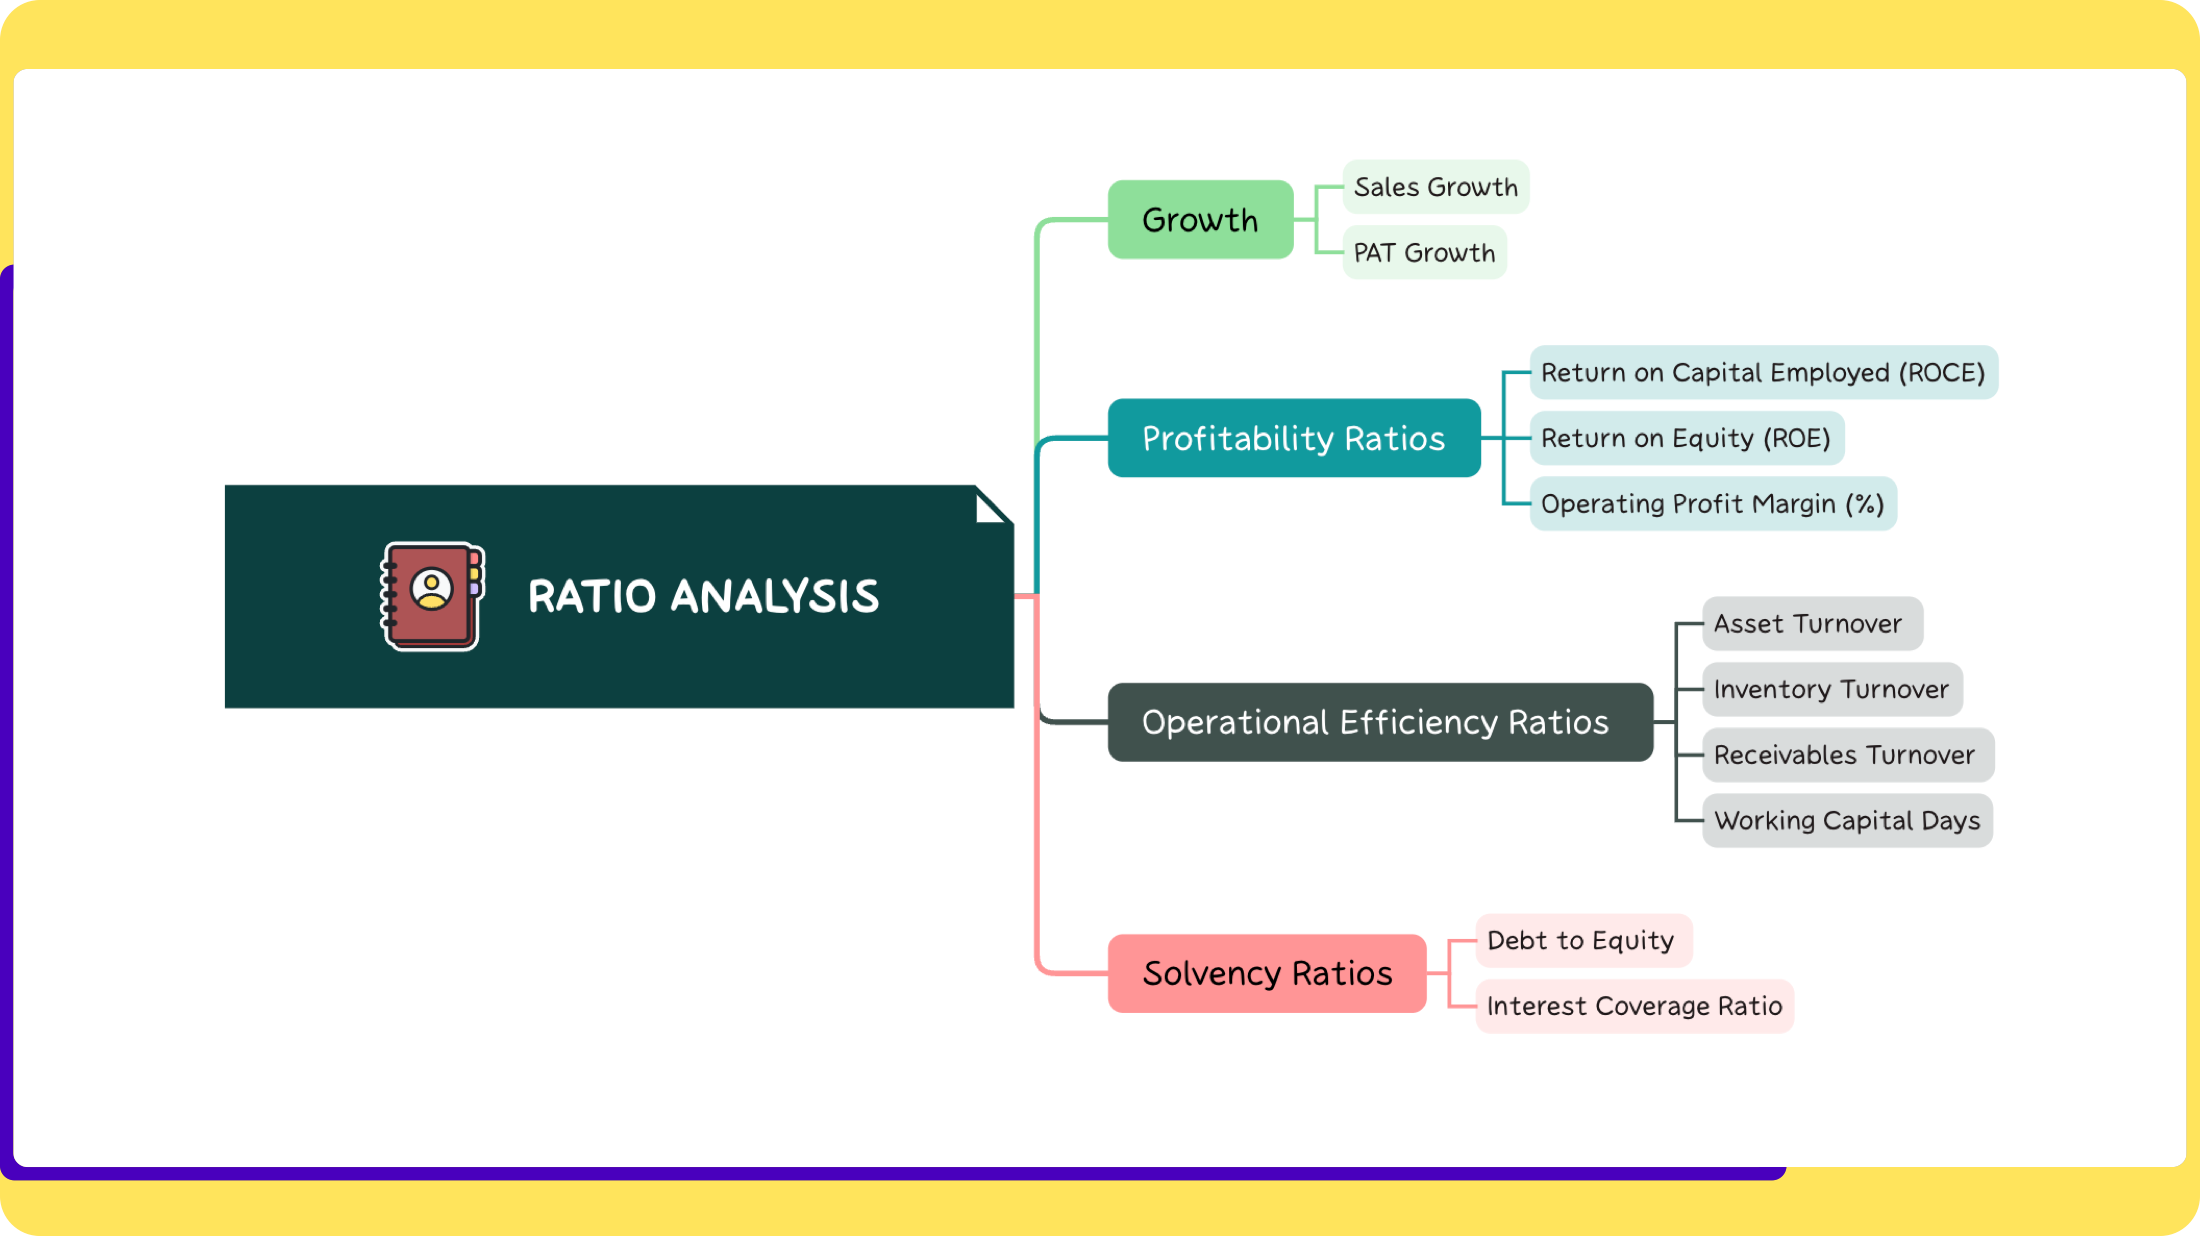
Some (not all) of the Ratios we will be using are :
Also, just some ultra-basics: Power cables are usually categorised according to the voltage of the current they can carry.
They are categorised into Low voltage (< 1000 Volts), Medium ( 1 - 36 KV) & High Voltage (36KV+).
Their respective use across the Power Value Chain are illustrated below

With that basic background, Let’s Go! 
- Market cap distribution: Only 4 (20%) of Companies have a Market Cap of 10,000 Cr+, which is unsurprising. Even between those 4 largest companies, the variance in M.Cap is huge (Pareto’s 80/20 principle)
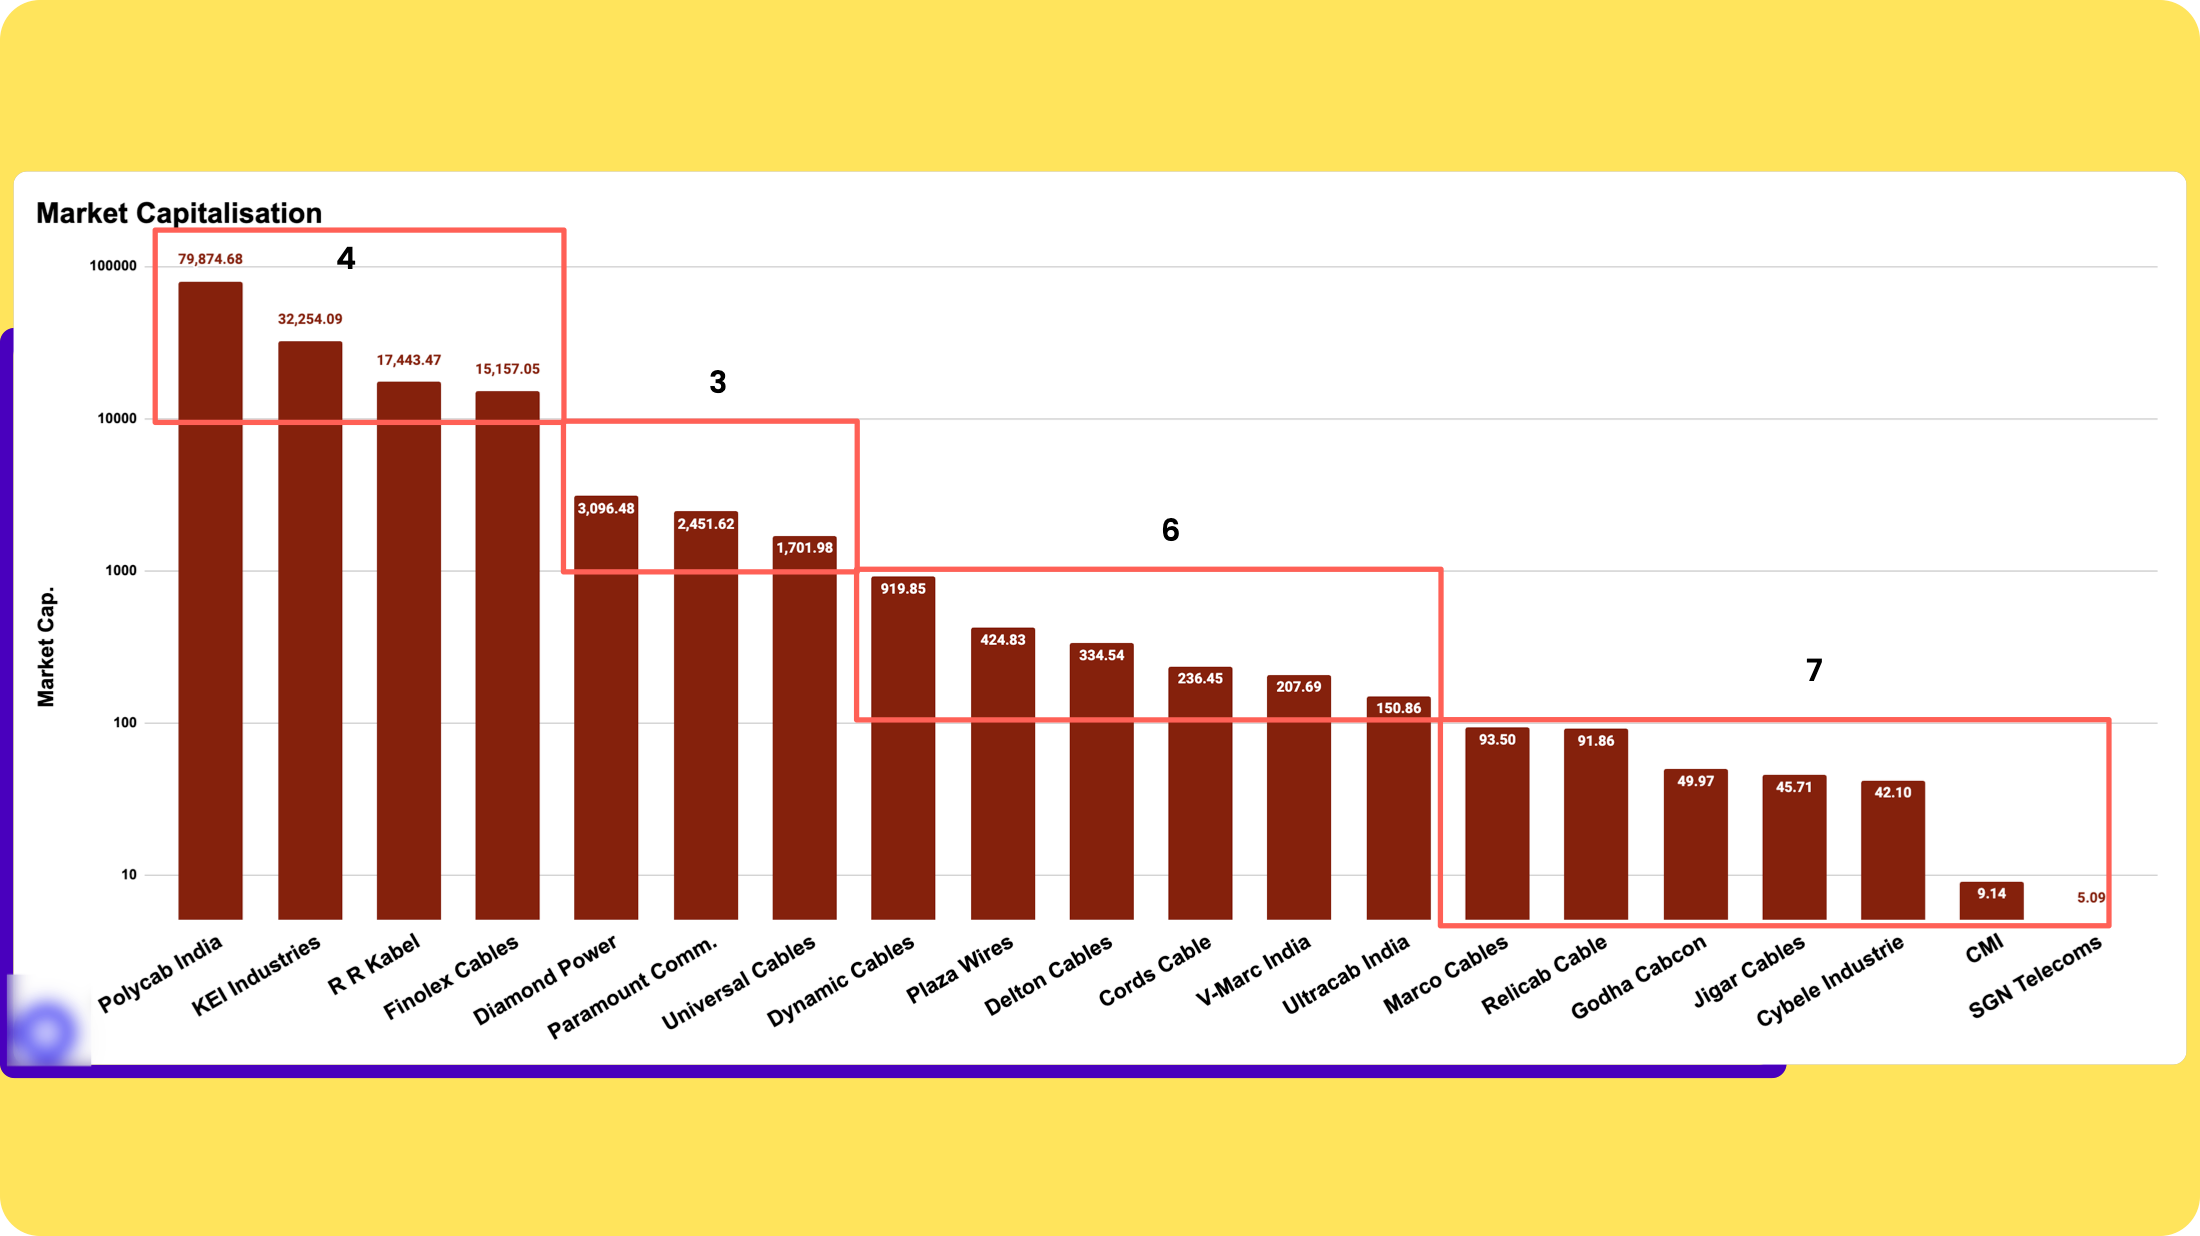
Log scale (Data as of 5th April 2024)
- Does Size Matter? : Data (ROCE last 5 years) suggests that Size matters for the Industry. Larger size begets more efficiencies and economies of scale. There are 3 noteworthy points in the Historical ROCE chart below.
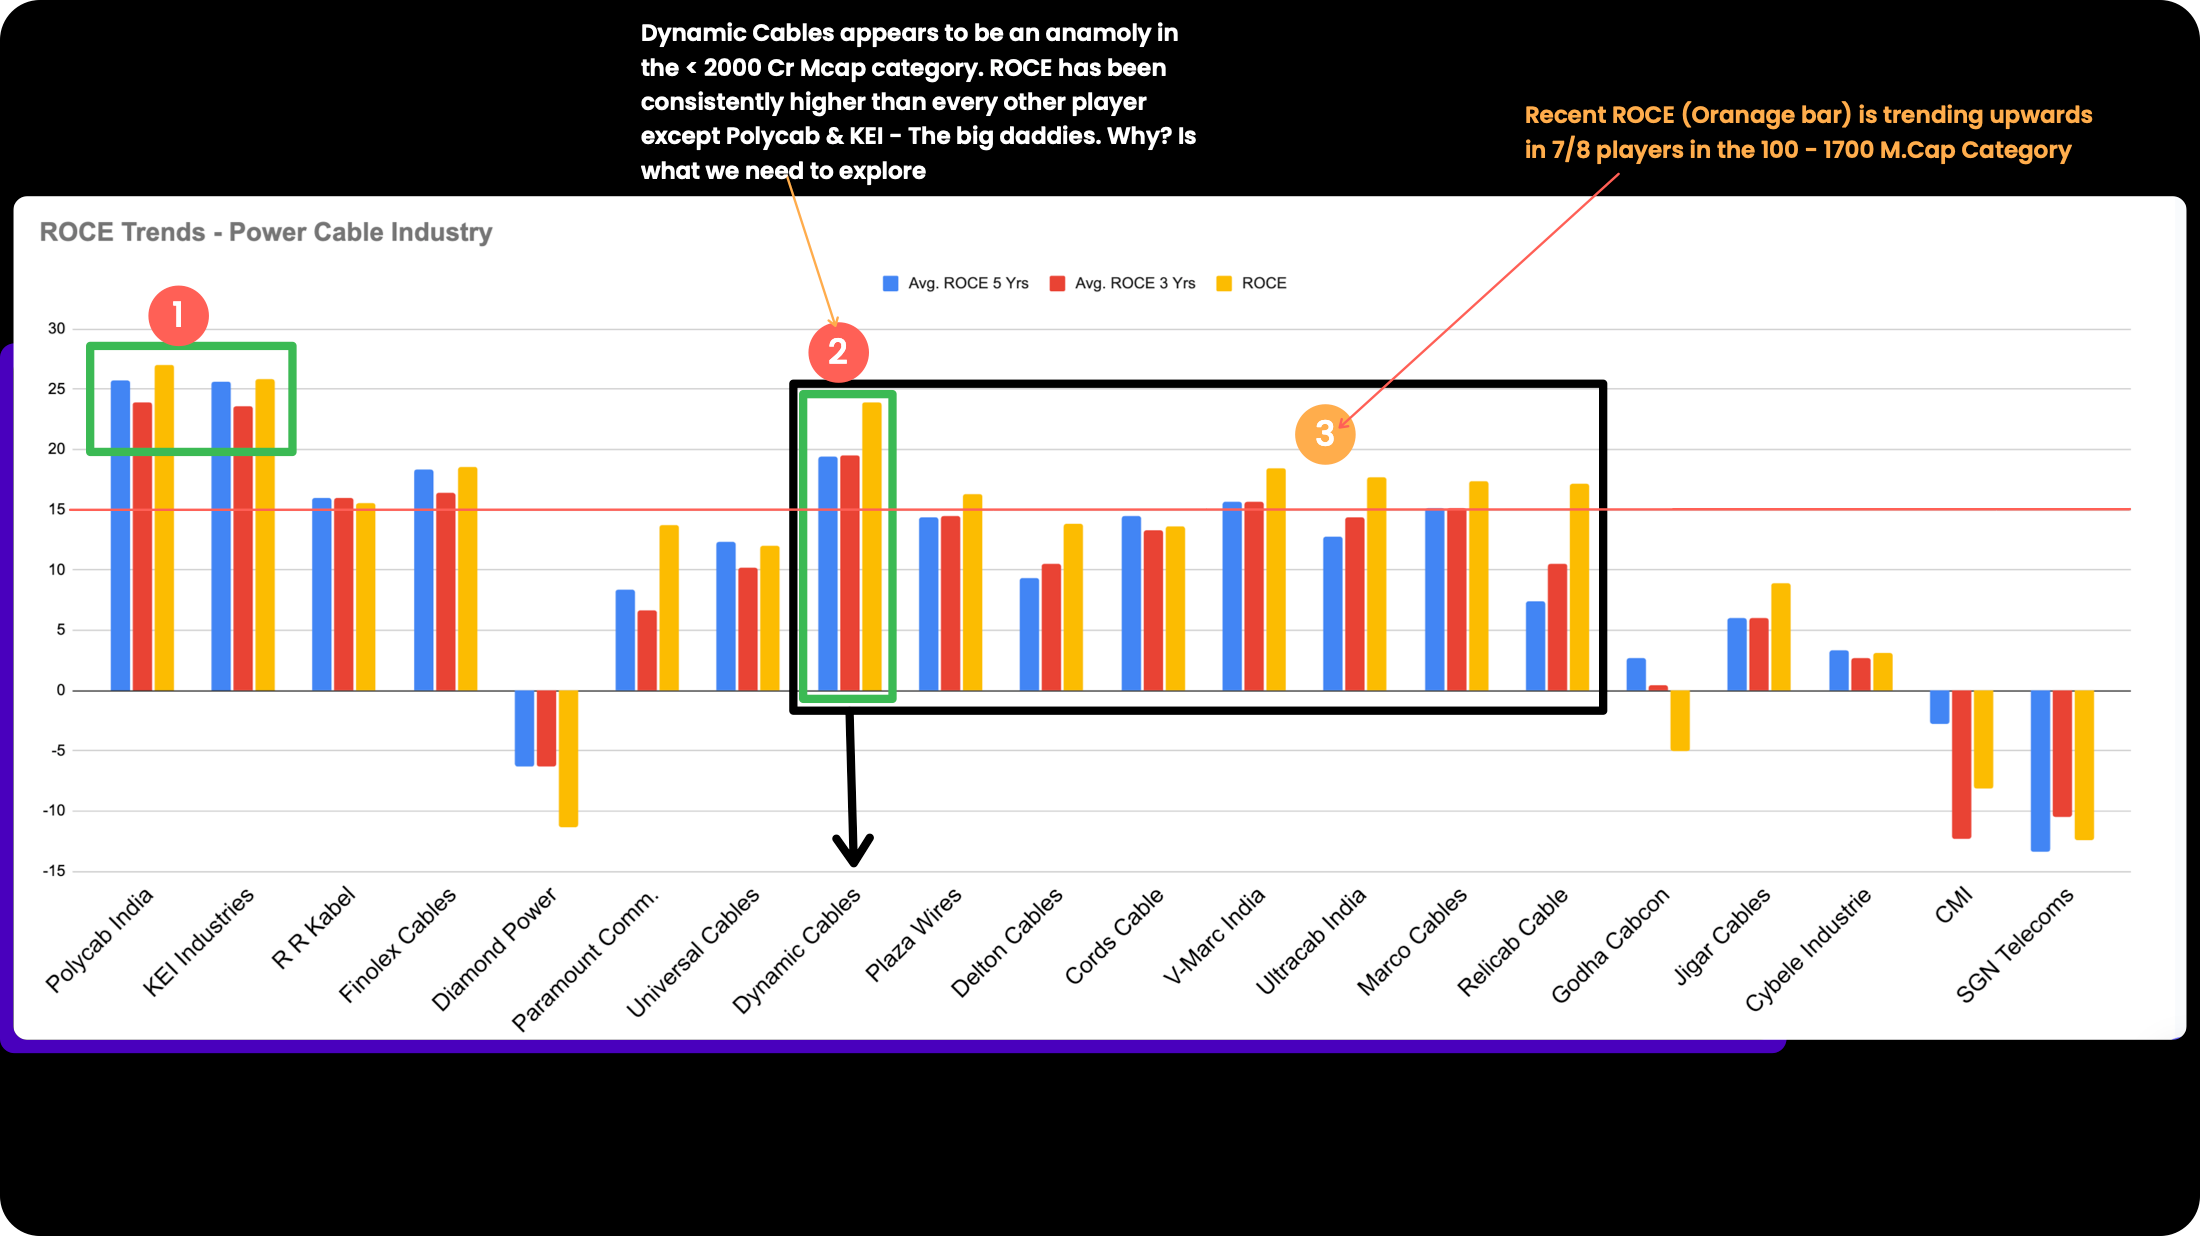
Source: screener.in data | Left to right: Highest Market Cap to lowest.
-
‘Size Matters’! This is evident from the chart below which shows Polycab & KEI seem to have consistently high ROCE, most likely because of their larger size (NOTE: Size should ideally be measured in Gross block terms no M.cap)
-
Dynamic Cables is an anomaly in that it has consistently (last 5 years ROCE) maintained high ROCE vs 18 other peers.
-
The sector is experiencing is positive uptrend (Improving ROCE). Not surprising given the increased spending on the Power/Real Estate/Infra Sectors.
-
Some of the differences in ROCE amongst players may be explained by the Business Models i.e. their B2B vs B2C mix, their product mix etc. That analysis would be a logical next step i.e Performing Deep dive into specific companies
3. Smaller companies have higher Debt & lower Interest Coverage
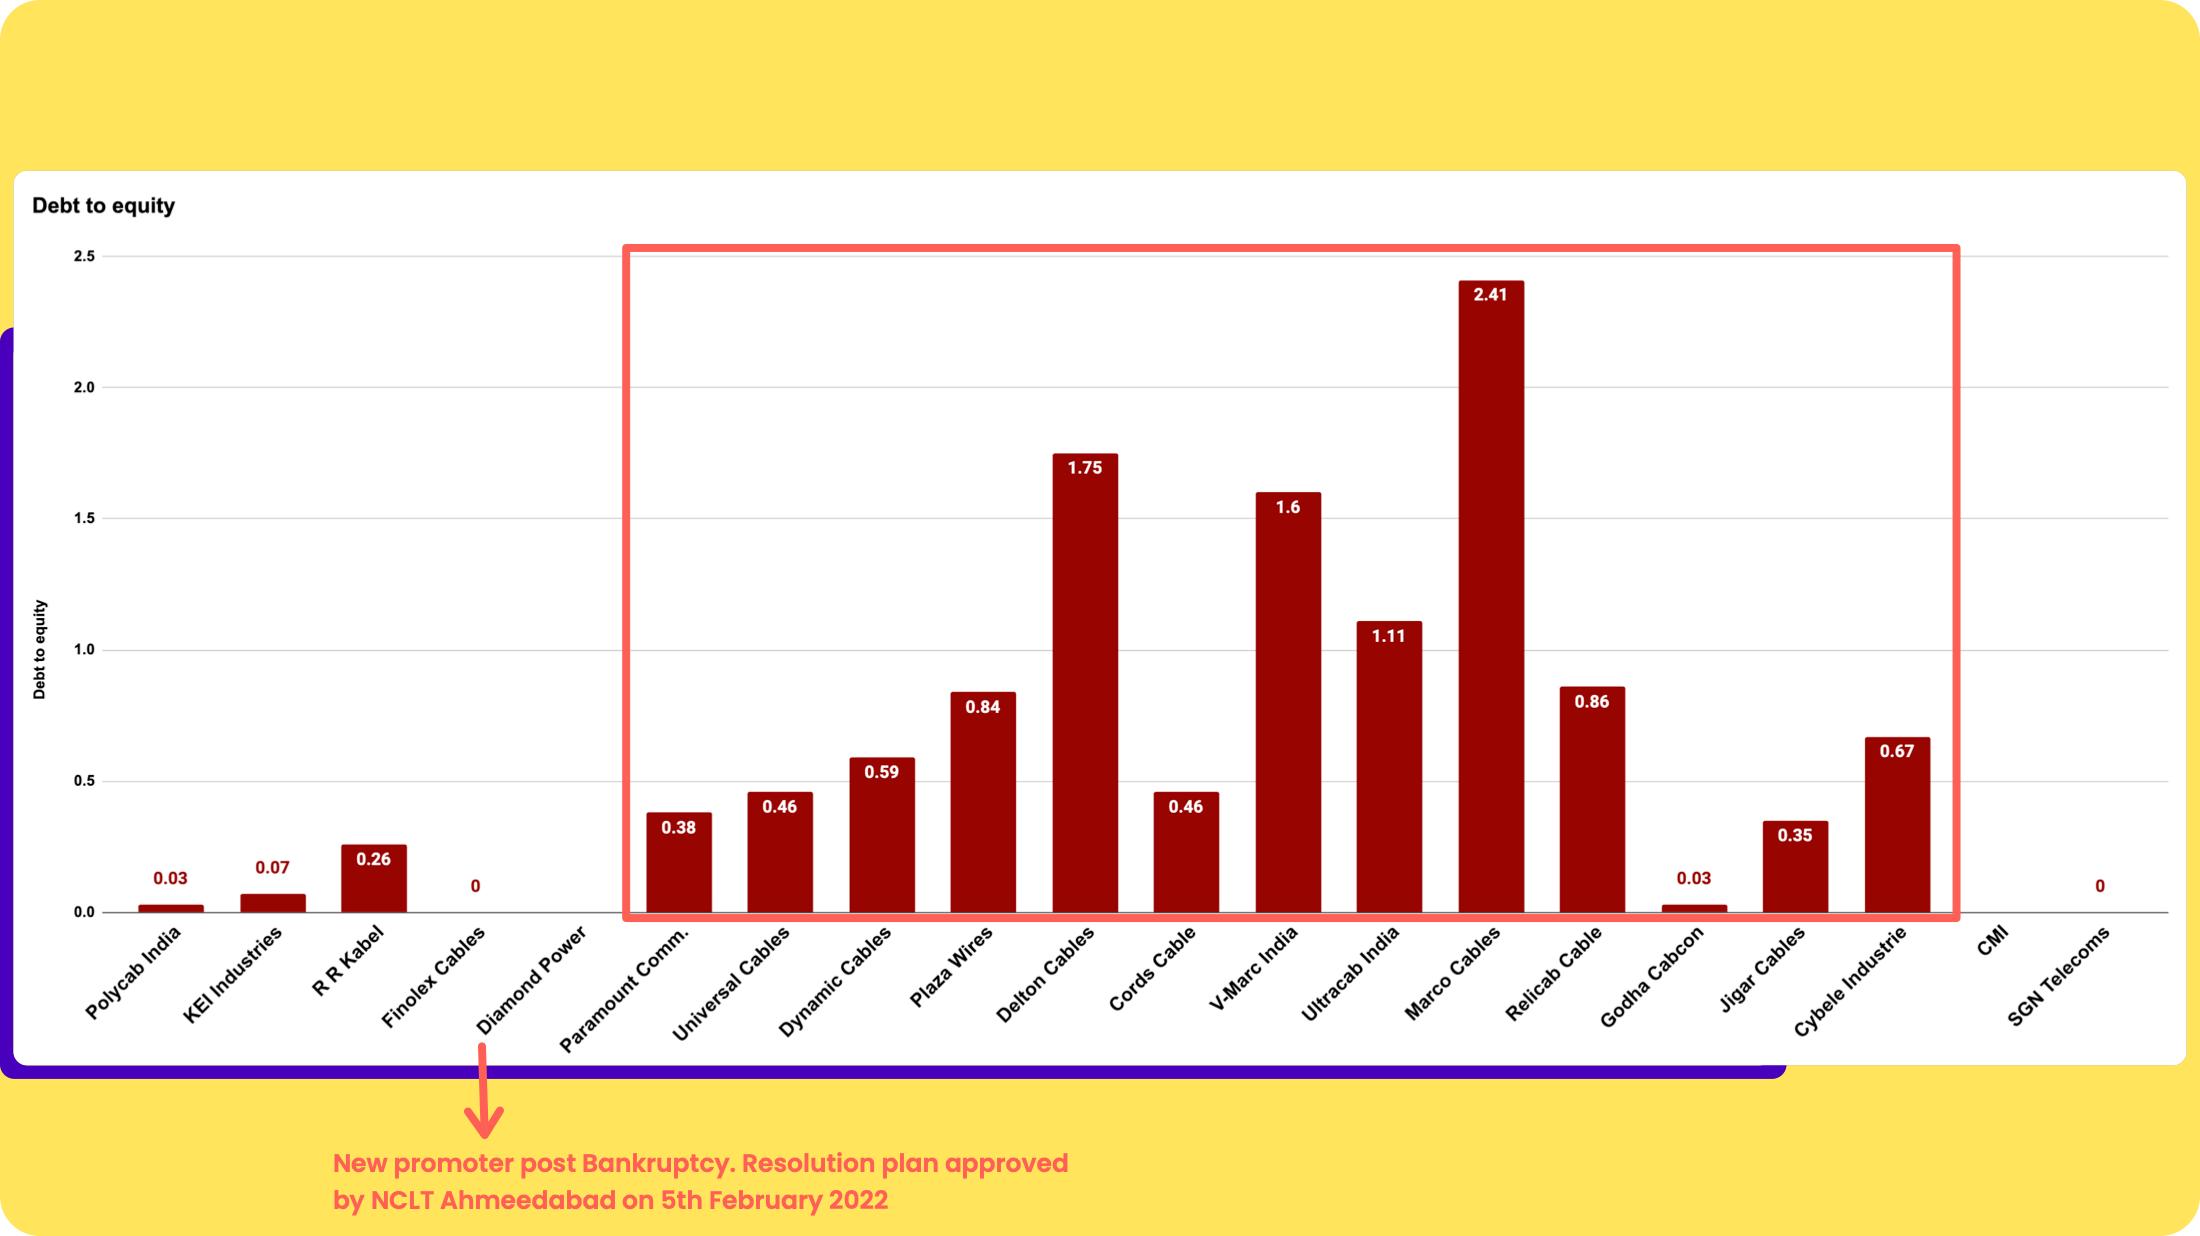
Left to Right: Highest Market Cap to Lowest Market Cap companies in the sector.
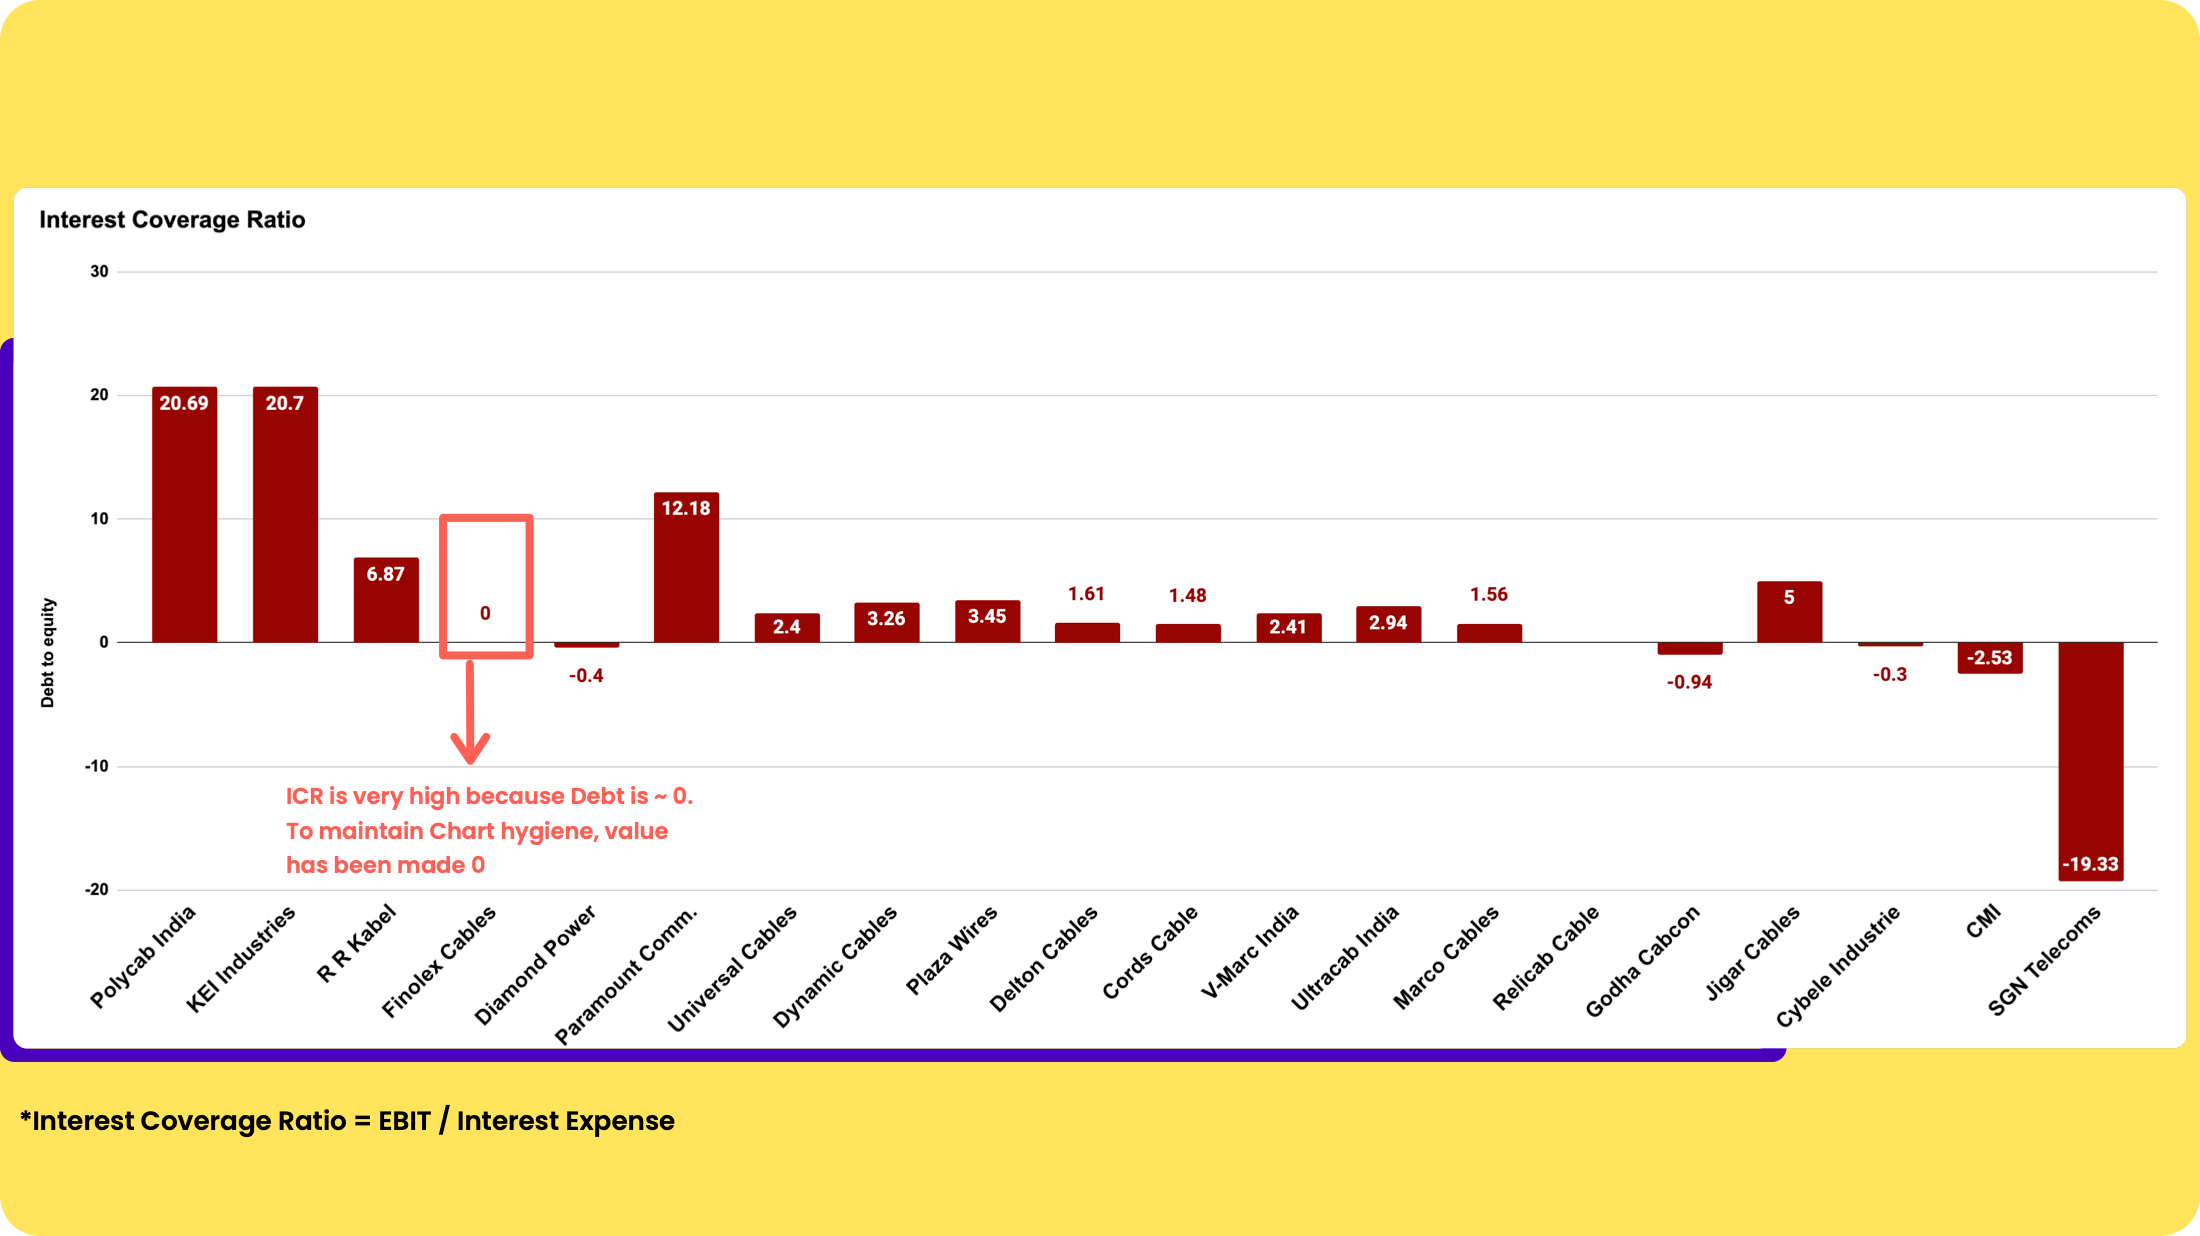
 The higher debt for smaller companies is mostly working capital Debt.
Working capital days (No. of days to convert working capital to sales) for smaller companies tend to be higher (unsurprisingly). Higher WC days would lead to higher Working capital debt (measured as % of WC to Sales)

- Asset Turnover
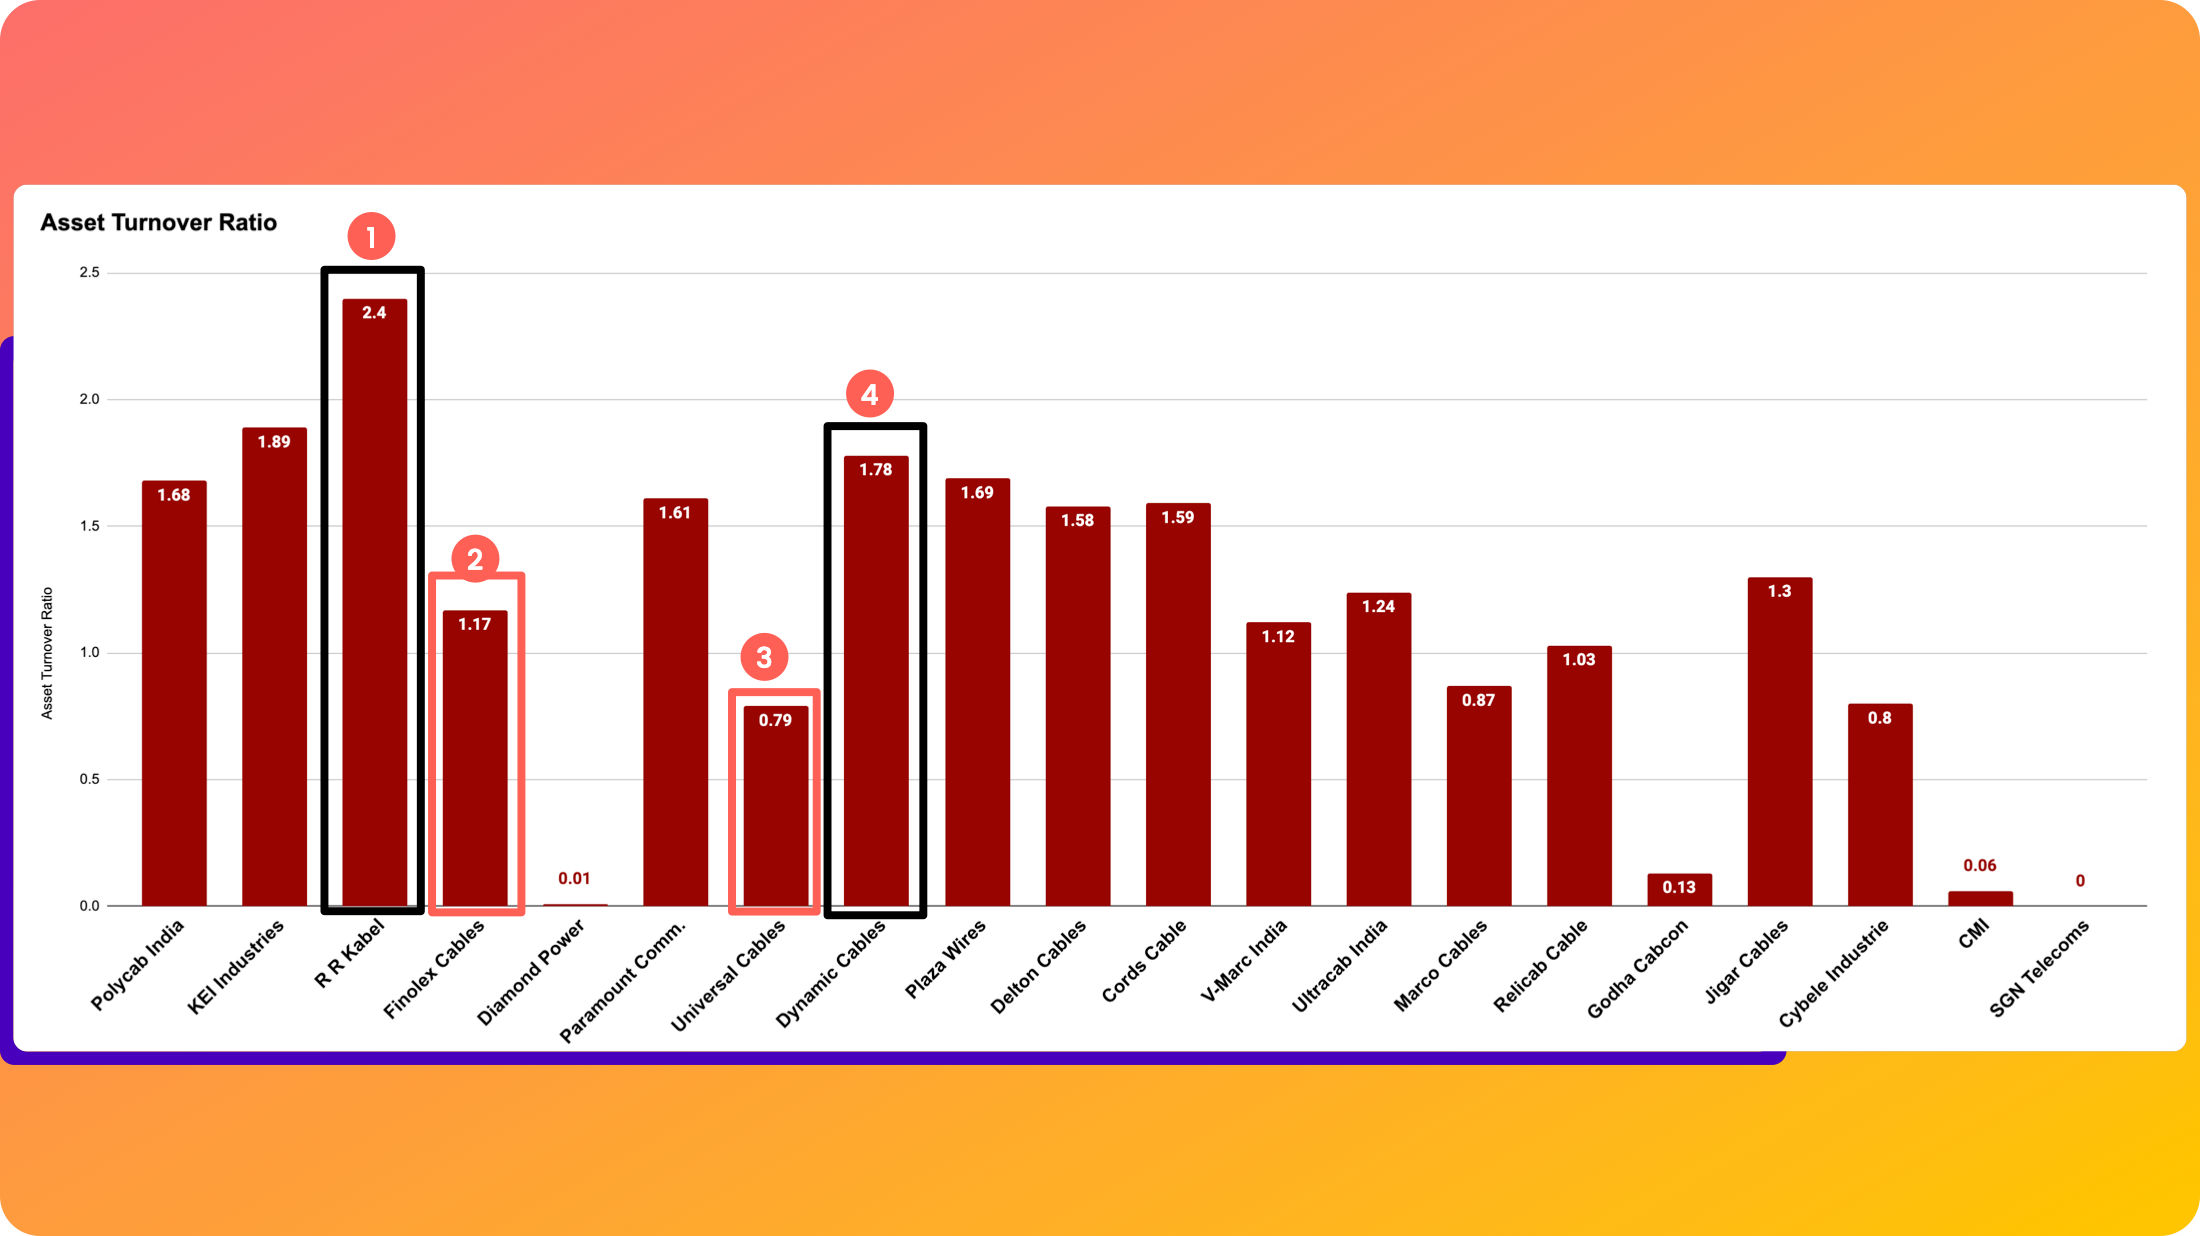
Larger players tend to have higher Asset Turnover (Sales / Assets) which means they’re able to squeeze out more rupees in sales from every rupee of assets held.
There are also positive and negative anomalies amongst the pack, as shown below.
source: Screener.in Data |
RR Kable and Dynamic Cables are examples of positive anomalies.
Finolex and Universal cables are examples of negative anomalies.
At least amongst the top 4 players, FMEG could be the reason why RR Kabel has a notably higher Asset Turnover.
RR Kabel derives 11% of its Revenues from the FMEG Segment - Fans, lights, switches etc whereas Polycab derives ~8% of its Revenue (9MFY24) from FMEG, Finolex (< 5% Revenue from FMEG) whereas KEI is NOT present in FMEG at all.
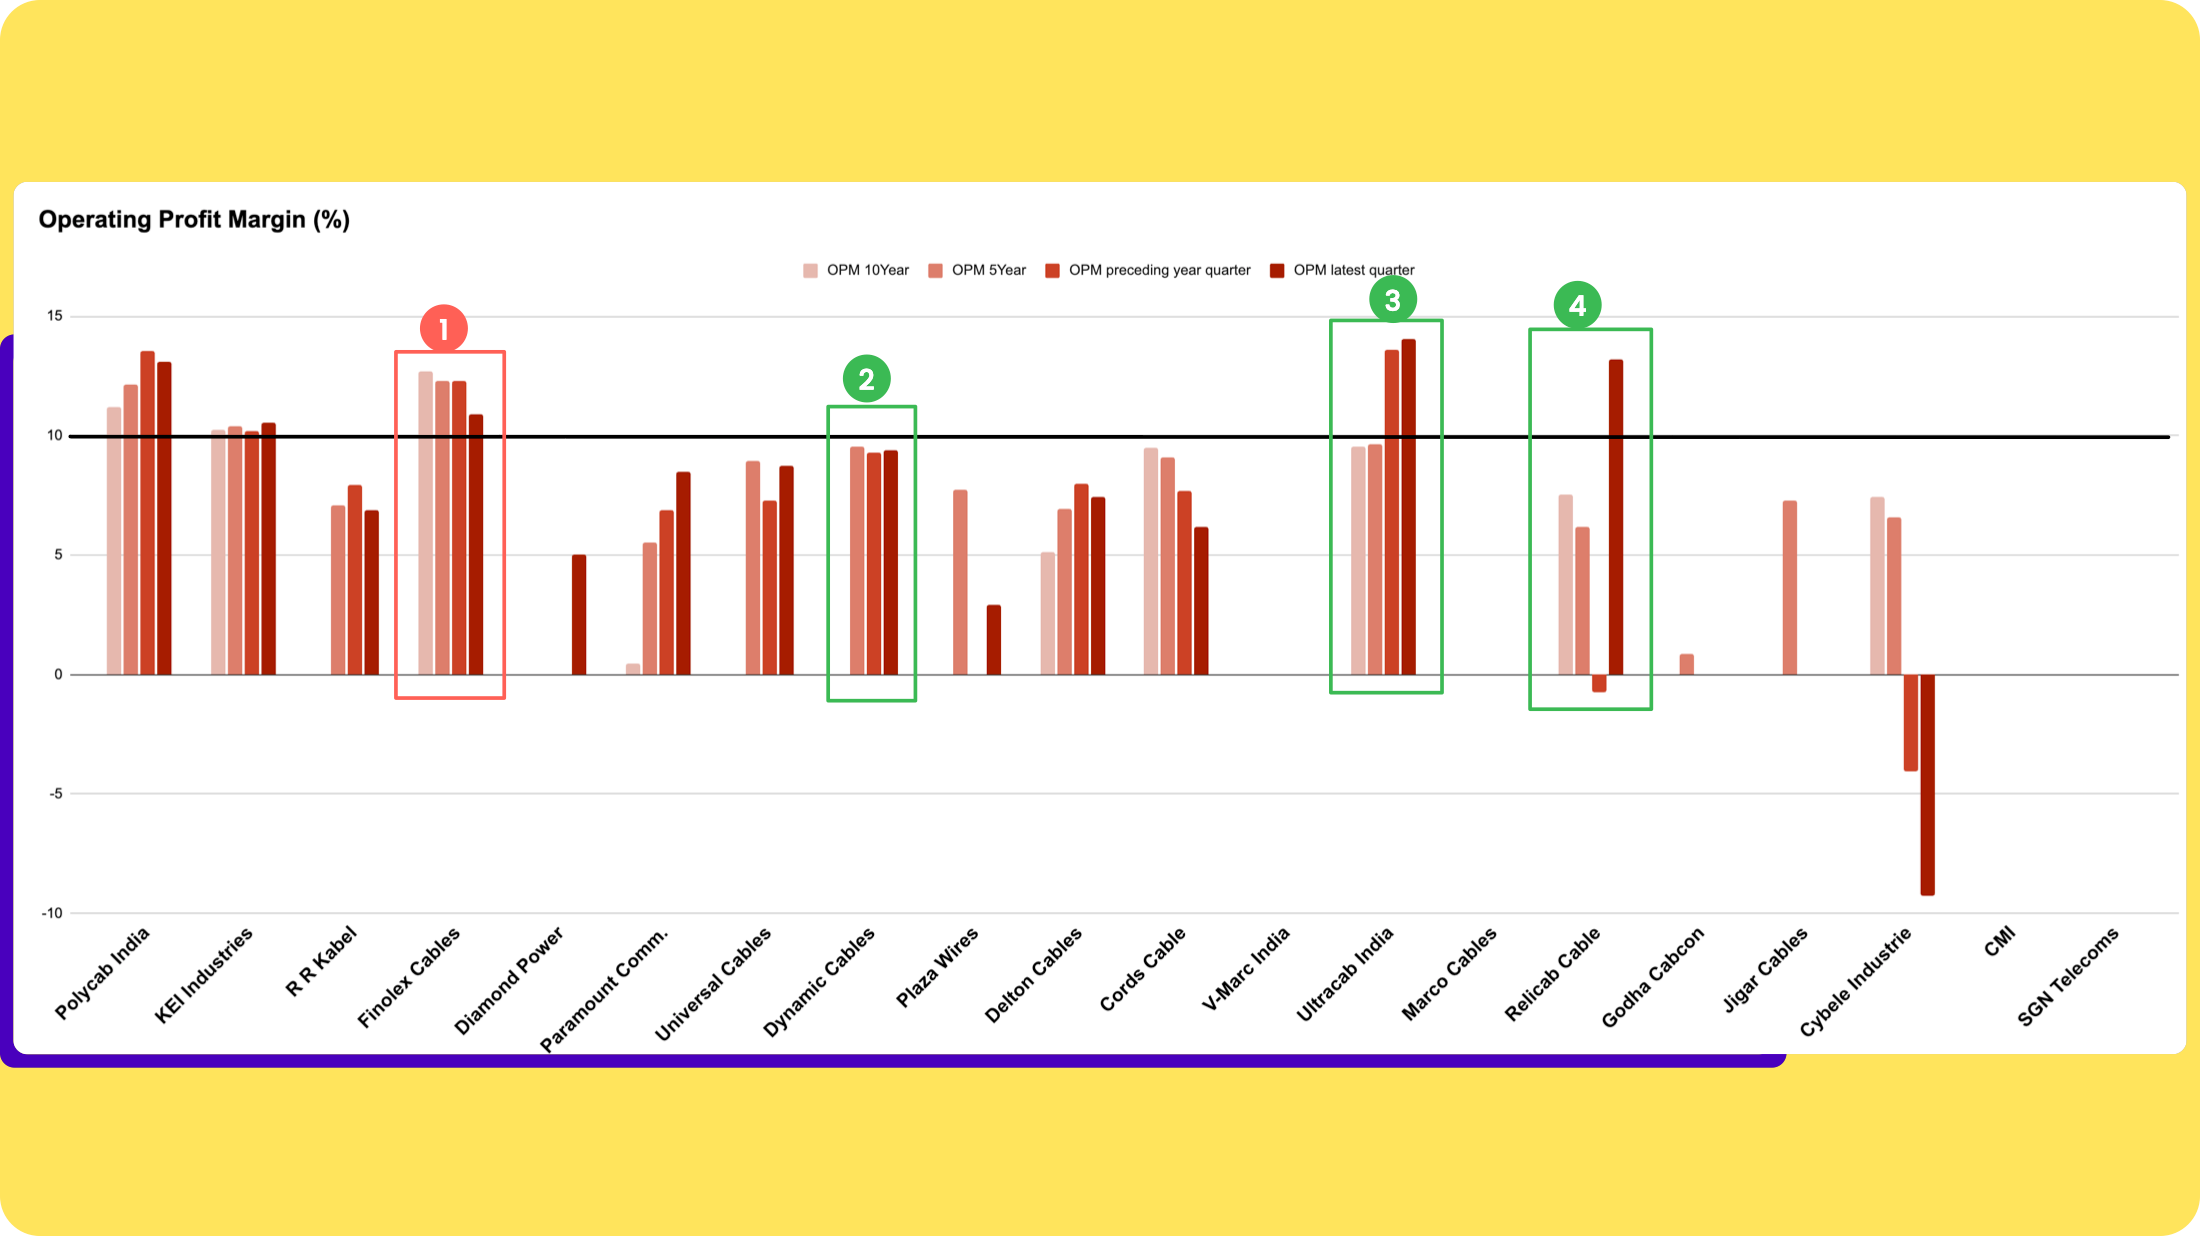
- Operating Profit Margin (%) [EBIT / SALES]
Operating profit Margin (%)
Dynamic cables and KEI Industries have the most consistent margins across timeframes and Ultracab & Relicab (< 200 Cr M.Cap) have shown the sharpest improvements in OPM (%).
Finolex’s shrinking margins could be a sign of shrinking pricing power (assuming it has some, to begin with) or poor operating expenses management etc.
Whatever the root cause, shrinking margins make markets unhappy. This may be one (of the many) reasons why Finolex trades at a significantly lower PEx (< 26X) vs peers.
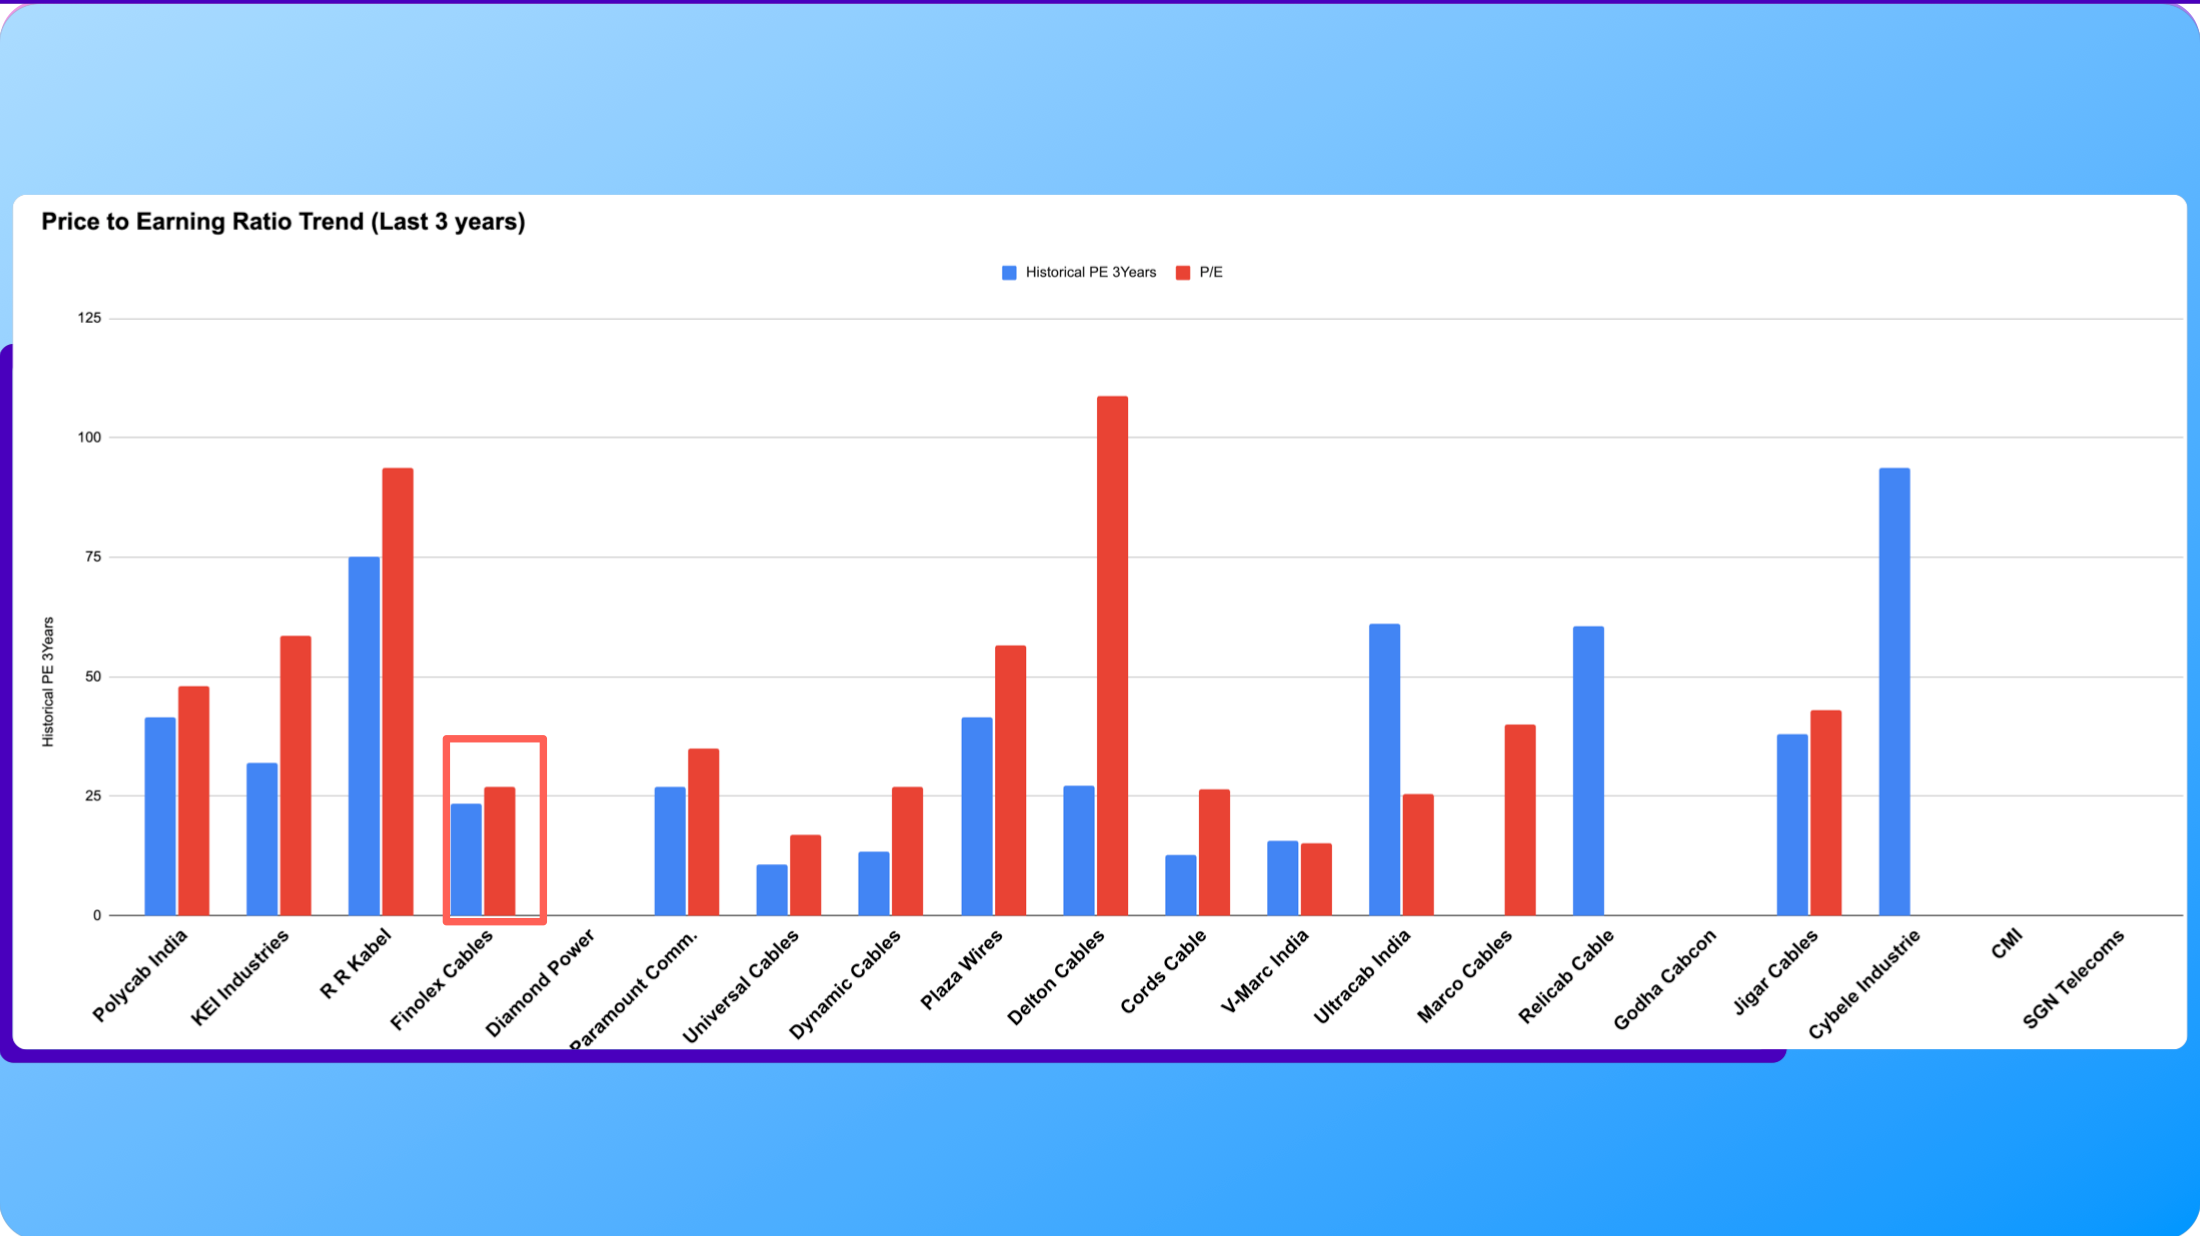
The above chart also displays one of the hallmarks of Wealth creation in the stock markets: P/E Re-rating. And when it rains, it pours!
Every single (almost) co’ in the sector has undergone significant re-rating (Exceptions: V-Marc & Ultracab) and judging by the the multiples, it’s unlikely there is room for further expansion, at least for most companies in our cohort.
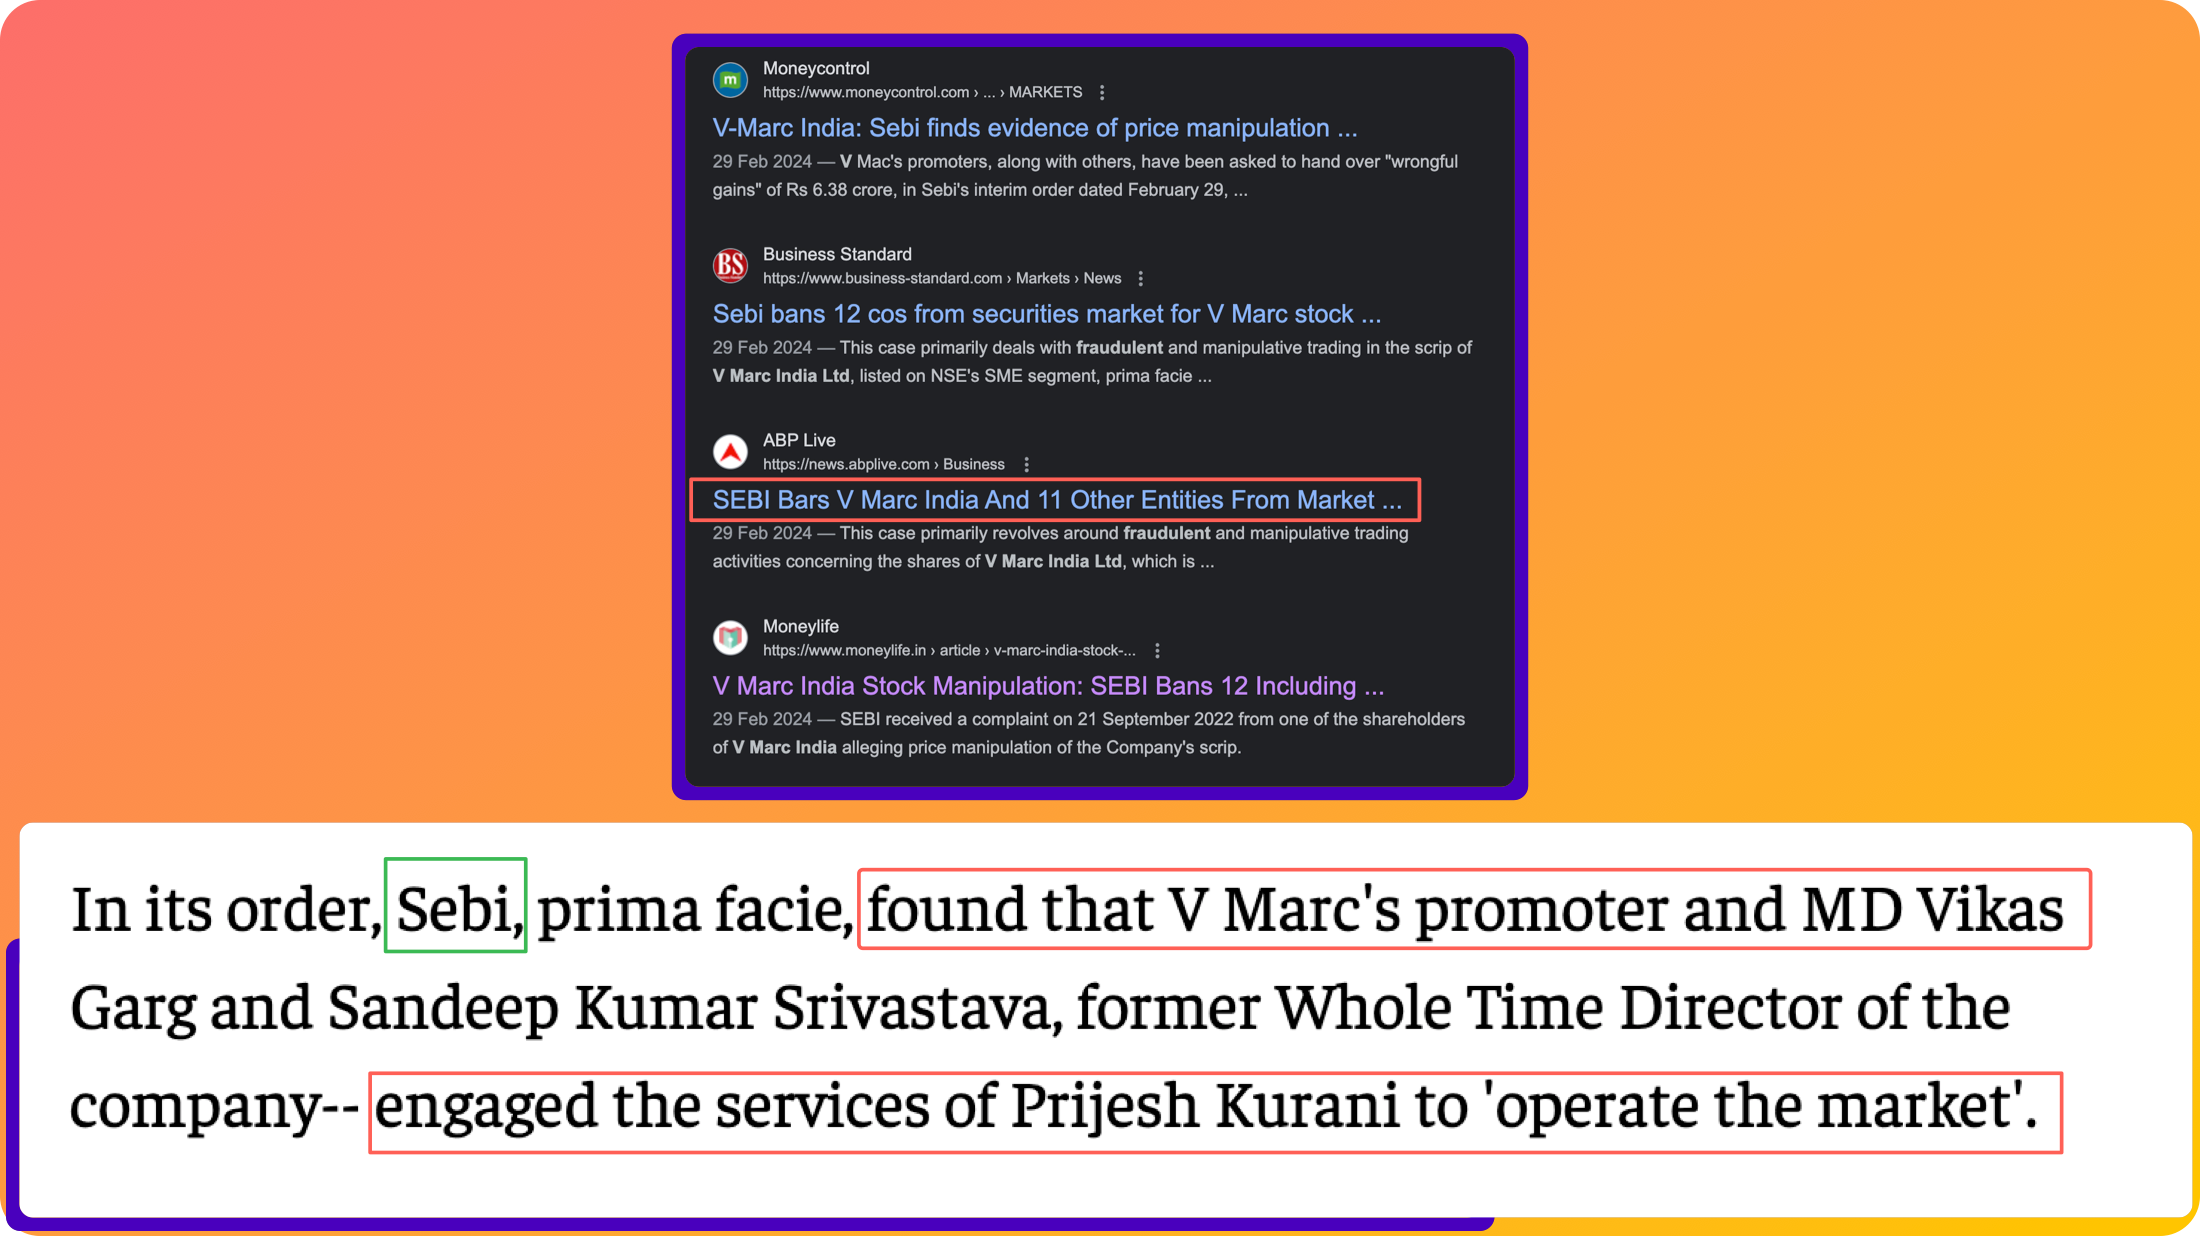
As for Why V-Marc India trades at such a low valuation? It’s just Fraud baby! 
- Sales / EPS Growth
Finally, the growth metrics. Firstly, the last 3 years Avg growth may not be the best metric for visualising/judging the recent change in Sales/EPS, however, using the data below there are 2 key observations we would like to comment on.
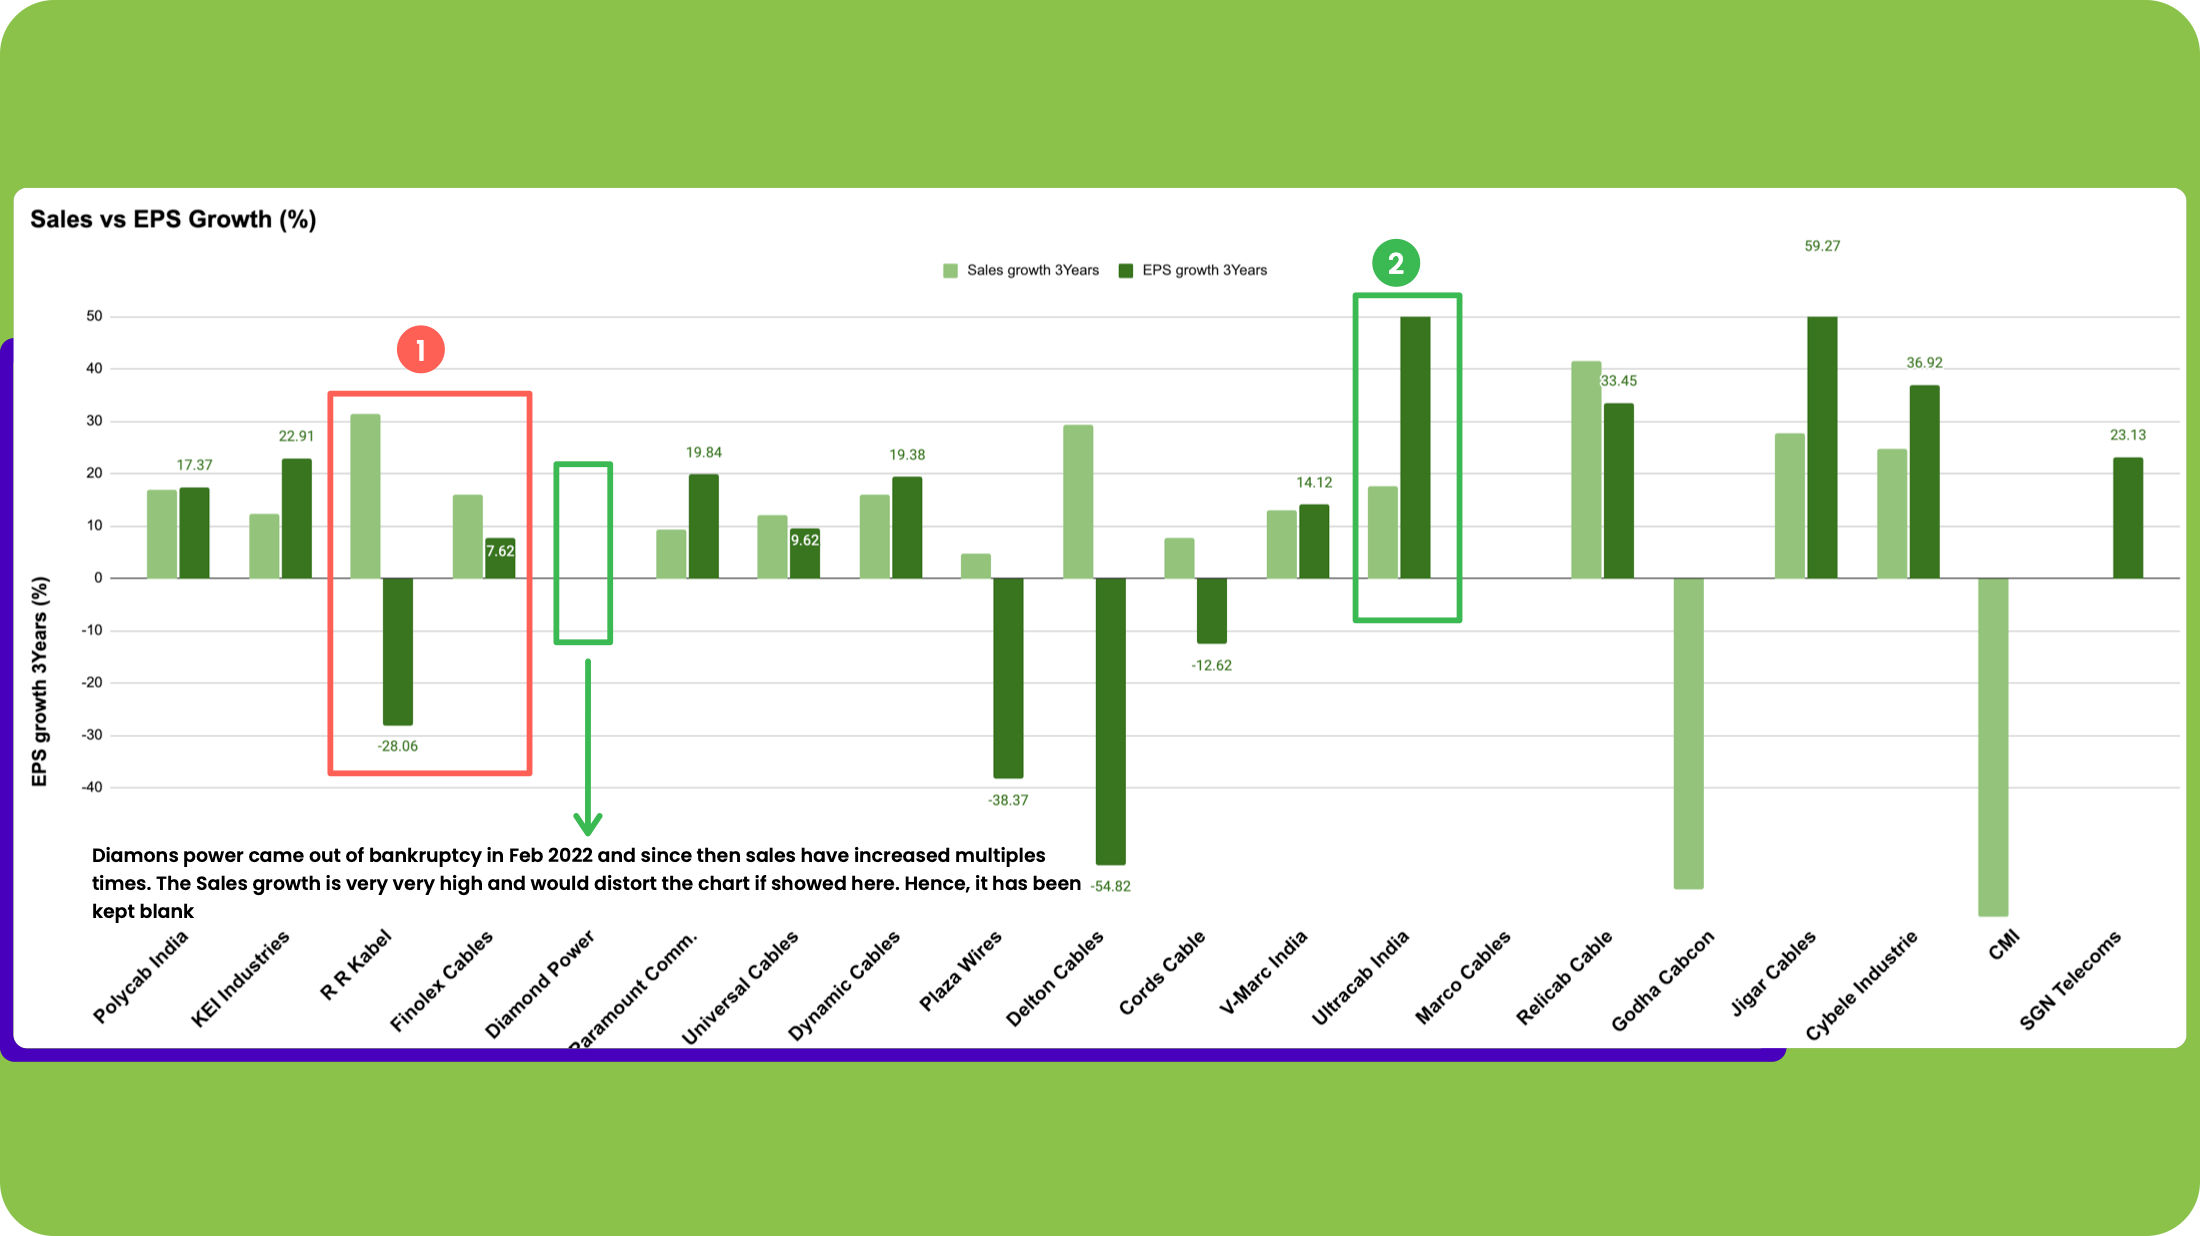
RR Kabel and Finolex have not been able to grow EPS as fast as Sales (why? Worth exploring in the next step: co’ wise research)
Ultracab has shown EPS growth much significantly higher than Sales (including Jigar cables & Cybele Industries)
- 1 Year stock price Returns
Want to guess which stocks gave the highest returns in the last 1 year? (Not that it has any predictive value). Here’s the jaw-dropping data :
 7 / 20 Stocks gave a 100% + Return
9/20 Stocks gave an 80%+ Return
This reminds of some Key lessons we can learn/re-learn from the stock price behaviour of stocks/sectors :
If you get the sector right, the probability of making satisfactory returns goes up!
When a Sector Turns, the best stocks in the sector rise at first and as the cycle continues, the relatively worse (sometimes smaller) players tend to do better than even the best companies (returns wise) because of the delta-from Shit to hit!

Delton Cable surely has my attention and curiosity. The question is: Is it another pump or Dump or is it a special business? Should we find out more?
Tell me in the poll below because a logical next step in my opinion (you can share yours in the comments) is doing a deep dive on any 3, under 2000 Cr Market Cap companies and I need your help to decide  which ones.
Just name your Top pick  Go !!
Go !!
- Universal Cables
- Paramount Communications
- Dynamic Cables
- Finolex Cables
- Ultracab
0
voters
Hope this was insightful, would love to hear your thoughts
Rahul
6 Likes
8be350fd-27e1-4e44-8bd3-e37c12b20e94 (1).pdf (4.8 MB) Good Q3 FY 26 results. Inspite of absence of clear owner leadership the company has been able to do well.
-
Revenue Growth: Q3 FY25-26 revenue grew by 35% to Rs. 1598.6 Cr compared to Rs. 1182.1 Cr in Q3 FY24-25. Nine-month revenue grew by 17% to Rs. 4369.9 Cr.
-
Volume Growth: Electrical Wires showed 28% volume growth in the quarter; Optic Fiber Cable volumes grew by 34%.
-
Profit After Tax (PAT): PAT for the quarter increased by 10% to Rs. 135.9 Cr from Rs. 123.9 Cr, after an additional charge of Rs. 6.01 Cr for gratuity due to Labour Code changes. Nine-month PAT improved by 18% to Rs. 461.7 Cr.
-
Operational Updates: The Preform Facility (Phase 1) and Fiber Draw capacity addition (Phase 1) are under production trials and expected to be commissioned by March 2026.
It is concerning that with such a fantastic brand equity,fully depriciated assets and large land bank and manufacturing facilities the management is not taking initiatives to take the company forward.


Management sees fairly robust demand for optical fiber cables in data centers. Can Gain Market Share from Sterlite Tech and HFCL
8 Likes
finolex results.pdf (4.6 MB)
Good results and margin bounceback by the company. Although the results bump-up is largely due to price increase(copper) but there is 7% volume growth in electrical cables and 230 bps margin expansion. The real kicker in the results is from communication cables which the market was completely ignoring and focusssing on HFCL and sterlite only. Communication Segment revenue grew 62% to ₹176.47 crore, but segment profit skyrocketed from a mere ₹1.30 crore last year to ₹52.52 crore. This was driven by higher optic fibre cable volumes and better realizations, pointing to sustainable demand from ongoing 5G and broadband infrastructure rollouts.
1 Like
the copper wires and cables business is facing high volume growth pressure as competitors also are facing the same problem. Dealers in the Q1 were not re-stocking in hopes of further fall but with copper again starting its upward trajectory there should be a good volume growth in Q2 and Q3.
Coming to communication cables, operating leverage is kicking in and demand is outstripping supply and it’s going to be the case for next 4-6 quarter according to me and backward integration into preform will help margins but it comes at a risk because helium is an input for preform manufacturing which is difficult to source due to West Asia War. Also germanium sourcing is becoming a problem due to China.
Finolex also needs to do some more value adding work like what Sterlite and HFCL are doing to commodity OFC to get better margins and supply to USA and Europe.
Also we need to watch out for capacity expansion plans in OFC.
1 Like
Q1 Concall Notes…Management tone had a subdued bullishness……I felt so
focusing on the optical fibre opportunity…currently, its barely 8% BUT
100MT preform likely to play up from Q3, currently under stabilisation period
Current capacity of 4 mkm ofc to increase to 8 mkm by 31 Aug
Cable capacity is 8mkm, incr it to 10 mkm by Q4
Upcoming preform capacity will cater for the 4mkm ofc capacity, and sourcing for the addl 4 mkm ofc will be thru existing biz relns/channels
Raw material is a challenge(helium, germanium), but they hold inv for the current complete year, and taking appropriate steps for easing the supplies for future.
8mkm is equivalent to 88 mil $ aka 800cr annual basic fibre throughput @current rate of $11-12, but with value addn, this can be 1200cr, infact the mgt eluded to a 300 cr mrr
Capabilities…building them up, will scale to 7k-14k fibres per cable in the near future, will meet any reqmt of fibrecable of DC and AI mkt
Aggression in Marketing… evidenced in the 30-40 cr ofc sales to 2 US/EU based clients in Q1…have created a export Biz devp team to build on this global opurtunity
Currently in discussions (reluctant admission) with multiple clients incl indian DC where civ construction is nearing completion and considers the upcoming demand to far outpace the supply in the country…indian opurtunity is also very huge
Margins… likely to be similar only till the old inv lasts (one gets an impression that the next qtr may be similar) and then normalise to low 2 digit levels.
Old long term Contracts…revised in Jun, Q1 saw enhanced rates for the last month, from Q2 onwards the higher rates on all old contracts.
Spot and contracts at 50:50
Disc…..biased and invested
2 Likes