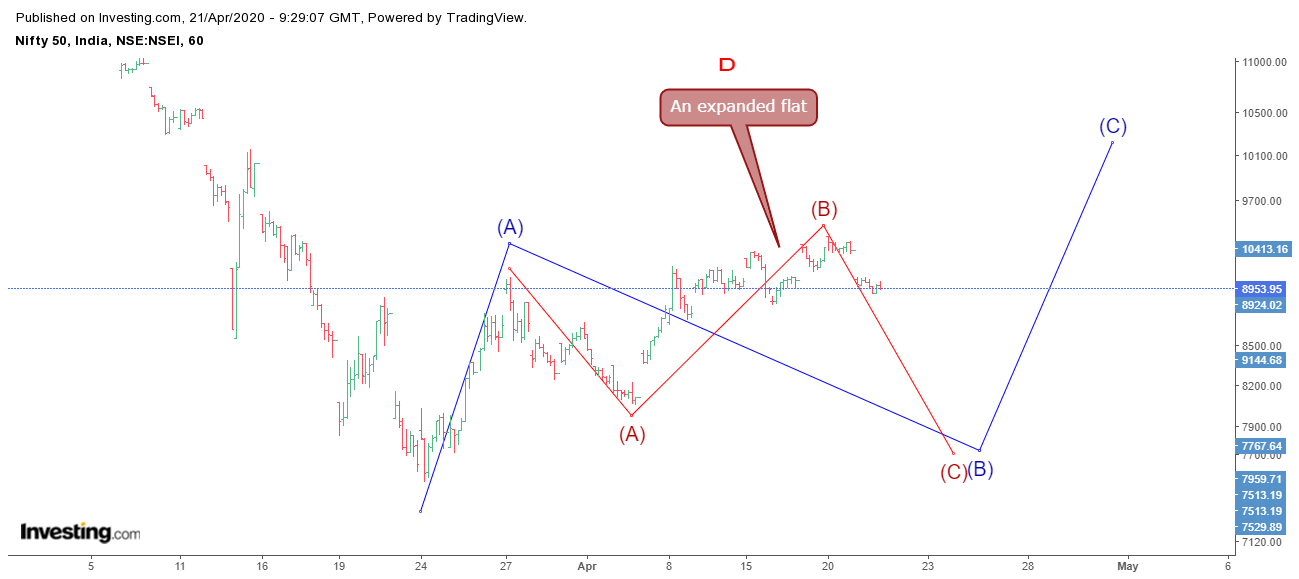
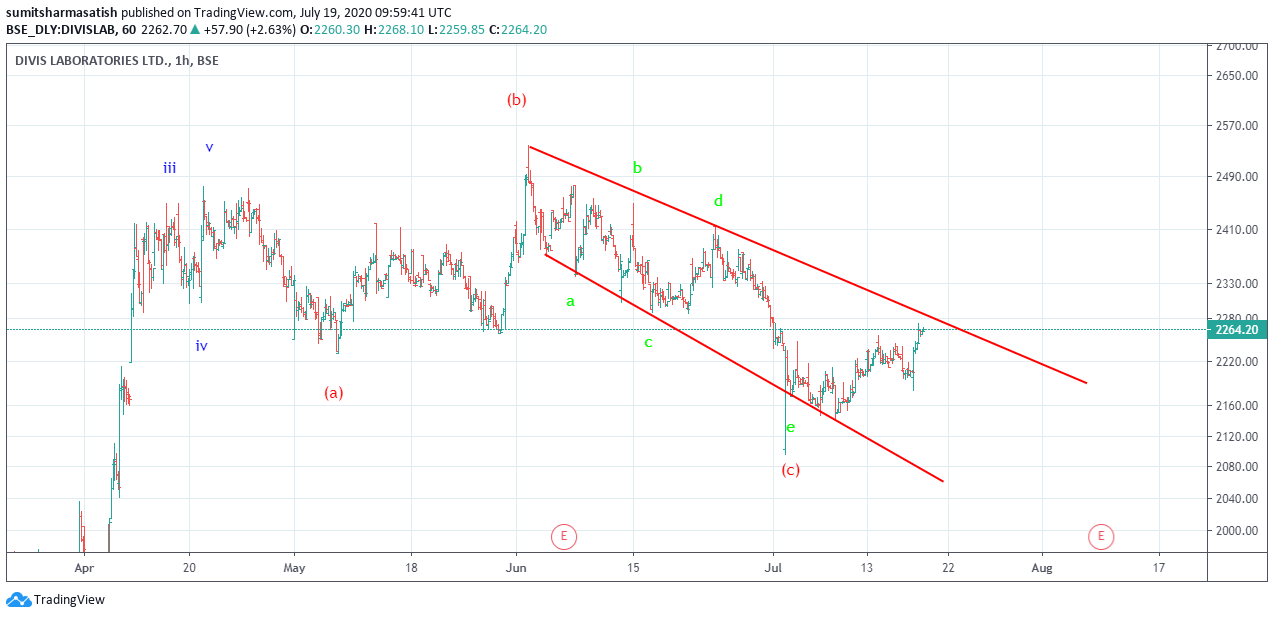
Dear Hiteshji, with respect to completion of ABC pattern, i couldn’t find wave C to have 1-2-3-4-5 pattern…that’s my doubt about its completion…so another alternate count to my mind is that after completion of wave A in upward direction, wave B might be taking a shape of an expanded Flat or triangle shape…please refer the image attached…
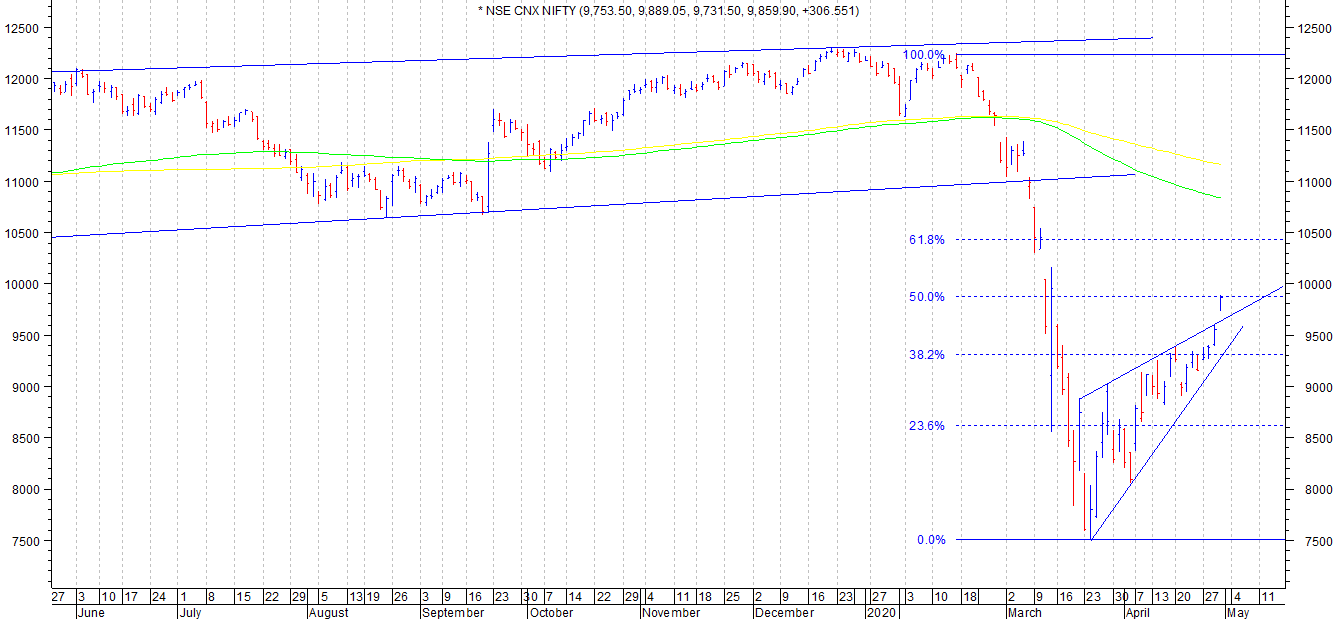
But at the time when US indices are retracing 61.8 percent, Indian indices are facing strong resistance at 38.2 percent…this indicates about strong bearish sentiments in our markets…
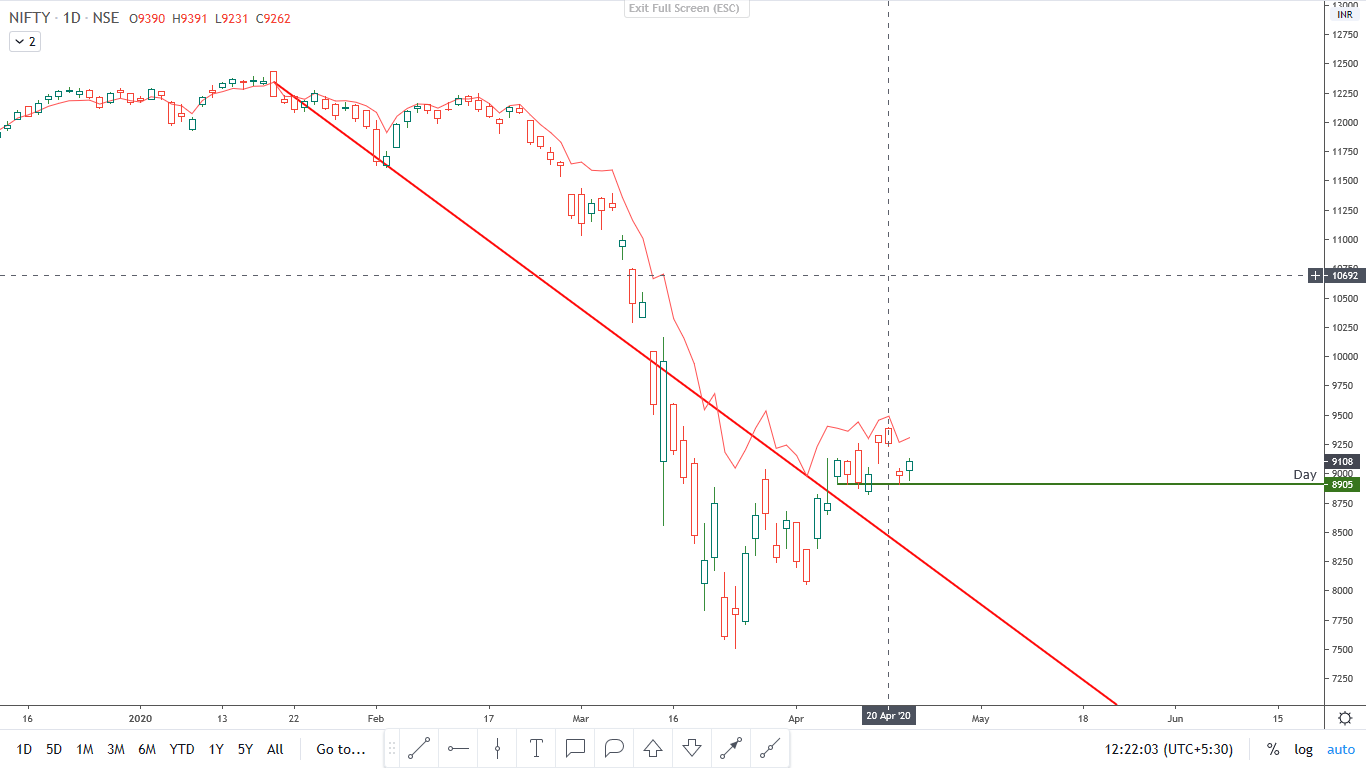
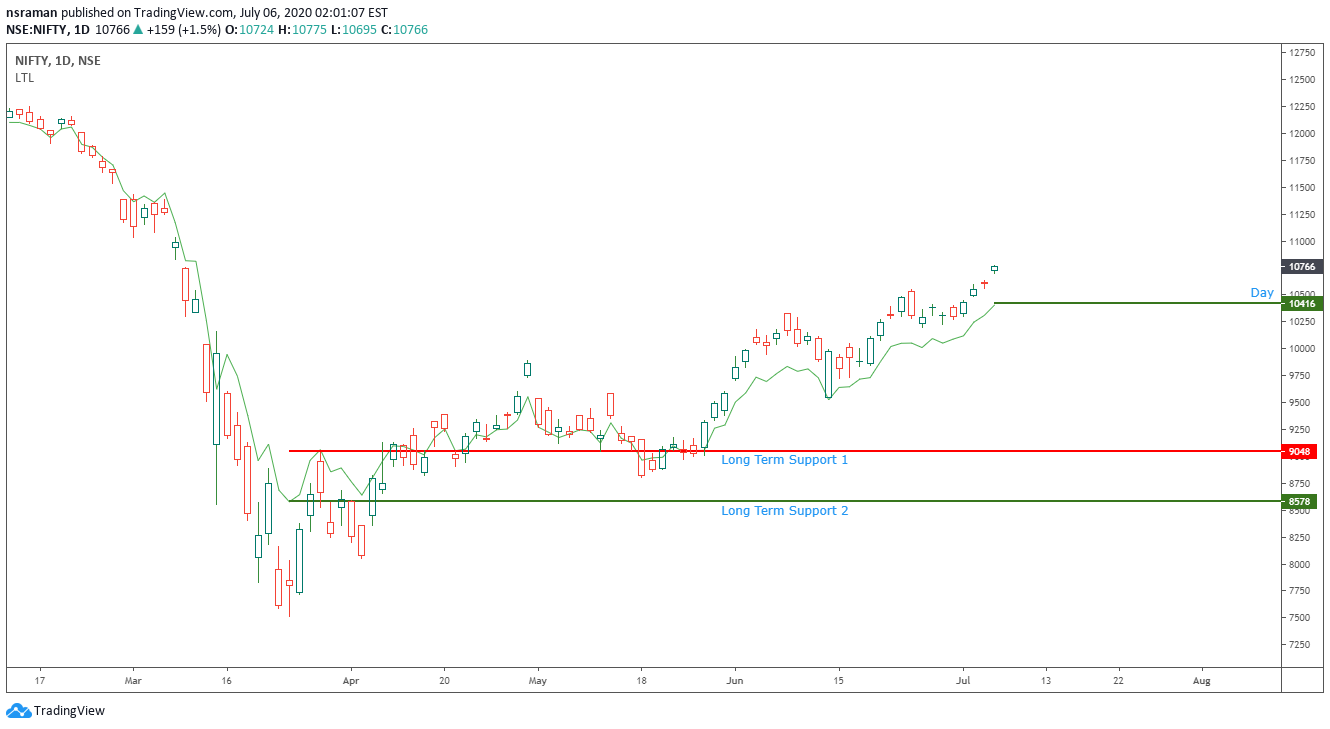
I am surprised at the resilience shown my our markets after the low of 7511. I think it is slowly inching up reflecting the confidence of the players. My system says I am UP as long as I am above 8905. Please also note the Red Trend Line. 8905 is based on a system rule. Only one view and only one level to watch.Quite interesting times.
@hitesh2710 Hiteshbhai, not able to understand the above sentence (which was also there in your first post on 6th Apr). Is it the case that wave 5 is, theoretically at least, signals or works as a downmove? Rgds.
First of all a disclaimer. I know only the basics of EW and my knowledge is rudimentary.
Basically in a directional move, also called an impulse wave, there is a sub division into 5 waves, with waves 1, 3 and 5 in the direction of the trend while waves 2 and 4 are counter trend.
Out of the moves 1,3,5, usually one of them is extended and that is usually wave 3. If waves 1 and 3 are normal
5th wave is extended. In rare circumstances, wave 1 can be extended.
Extended means it is largest in length and duration.
I understand that this thread for using Elliot Wave in current scenario. here is article on ET for ack that bottom not yet found - by Milan Vaishav (CMT MSTA)
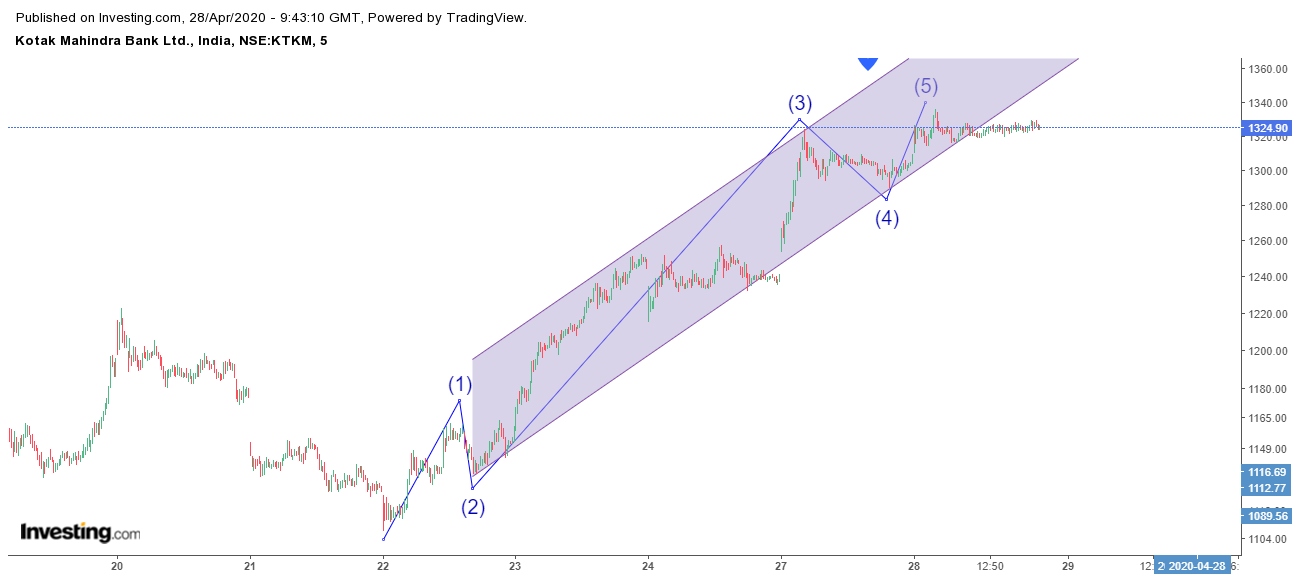
Attaching a recent 5 wave structure made by kotak wave during last 3-4 sessions which could have allowed a trade for 9-10 percent easily…obviously one need to check for validation by volume actions also… for educational purspose as similar wave structure also occur on linger timeframes…
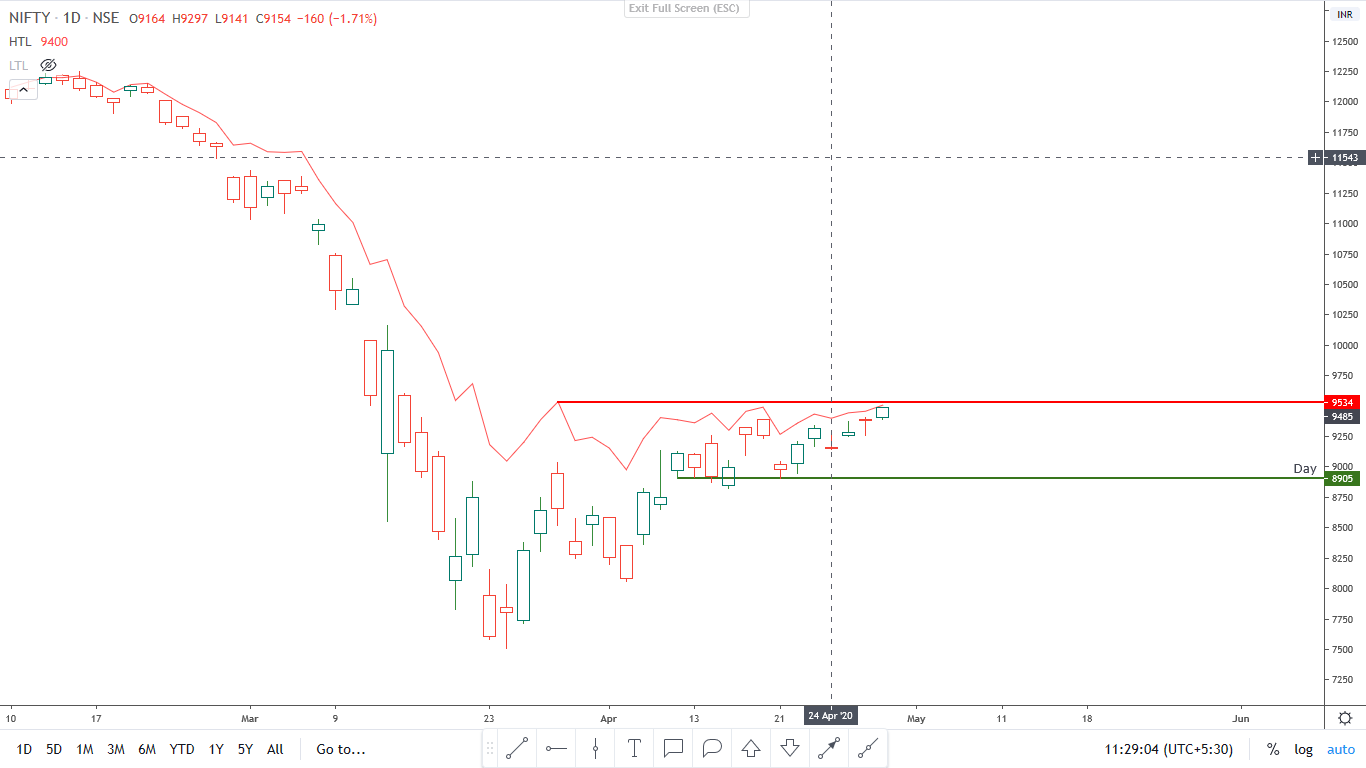
Latest Nifty Chart Expecting a pullback from the area of 9540. Hope 8905 holds. Only 2 levels I watch now. Bulls efforts commendable from 7500 to 9500.
@hitesh2710
Hiteshbahi, the market is in uptrend since last few days. Do you think the upmove of “B” has already begun? Any targets in mind for this upmove? Rgds.
As mentioned before, I thought that the current upmove in nifty was a wave 4 within a larger A of the downmove that began from the all time high. Wave 3 down took 24 trading sessions and Wave 4 completed 24 days on thursday. And within those 24 days, nifty was able to retrace only 50% of the preceding downmove. For resumption of any strong upmove the nifty needs faster retracement of the last downmove which has not been the case currently.
On the other side, there was a falling wedge like pattern on nifty and Thursday showed a gapped up move above the confines of the wedge as shown in the chart. The gap formed on Thursday becomes crucial as a support going ahead now. But if we were to go by reports of SGX which was down 500-600 points down as of yesterday night, we might gap down below the preceding gap and cause an island gap reversal pattern on nifty on Monday. (need to see exactly what happens on Monday though.)
If markets do start correcting from Thursday’s top, we might see resumption of a final wave 5 of larger A. This wave can target levels below low of wave 3 somewhere close to 7500. Sometimes this downmove can be a truncated wave in which case it can finish above the previous low. I remain in a wait and watch mode.
Business wise any businessman I talk to has nothing encouraging to say about the business scenario. So on ground things seem difficult for most businesses.
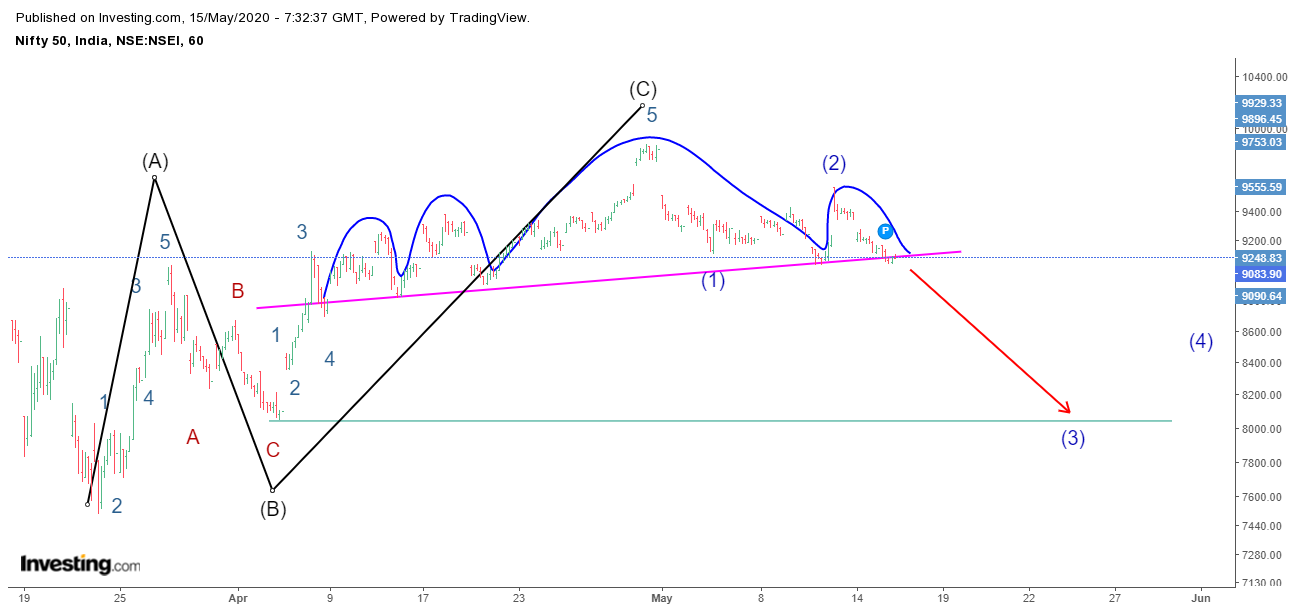
In consonance with Hiteshji, this is one of the possible counts which looks probable to me…the corrective wave has got over and motive wave downwards may have started…however same will be confirmed once intermediate bottom at 8562 will be breached…along with this a head and shoulder pattern is also visible which gives a target near 8000…
After the upmove, alternate wave count has been confirmed…Subwave A and Subwave b of ABC correction are over and subwave C has commenced…likely target is C=A which will come in the gap area just above 11000…
If I understood correctly from your analysis, the tradable rally “B” began on 20/27th of May. can you please share your analysis, if you are still following this?.
In my view you will never make money by trying to predict markets. I am attaching the latest Chart. Please see for yourself how the system has performed. Ultimately, a tool has to help us in making money from the markets. If that is not possible from the tool, it is useless and has become redundant in the current times we can conclude.
My dear, i do respect your knowledge and tools but with my temperament and mindset which is unique to me, i feel great comfort with EW…after three years in market, for the first time i booked 12 percent return in April and booked 7 percent return in last 10 days…for YTD I am in green while nifty is 20 percent down…because I cashed out completely at higher levels and re entered below 8500…it may be purely a matter of luck… I am still in learning process open to all methods till I am able to devise a method for self…
Infact combining EW with fundamental analysis and other TA tools give out great perspective…I entered metal stocks last month as USD started falling and metals were already under long consolidation…and metals are doing well this month… similar case with sugar stocks…long term EW counts are really helpful…
infact I recently attended online courses on candlesticks and momentum investing and I found all of them equally useful…now your tool is a paid one but there are no instructions on its concept of application otherwise I would have surely attended the online course as I do respect it’s efficiency…
After learning EW, my next aim is Gann theory and financial astrology which is again seen as mystical by majority…but as a passionate astrologer i do see that price cycles and time cycles work…something which is useless for someone may be useful for other depending upon individual talents…Just because human can not see more than 7 colours, it does not mean that there are not 8-10 colours in a rainbow…
It’s my humble request to be open to all the diversity which exists here and acknowledge own limitations to understand everything…
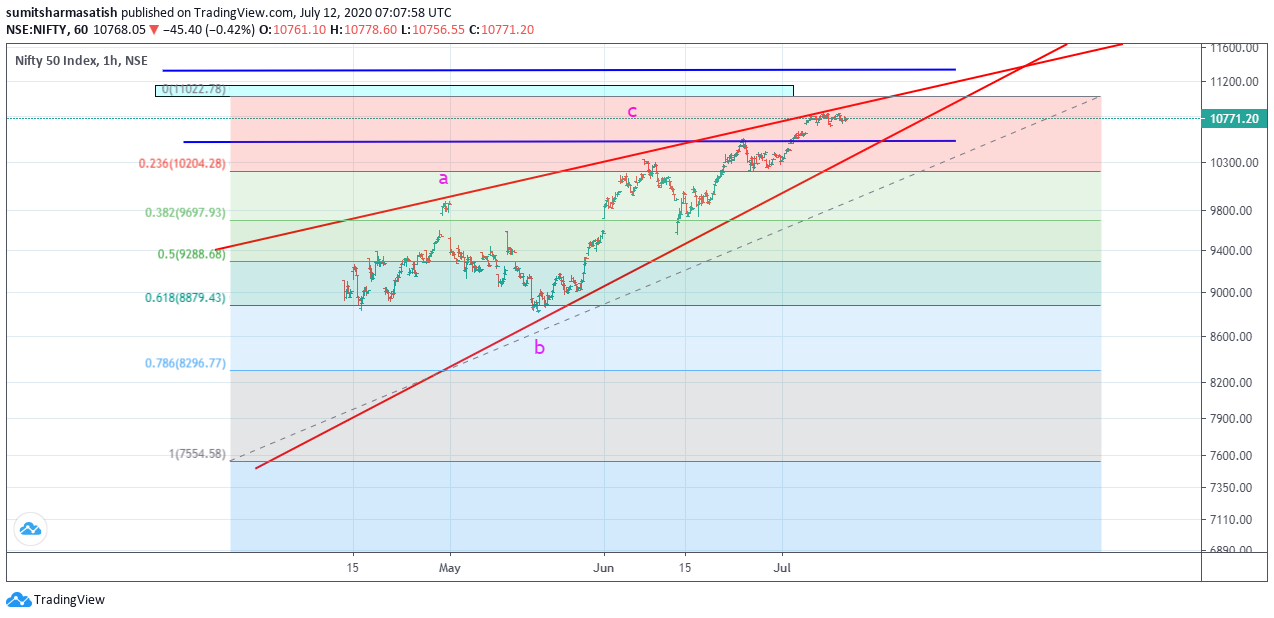
Sometimes FIBO comes handy in taking a broader view I calculate FIBO based on my lines not based on the usual calculation method High/Low Expect reversal from here One can also apply mean reversion theory View negated if #Nifty sustains above 10460
overall a leading diagonal seems to be in progress as shown below. It means that trend has changed for surely…however a wave 2 should retrace this wave 1 from levels of 11000 towards 10000 at 38 percent retracement or 9000 levels at further retracement levels…