I think you are looking at it the wrong way. Let me explain why momentum works rather than investing in a small-cap or a micro-cap index, etc. Please remember that this is my understanding of why momentum works, and I can be very wrong as well, so take it with a grain of salt.
In a bull market, an all-cap universe momentum strategy will match or underperform the small-cap or microcap index. It’s virtually impossible to beat the index in a bull market. Even if you beat it with the momentum strategy, it would be by a small margin
When the tide turns, and we go into a bear, or a sideways market, the small-cap and/or microcap indices will go into a huge drawdown. Momentum portfolios will shift to either mid-caps or large-caps, depending on where the best performance is. So you will lose less than the other small/micro-cap indices might have lost.
Momentum works because it switches you into performing sectors and marketcaps. It does it for you because it only sees the price. This doesn’t mean that it won’t give you drawdowns. You will get hit by the initial fall, but eventually, your system will shift and give you better performance than the index. Please read the words carefully - better performance than the index, which means if the index is still falling, say 20-30% more, you may fall only 15%
Over multiple bull and bear cycles, momentum is highly likely to outperform most of the indices. Again, consider this a high probability and not an assured thing. Further, if the country itself goes into a sideways market like what China or Hong Kong did over the past decade or so, then don’t expect momentum to give super returns as well. It might give a little bit of alpha above index returns, for sure, but don’t expect it to make a ton of money in prolonged bear or sideways markets.
however, am not sure i understood your point - am only talking about a smallcap momentum portfolio - say 25 stocks out of the nifty 250 small cap index - will this portfolio not be able to beat the smallcap 250 index in a bull market as well?
In the broader term yes.If you wish to follow momentum and reap rewards, I highly recommend you to read the research paper by Jagadish and Titman. A well-constructed small-cap momentum portfolio can indeed outperform the Nifty 250 Smallcap Index in a bull market, leveraging the natural momentum effect and the higher growth potential of small-cap stocks. It is crucial to manage this portfolio with disciplined rebalancing and a keen eye on transaction costs to ensure that the benefits of momentum investing are fully realized.For further reading and to explore empirical studies, you might consider sources like “Returns to Buying Winners and Selling Losers: Implications for Stock Market Efficiency” by Jegadeesh and Titman (1993) and “Value and Momentum Everywhere” by Asness, Moskowitz, and Pedersen (2013).
Hello Sujata,
Over a period of time and numerous iterations, I have identified screeners that help to identify a potential list of stocks for Momentum Trading. Post selection, I filter stocks based on my own trading setup (technical charts) to eliminate stocks from my initial potential list.
The 25-stock portfolio might simply match the small-cap index performance or it will beat it slightly in the bull market. The real outperformance will come in bear markets when our portfolio will go to cash or sit with performers. Typically over multiple cycles expect 2x the performance of index and a slightly lesser drawdown in a momentum portfolio. It is not a holy grail strategy. From 2020-2024 we haven’t seen a proper bear market so it’s all rosy right now
Hello all, want to draw some light on the important factor of momentum strategy widely used and accepted:
The Sharpe ratio is a measure used in momentum strategy to evaluate the risk-adjusted return of an investment or portfolio. It compares the excess return of the investment (return over the risk-free rate) to its risk, represented by the standard deviation of the investment’s returns.
Formula
Sharpe Ratio= R_a - R_f /sigma_a
where:
R_a is the average return of the investment.
R_f is the risk-free rate (often the return on government bonds).
sigma_a is the standard deviation of the investment’s returns.
Interpretation
Higher Sharpe Ratio: Indicates better risk-adjusted returns. The investment is providing more return per unit of risk.
Lower Sharpe Ratio: Indicates poorer risk-adjusted returns. The investment may be taking on too much risk for the return it provides.
Use
The Sharpe ratio is widely used by investors and portfolio managers to compare the performance of different investments or portfolios, especially when considering both return and risk.
Misconceptions about the Sharpe Ratio
Higher is Always Better: Many believe that a higher Sharpe ratio always indicates a better investment, but it doesn’t account for the underlying risk or the source of returns.
Uniform Across Timeframes: It’s often assumed the Sharpe ratio is consistent across different timeframes, which is not true. Short-term Sharpe ratios can be misleading compared to long-term ones.
Ignores Non-Normal Distributions: The Sharpe ratio assumes returns are normally distributed, which is often not the case, especially for assets with skewed or kurtotic return distributions.
Risk-Free Rate Stability: The calculation assumes a stable risk-free rate, but this can fluctuate, affecting the ratio.
Perfect Measure of Risk-Adjusted Return: While useful, the Sharpe ratio is not a comprehensive measure of risk-adjusted return. It doesn’t account for other types of risk like liquidity or credit risk.
Pros of the Sharpe Ratio
Simplicity: Easy to calculate and understand, making it accessible for most investors.
Comparative Tool: Useful for comparing the risk-adjusted returns of different investments or portfolios.
Incorporates Risk and Return: Combines both the return and volatility, providing a balanced view of performance.
Widely Used: Commonly accepted and used by investment professionals, facilitating communication and comparison.
Focus on Excess Return: Highlights returns in excess of the risk-free rate, emphasizing the added value of an investment.
Cons of the Sharpe Ratio
Assumes Normal Distribution: It may not accurately reflect the risk if the return distribution is not normal.
Volatility as Risk Proxy: Uses standard deviation as a measure of risk, which may not capture all forms of risk.
Ignores Drawdowns: Doesn’t account for the severity or duration of drawdowns, which can be critical for investors.
Risk-Free Rate Fluctuations: Sensitivity to changes in the risk-free rate can impact the ratio’s stability.
Single-Period Measure: Typically calculated over a single period, it may not reflect the performance consistency over different time periods.
Understanding these aspects can help in using the Sharpe ratio more effectively and avoiding potential pitfalls in investment analysis.
Quick question, when we backtest a strategy should we do this on a single stock or do that on multiple stocks or on all stocks which meet this criterion for strategy
You can obtain historical lists of the top 200 stocks and symbols from NSE, BSE, Yahoo Finance, Bloomberg, Reuters, Alpha Vantage, IEX Cloud, Quandl, Investing.com, TradingView, and Morningstar.
The NSE Bhavcopy contains daily information about all securities traded on the NSE, including the list of stocks and their trading data. You can use the Bhavcopy to compile historical lists of the top 200 stocks. Here’s how you can do it:
Navigate to “Equity” → “Historical Data” → “Bhavcopy.”
Select the date range you are interested in.
Download the Bhavcopy files for the desired dates.
Compiling Historical Lists:
Extract Data: Extract the downloaded Bhavcopy files (usually in CSV format).
Filter Top 200 Stocks: Use criteria like trading volume, market capitalization, or other metrics to filter the top 200 stocks for each date.
Automate with Python: Write a Python script to automate the extraction and filtering process.
Example Python Script to Process Bhavcopy:
import pandas as pd
import glob

# Path to the folder containing the downloaded Bhavcopy files
path = "path/to/bhavcopy/files"

# Load all CSV files
all_files = glob.glob(path + "/*.csv")

# Initialize an empty DataFrame to store top 200 stocks
top_200_stocks = pd.DataFrame()

# Process each Bhavcopy file
for file in all_files:
    df = pd.read_csv(file)
    df['Date'] = pd.to_datetime(file.split('/')[-1].split('.')[0], format='%d%m%Y')

    # Sort by desired metric, e.g., market capitalization
    df = df.sort_values(by='MARKET_CAPITALIZATION', ascending=False)

    # Select top 200 stocks
    top_200 = df.head(200)

    # Append to the main DataFrame
    top_200_stocks = pd.concat([top_200_stocks, top_200])

# Save the result to a CSV file
top_200_stocks.to_csv('top_200_stocks_historical.csv', index=False)
Key Points:
Regular Downloads: Ensure you download Bhavcopy files regularly to maintain an updated historical dataset.
Filter Criteria: Choose consistent criteria for filtering top stocks, like market cap or trading volume.
By using the NSE Bhavcopy and processing it with a script, you can compile a historical list of the top 200 stocks over the desired period.
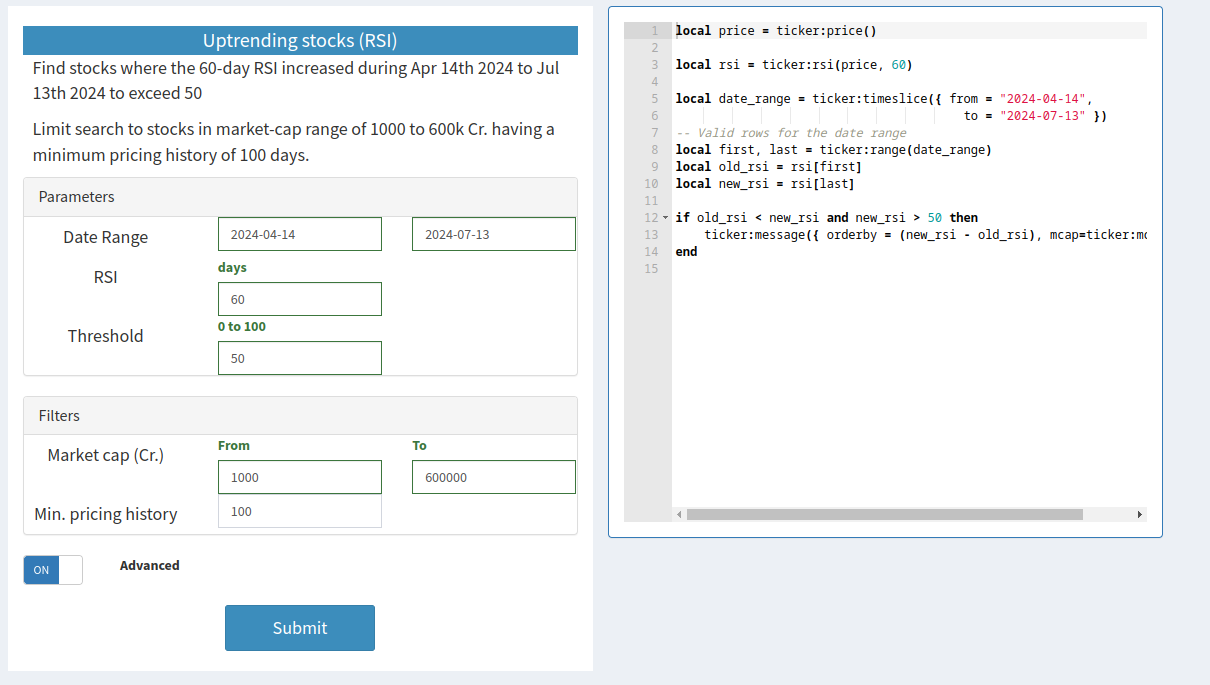
You could consider using Bajaar.me screeners. Clicking on the advanced tab shows up an editor and you can write Lua scripts. The scripts are run on each stock from BSE and you can identify stocks matching any criteria and rank them with an orderby . Here is an example below
All prices are adjusted for bonus/splits and obtained from BSE (updated weekly) - over 20 years of data. I tried working with bhavcopy data before but got frustrated with adjusting for splits/bonuses with some random hacks.
Dear Value Pickrs,
What are your thoughts on how integrating momentum strategies with technical analysis affects the performance and risk management of a momentum strategy? Sharing our insights on this can not only deepen our understanding but also reinforce our confidence in the systems we follow, whether they are value, growth, or momentum-based.
TA is also called subjective, as opposed to quantitative parameters, so the results can become discretionary. Although, it gives a chance to look at the movement of price, which helps.
I think, following a pure quantitative approach and not tinkering cannot be compared to quantitative+TA method. The returns can be very different. May be, when the allocation is substantial and one wants to have a concentrated PF, not leaving the outcome, entirely to a set of rules, does sound logical. Risk management too can be based on TA, instead of rules.
Discretion changes things, and results can be compared after exiting the positions, and whatever are our observations and inferences, the same scenarios may not repeat again.
Didnt quite understand. Momentum strategy in itself is indirectly an outcome of technical analysis although you are not explicitly looking at charts ( assuming the strategy is about picking the high ranked stocks ).
But another variant of a momentum strategy could be to look at charts and take a discretionary call on which stock is better placed on the momentum track.
So its really about picking a ranking approach ( non-discretionary ) vs a charts approach ( discretionary )…both have their merits ( hard to objectively compare or evaluate ).