
More than 58% of NSDL consolidated revenue comes from there payment bank business but it contribute less than 7% in total consolidated profit.
In there banking services segment they show revenue on gross basis (which means transaction value is shown as revenue, any transaction happens through there payment bank they show them as revenue) but in profit they deduct all the expense to earn that revenue. So, net profit is the better measure for there banking service business.
And because of that NSDL show higher revenue on consolidated basis but on standalone basis CDSL have higher revenue as compare to NSDL.
9 Likes
I recently invested in CDSL for a very long term (10-15 years at least given regulatory changes doesn’t drastically impact the unit-economics). I read this entire thread to learn how the business evolved and I saw that mostly all growth is linked with the core depository business even when optionalities like KYC/Data and other things existed during all these years. I have the following observation and some questions. It would be really helpful if other can comment on them to correct where I am misunderstanding about this business.
-
CDSL has been invested in real-estate / office space for last 2-3 years. For a 400 employees company, building addition worth ~240 crores ( building fixed asset block went from 67 crore in FY24 to 317 crores in FY 26). This seems to be the case where they are sitting on unused cash (tied in investments) that they are unable to utilize even after incremental tech capex (which I am okay with) so they are investing in trophy offices. Wouldn’t it be better if they increase dividend payout if the business doesn’t have much avenues to invest.
-
There is a pattern where CDSL builds the infrastructure and capability for non-depository business lines like academic records in late 2010s which went to Digi-locker and now investing decently into KYC arm. But SEBI slashed the KYC charges significantly. Now, I know CDSL mgmt can’t do much, it’s a regulated business. But the pattern tells a story that the main function of CDSL as the regualtors see is investor inclusion and financialization catalyst, shareholder value comes secondary to that. This is not necessarily bad as the larger ecosystem will ultimately benefit CDSL but at this moment it’s going to be mature compounder, rather than a growth stock as it has been last 5-7 years.
-
The overall demat accounts are already at 23-24 crores. How much more accounts can be realistically added from here onwards. The next leg of growth in my opinion will come from account stickiness and folio/account increase. Folio counts are not available as a metric anywhere, CDSL just started revealing it since Q1FY26. So given folio counts are announced after the year is over, demat additions are the best leading proxy. Can anybody tell me if there are ways to guess how the folio count is progressing quarter on quarter, i think that would be a much better leading indicator of annuity income.
-
I was tracking the “nos. of trades executed in equity segment” on NSE and BSE portal. And these trades are more for Q1FY27 than Q4FY26. Given CDSL earns ~3.5 per debit txn, this can be a leading indicator for their txn income. Am I right to assume this or am i missing or misreading something?
2 Likes
- They invest in there office space and they didn’t have that much opportunity to invest there money . Currently they have 83 crore of cash equivalents and 1,487 crores of investment. It would be better if they increase there dividend.
- KYC fetch rate reduce by 20% from 35 to 28 from 1st April onwards. And creation charges also reduced by 75% from 20 to 5 for all KRA player. CDSL main aim is not profit maximization but financial inclusion. They didn’t able to earn unlimited profit. Whenever regulator thinks that they are earning more regulator make change to pass on benefit to retail investor and limit there profit. But they have great scope of growth in upcoming future. If regulator didn’t take any strict action against depository then they are able to grow there profit with steady rate and time to time (in boom market) get the benefit of leverage.
- I think 2014 or 15 is the last time when they increase there charges and from that they not increase there charges but reduce them.
- Folio count is good indicator to estimate annual issuer charges but management give that number only in the Q1. So, you can use BO account as proxy.
- I didn’t check the number of trades executed in equity segment. Yes, they charge 3.5 per debit transaction. But keep in mind that they charge for only those transaction in which share goes in demat account, no amount is charge for F&O trading and intraday .
2 Likes
Thanks for replying.
For point 5: the no. of trades data is split between 2 filters “capital markets” and “f&O” so I am assuming the capital markets data is purely equity data. See the screenshot, you can also see the velocity improving month on month.
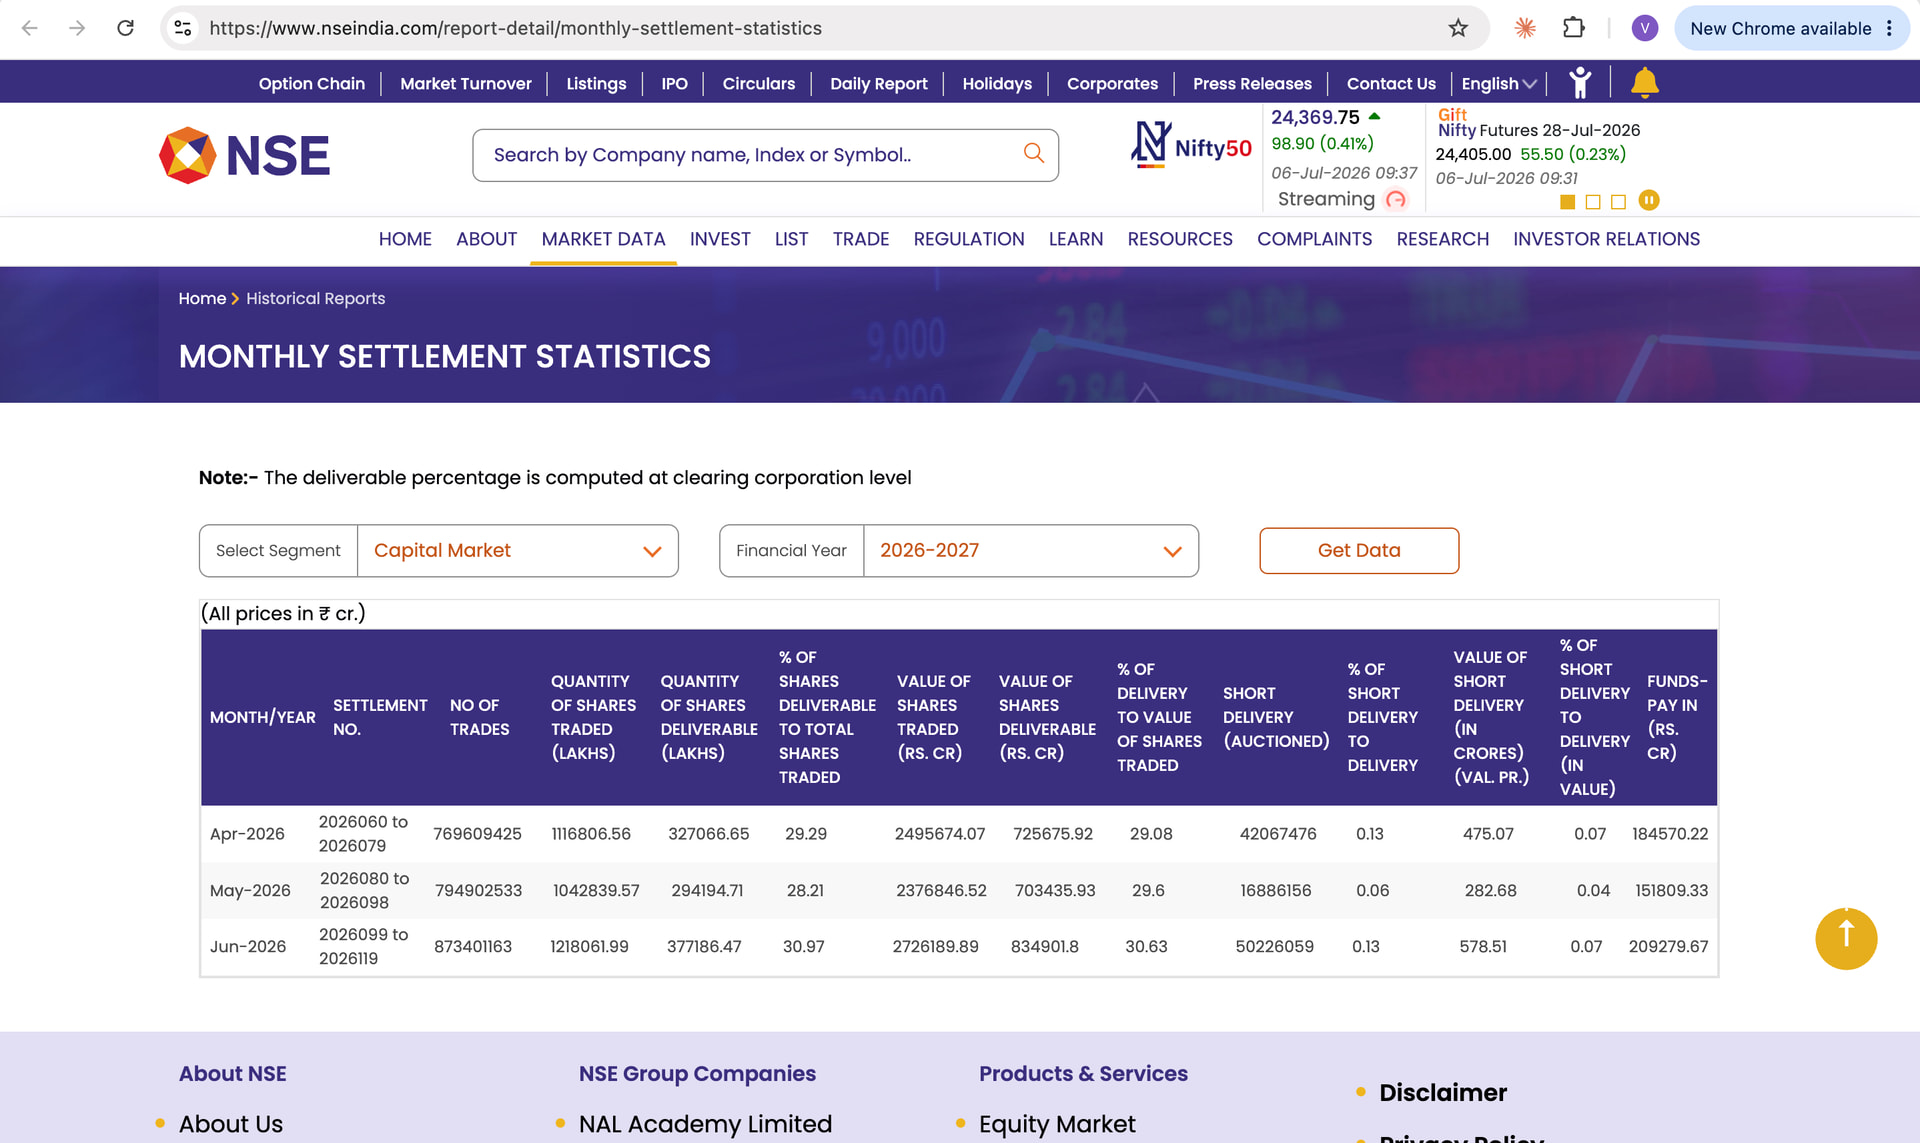
For point 4: I might be overthinking this but do you think no. of public shareholders in a select high volume stocks could be a proxy for folio count directional approximation?? My concern with BO account data now is that it’s bound to slow-down but that slow-down won’t necessarily mean the annuity income will suffer. My hypothesis is that all those increased BO accounts have now spent some time in the market and from my own experience you either get churned out after initial enthusiasm or you become a sticky investor taking more direct stock positions. Would love your views on this.
2 Likes
Yes the data is of only capital market and CDSL earn money from that.
No. of public shareholder is also a good proxy (nice idea), Yes, slow down in BO account growth doesn’t mean slow down in annuity income (annual issuer charges).
You idea of no. of public shareholder is great and it give me new perspective.
2 Likes
The sad part is that I couldn’t find any way to get that data “no. of public shareholders”. It is available for an individual company level but we will need it at the entire exchange level. At least top 500 stocks will also give a directional sense.
Please update if you could get a way to get this data. I will try looking into if I could automate some scraping cron to collate data for top cos.
You can check the MGT-7 form for shareholder information. It is available on the MCA website.

MGT-7 data on MCA is usually filed once a year. At least that’s what I found in a quick search. So this would be lagging data. Also, it’s at an individual company level. That data is already available on exchange websites on a quarterly shareholder data as SEBI requires it for each company.
The real problem is collating this data for multiple companies to get a directional sense. But as I said before, this would be an approximation if we don’t include all the listed universes. And the task seems huge. Somebody with data scraping expertise might help.
Also, good to see both “no. of trades” and “no of new demat accounts” are at a 4-month high in June. Ideally, this should result in a better quarter for CDSL than the previous quarter for core depository streams.