
I do not want to claim an early win on this … SBI is down 10 pts today. But this position has to be held until you see shorts been built up and Longs are reducing… Let us see where it will get us out of this position. I have shorted 2 lots of SBI futures today morning around 341 will stop loss of 348
So u do it manually or you’ve an algo doing it for you?
No I pull it via scripts via Python (Module: nsepy) and build the graph
1 Like
some cautionary observations…
the cypher in sbi has already been mentioned by @maven26
icici bank
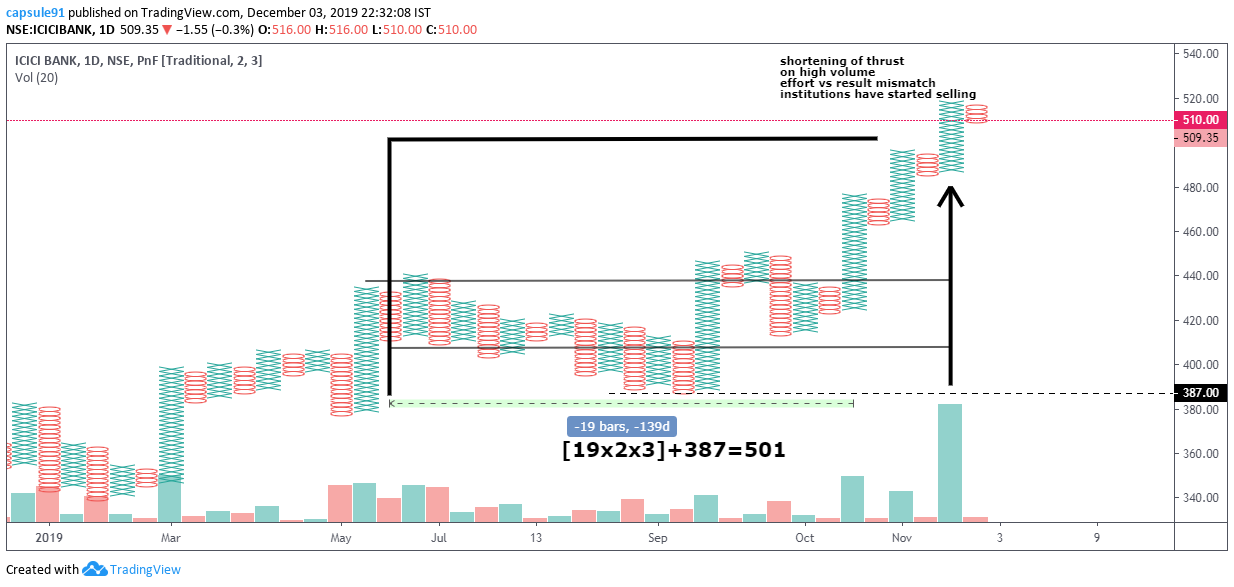
it has been under midyear accumulation, the point and figure target has been achieved and rotation point reached, and as expected, shortening of upward thrust noted at the rotation target …
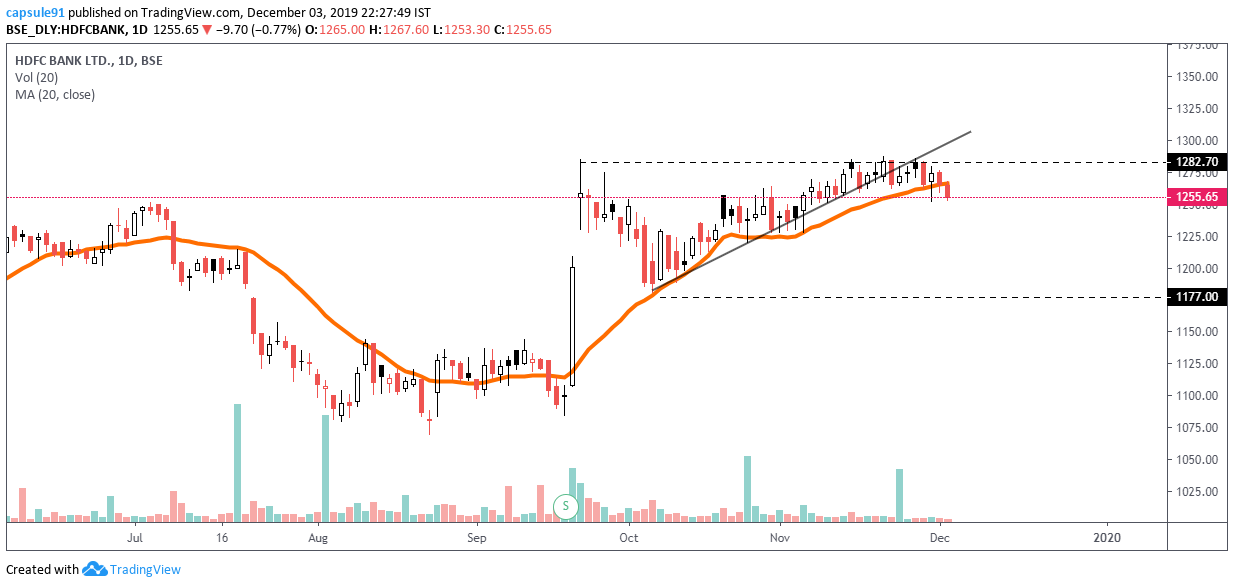
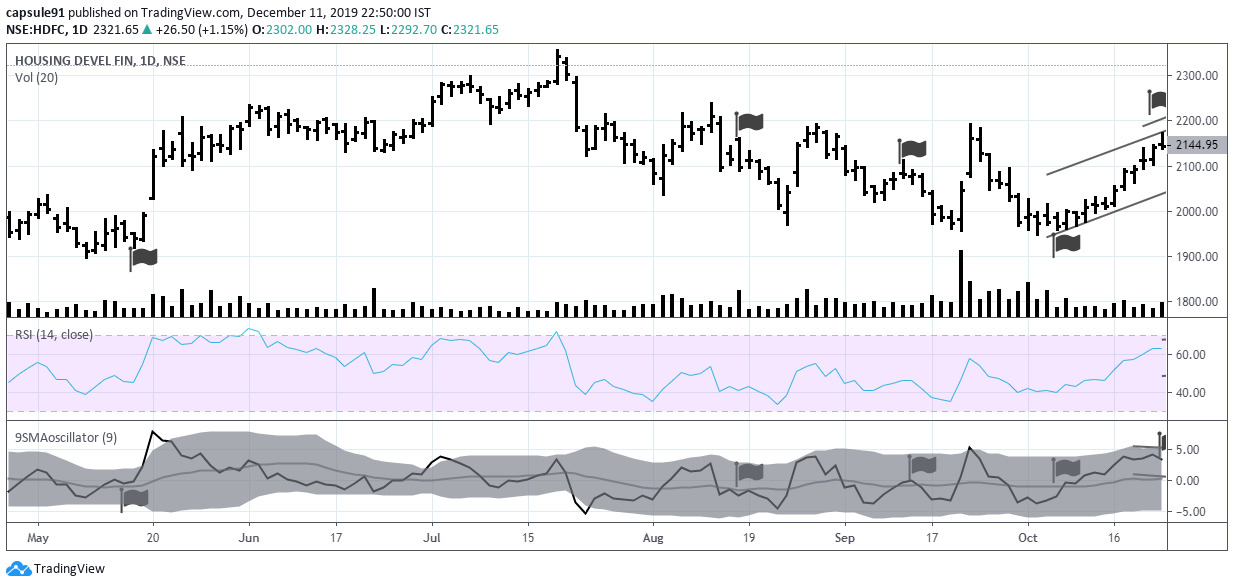
not much to say regarding hdfc bank, it has been a pathetic show post tax relaxation news, a delight for traders though regarding all that volatility it generated, now its time for retracement, today the closure below the 20dma after 3 months is not to be ignored
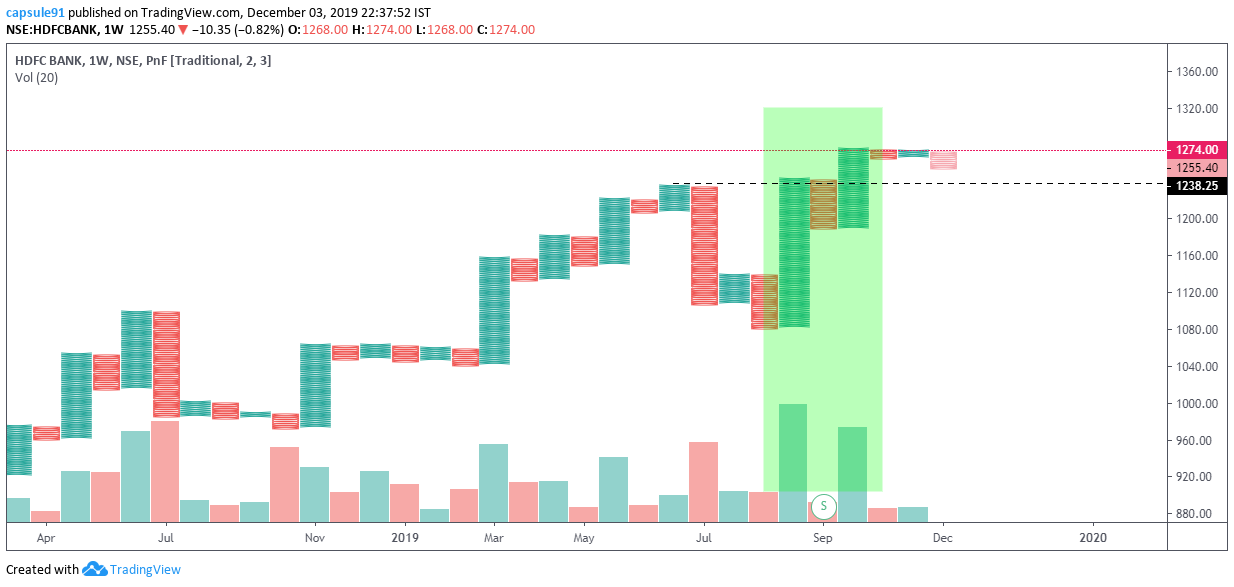
on the weekly point and figure chart it is very evident the entire move took on record volumes since last 2 years, what is the result, the price has barely upthrusted above the previous high… why this effort vs reward mismatch? institutional selling??
only one or two brokerage house has a sell call on this scrip, i am very skeptical when this disparity happens…
SBI, ICICI and HDFC Bank, this trio has enough ability to make bank nifty chart look ugly…
S&p500, gapped down the 20dma today…
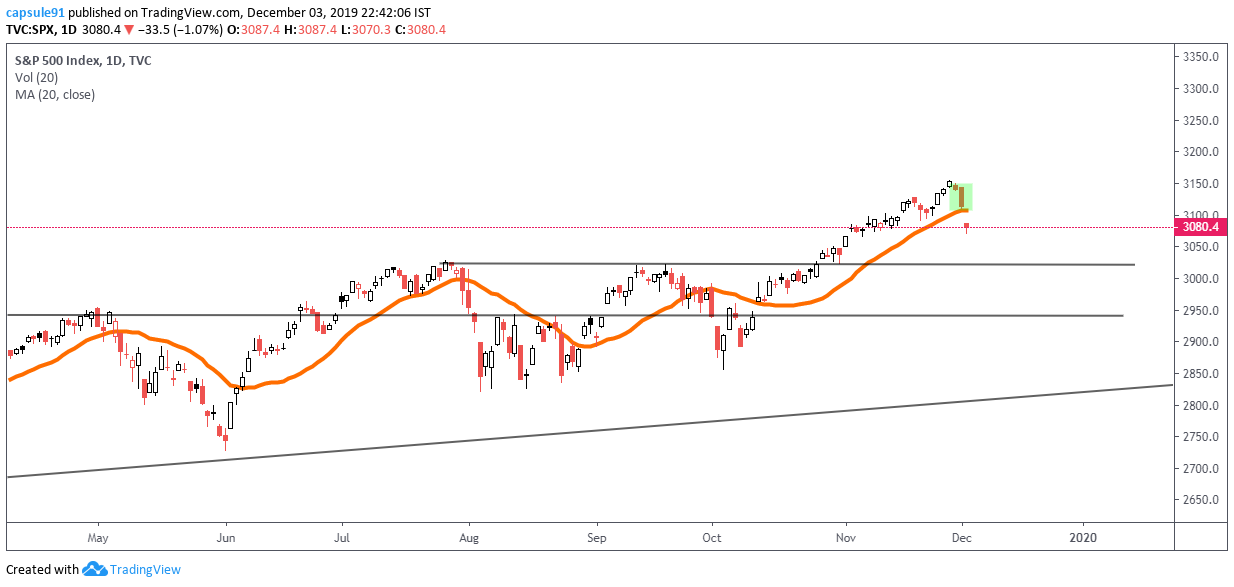
their great president has mentioned ,holding china trade deal till elections are over
hence the reaction
yesterday’s candle was “the bar” which defines the end of this 2 month rally, the spread of the candle was the maximum in this trend, this is the opening candle of an automatic reaction after buying climax of this rally…
as expected,
gold looking good , continuing the base formation
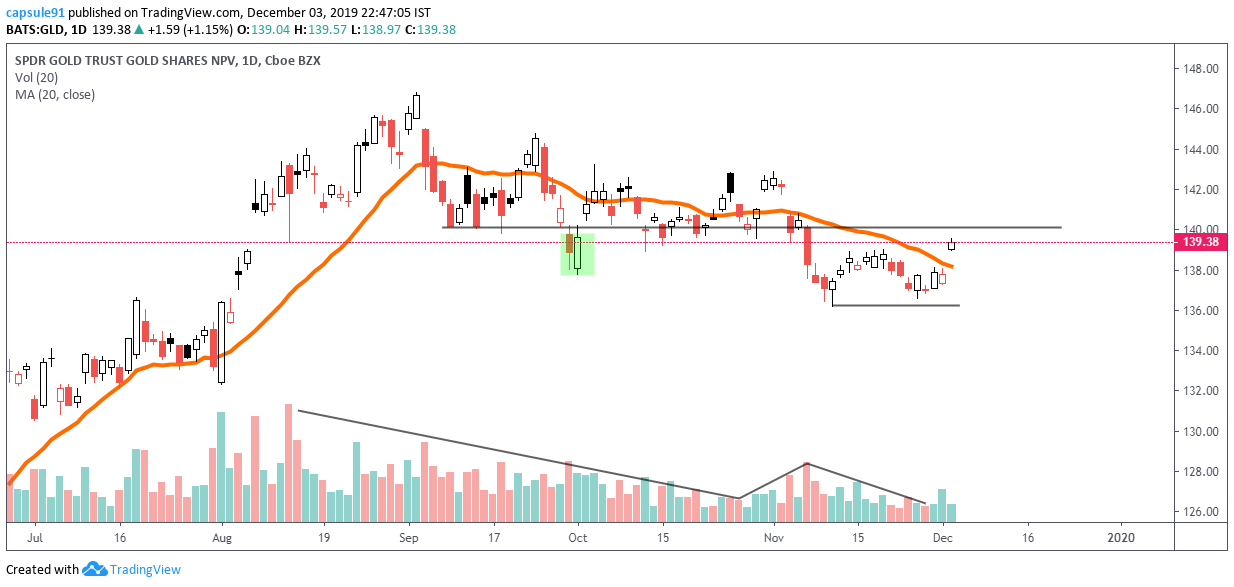
this is a leading etf in gold, the operators drew out as much supply they could and the JAK across 20dma is a positive response of the test of supply
in indian markets
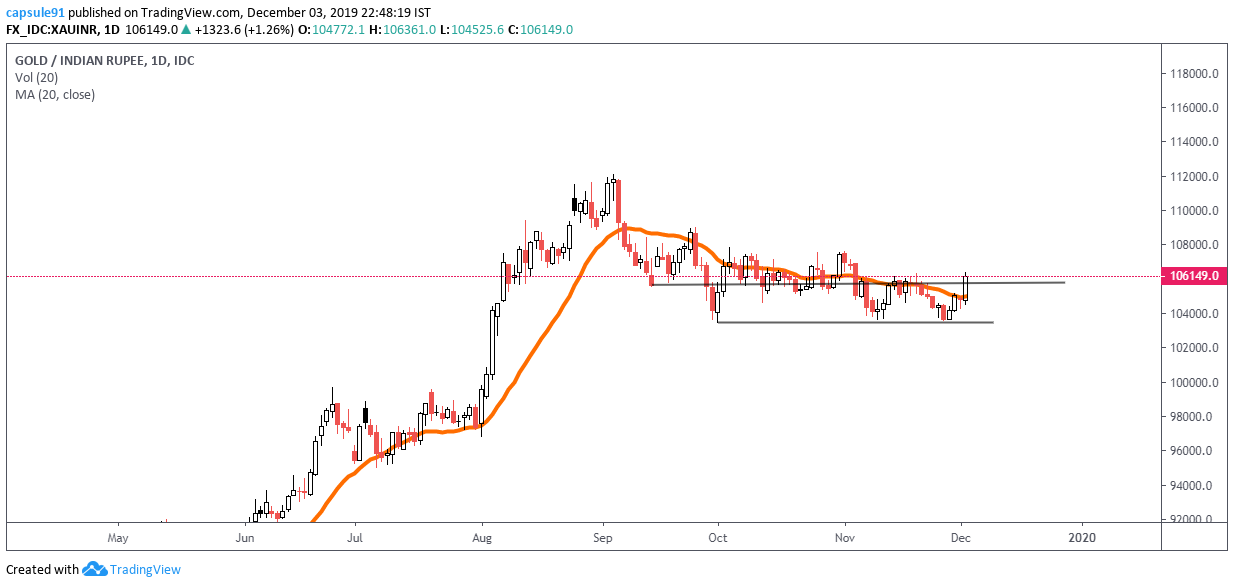
the relative strength was better due to a weak rupee, price failed to produce a new low, and the same level has been tested 3 times all with positive reaction from the price action
i predicted this US china trade deal postponement during November end based on the yuan chart, anyone interested can check my post on trading view on this ,
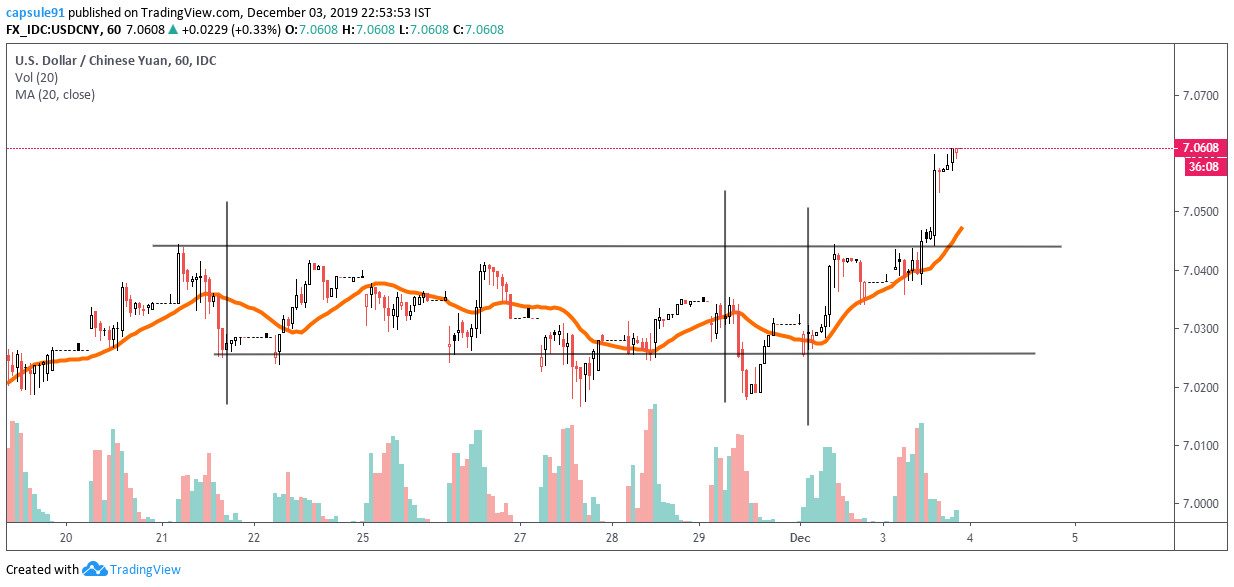
the chart screamed of reaccumualtion, and institutions very well knew about this and were building longs …
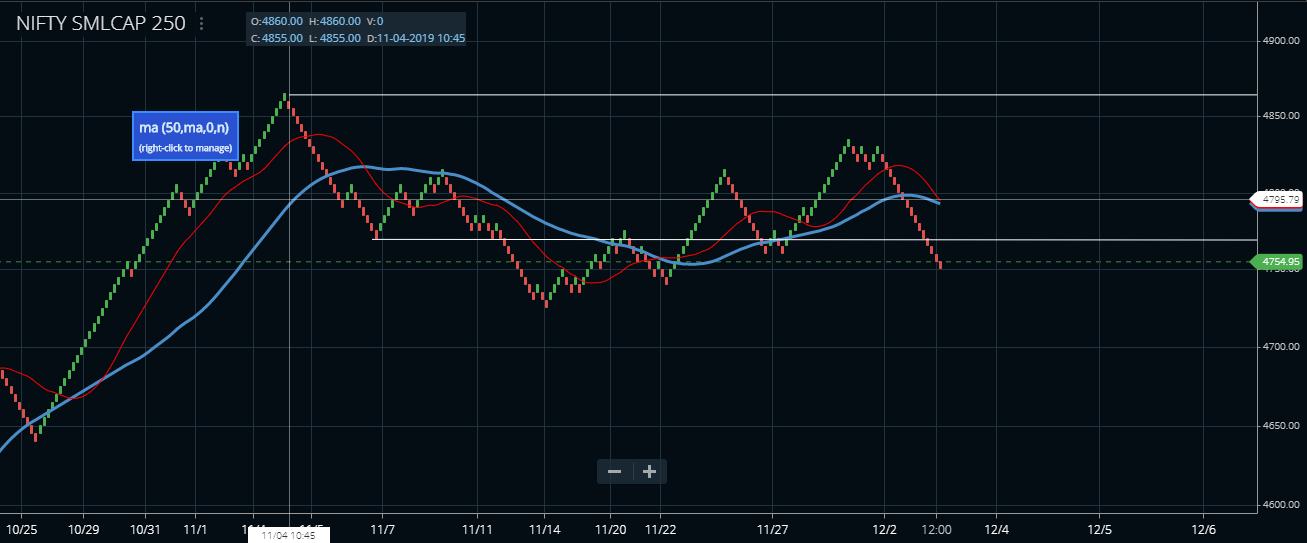
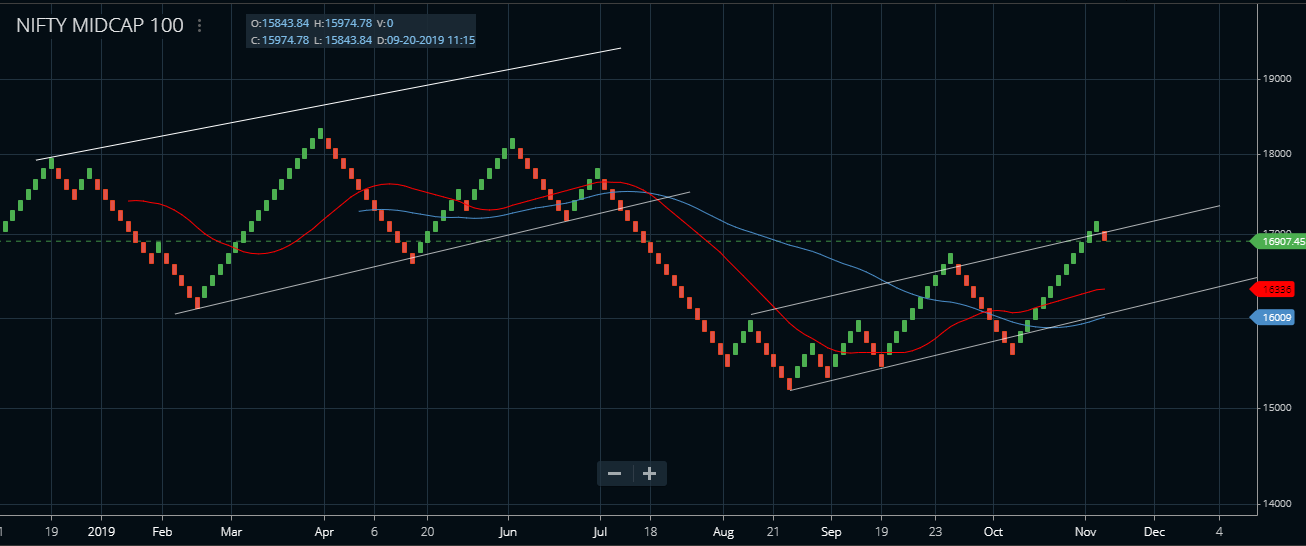
the small cap chart is suggestive of accumulation ongoing
the midcap chart is a typical cycle of distribution with upward movement contraction in beginning of 2019 , and upward movement expansion in late 2019 suggestive of accumulation
disclaimer…as mentioned earlier, i am sitting on cash now, sold most of my 2018 portfolio this is run, while maintaining positions built this year
Nifty has not broken the 20dma yet, calling nifty bearish would not have enough technical evidence as of now , but i will maintain my bearish stance in the short term unless 11700 starts acting as a support and a base forms there… in the longer run, if any meaningful correction does take place , would be good opportunity for adding positions.Although the weekly chart of nifty is not showing any trend, there is no evidence of large scale distribution,expect local ones, as of now.
7 Likes
although the first week of november candle had a lot of climax built into it, this chart should look interesting going forward
a breakout followed by testing of higher 200 would be the desirable backingup action to look for
disclaimer… no positions
@pkk123
i was bullish on the base formation of yesbank, but have changed stance since
and to address your specific query, no, i do not think this is an inverse head and shoulder pattern…
the last upmove in the daily chart was converted into an upthrust, on massive supply…
which continues till now
december 5th formed a tiny spread bar, which was the only bar without much supply in the downtrend, that too was a retest of broken 20dma and the demand is pathetic as of now
in inverse head and shoulder, one does not expect this kind of action coming in at the extreme of right shoulder
this was actually a redistribution which i had mistaken…
expecting some sideways action and markdown
yes bank is expected to test previous lows, which should act as a support, if that fails to hold, we can expect more downside, but that for a later scenario
disclaimer… got stopped out at 20dema with minor profits
5 Likes
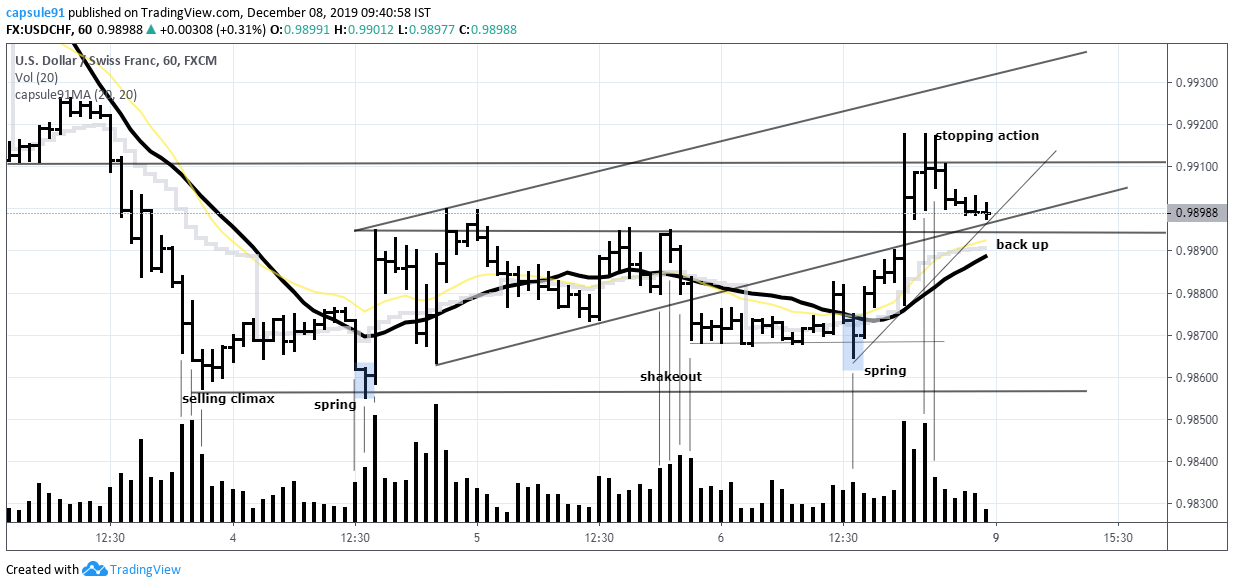
2 very good examples of spring to train the eye on
An excerpt from david weis’ book trades about to happen on the chapter of spring
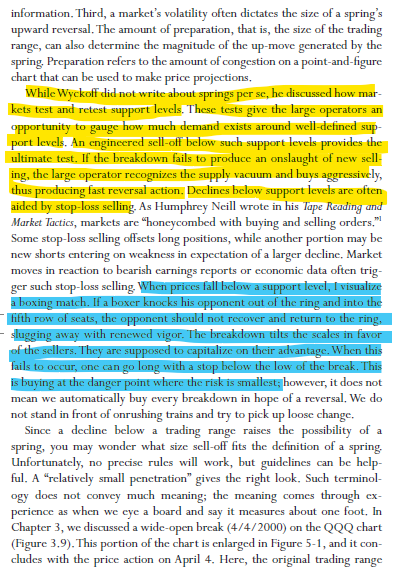
1 Like
Had posted my 1st technofunda post on this thread on 11th september. The idea of this 2nd post is to analyze the performance of this post. I believe it would help to quantitatively measure various strategies to conclude if it is working or not only we can track type 1 and type 2 errors and measure overall return success as ultimately everything boils down to returns. Here is 3 month performance. Have taken basic assumptions:
- No stop loss strategy as of now
- No sell strategy. I am assuming that I will buy it and sell after 3 months as these are weekly charts and 12 weeks is good time to play out. However, need to come up with a stoploss and sell strategy
- Equal weights allocated
- 3 month absolute return multiplied by 4 for annualized XIRR assuming capital is being used only for 3 months
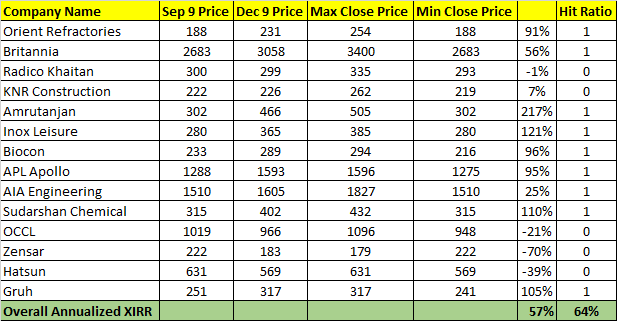
Edit: thanks @cabunny for suggestion, benchmarking this with NIFTY 500 (better representation of universe), similar return was 31% (8972 to 9669) and hence, benchmark out performance XIRR is : 57%-31% = 26% which on absolute basis is 6.5%.
Will be tracking this strategy for 8-10 more iterations and if results are encouraging, then, will back test and if back tested results are good, then, will go for further analysis to come up with a stop loss and sales strategy to convert into an algorithm. Also, would be interesting to understand what created difference between winners and losers from technical data. Would need at least 8-10 successful iterations to build any confidence to spend time on this worth the effort
4 Likes
From September 9 to December 10 nifty moved around 10%, you should also check result in a period when broader mkt go down… May be results will be different.
1 Like
Thanks for highlighting, have edited
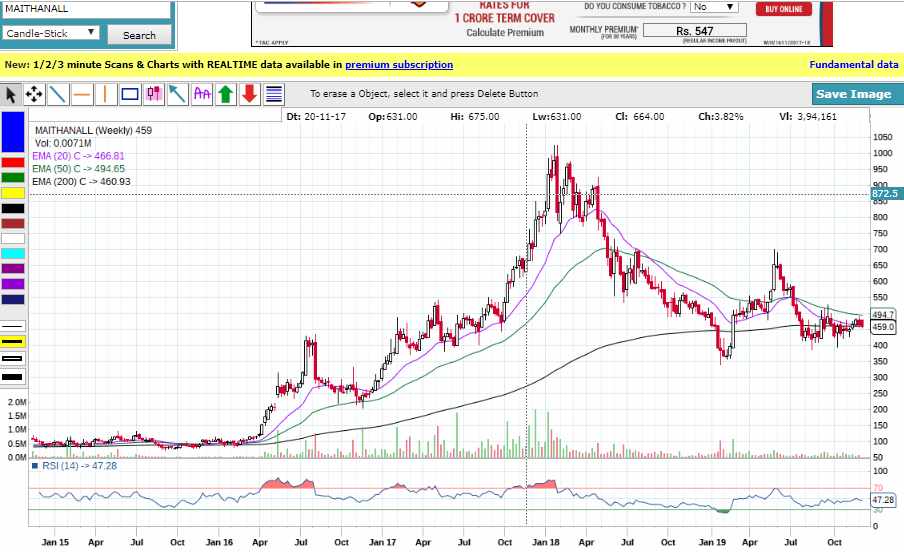
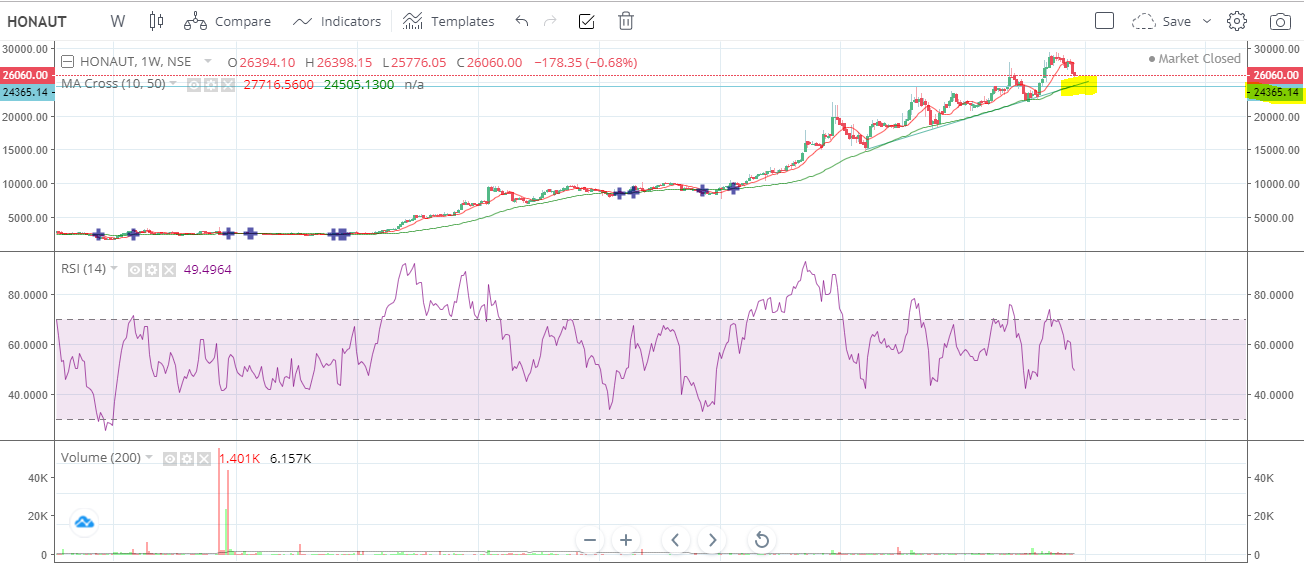
On a superficial look of your chart, mainthan alloy has not been able to lift off from the support after that correction post july…
Could it not be a case for redistribution or simply bearish price action?

i would be concerned, with this action, so much of effort without result, although it is still forming higher lows, this strikes out as bearish action to me
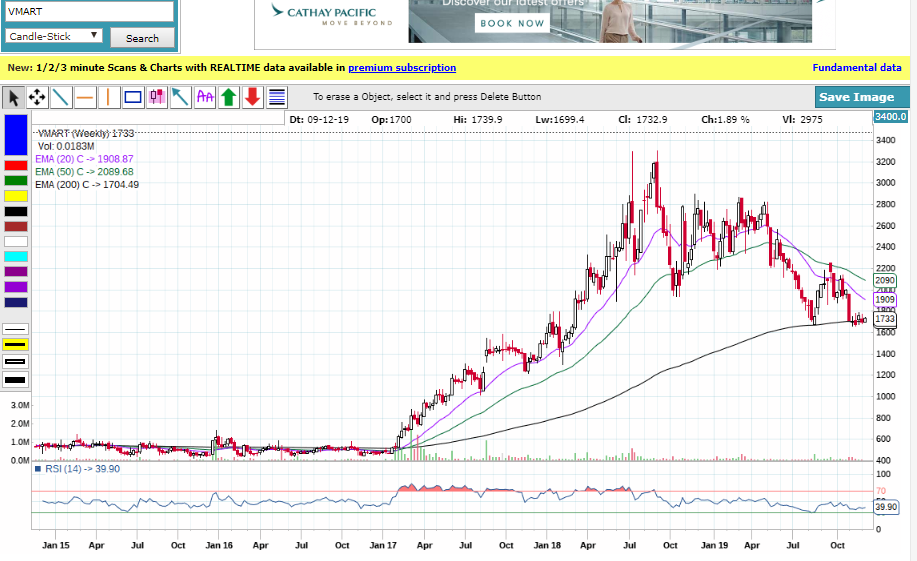
vmart is a flat line after the correction, it had gone through distribution before…
could you elaborate one the technical picture which you are finding interesting in these 2 counters? i might be missing something here
btw, excellent performance of your scrip choices in past 3 months!![]()
1 Like
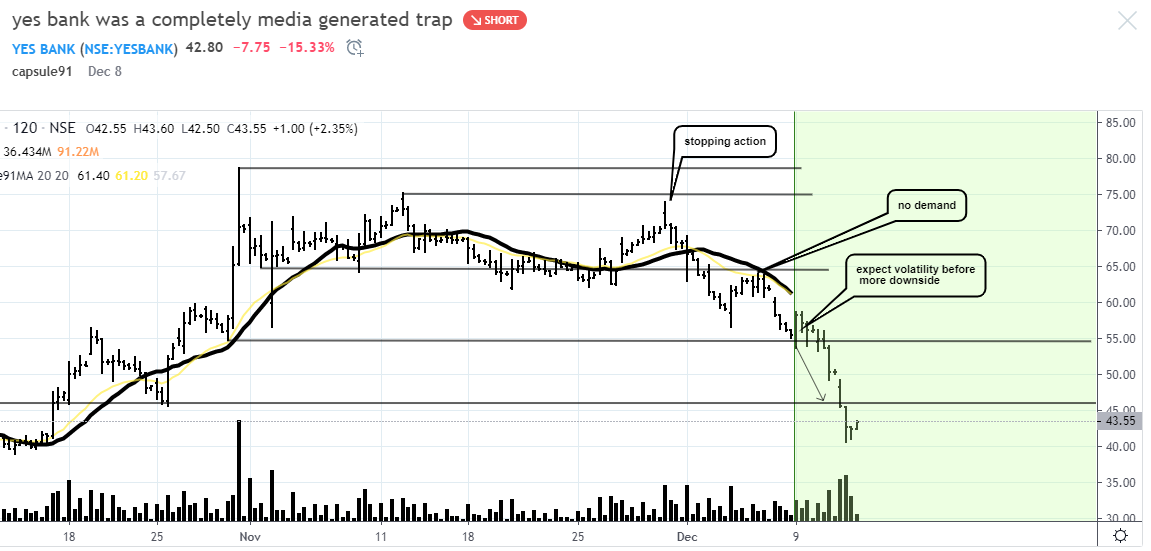
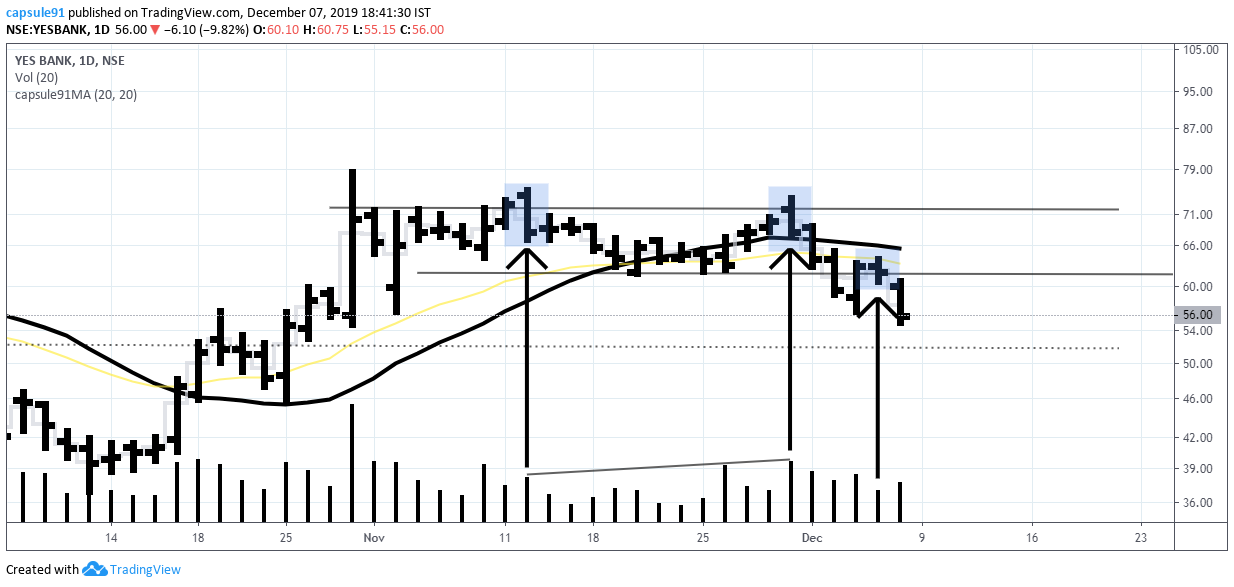
what an ending to a media frenzy on yes bank!..
i wonder how many got trapped…
this is an excellent example , where technical analysis helps, if one is having a conviction on the scrip fundamentally…
i was bullish on the action at a time, but the turn of December, something very alarming camp up on the 15mins chart, and i raised my SL , which was at breakeven level previously, which got hit the same day…
a great escape…
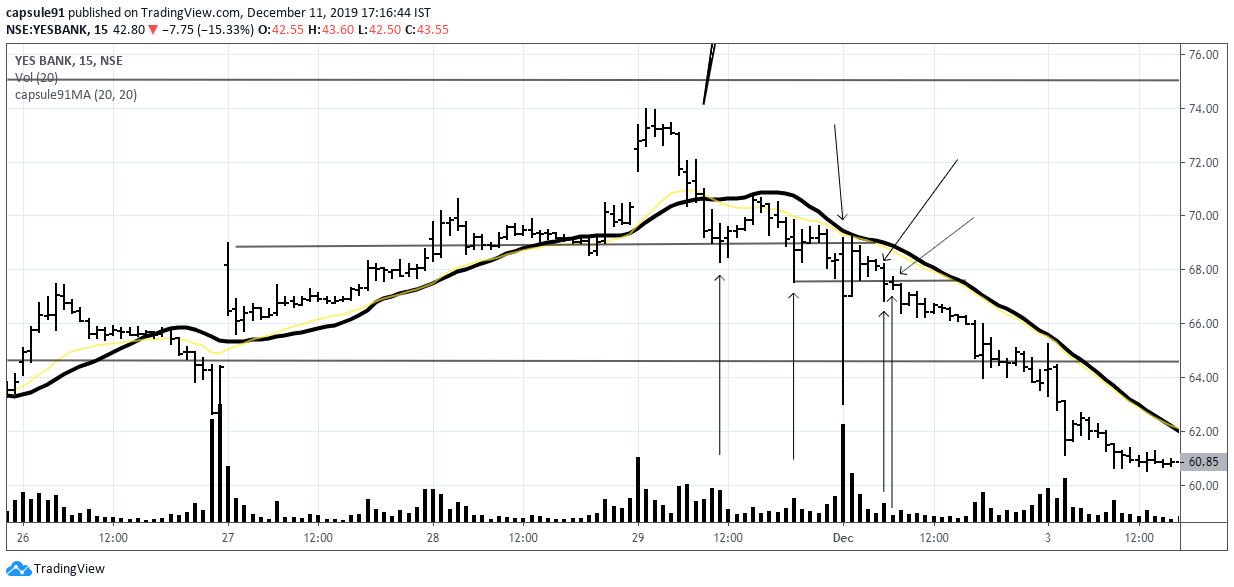
29th nov even , after the gap up and the fall below the 15mins 20ema/sma i was nto much concerned as the price was maintaining above a upthrust level and any attempts to go down on volume was being bought… marked by the first 2 arrows
the open of december, had a flash crash, my initial SL was strangely not triggered, may be due to exchange glitches which happens a lot, any day trader will have faced it
still i was okay with it, sometimes, operators stop hunt like this…
the next candle after the crash was a very positive close near the high of the crash candle
the last 2 arrows from the top, marks a very interesting bearish change of behavior
the last low support was broken and almost closed below the support and the next candle was a star, with no volumes…
this was not a possible spring, this was a breakdown…
such a microscopic thing actually signaled a disaster in the action and it never recovered again…
the current fall has ended on very heavy volumes, on the daily…
that indicates some kind of buying is coming in, it should be transient, hopefully trapped investors can get a better exit price from here
while entering money into the market, i wonder why there are some fundamental schools who have disdain towards technical analysis…
i believe it equally important to learn both…
examples of greats of the past , might never have talked about the importance of technicals, but that going out of their way and adding a new weapon in the armory is gains after all
A recent disclosure by one of the elite of VP forum, Basumallick sir, who has been experimenting with a new system of investing which i think involves some form technical analysis, for which he has taken a course on it, indicates adaptability is the key in thought process according to environment in the market…
10 Likes
this post is specifically for tradingview users…
those who user other trading platform, can find similar function their respective ones…
the 9 period simple moving average always is an ignored child i believe among short term traders and longer term holders …
it holds less value in the over all trend , as 9period look back period in the daily chart is a microscopic look into the price action
i personally find 20 period moving averages best for any type of time frame trader
For a trending market there are a whole bunch of indicators out there, but while using them, there always used to be a deficit in one or the other and there was none consistent enough which i could fully trust to be in the bottom panel of my chart…
Incidentally, i had been working with a trailing stoploss strategy in a volatile market like the current one, and i found 9period sma of very important value
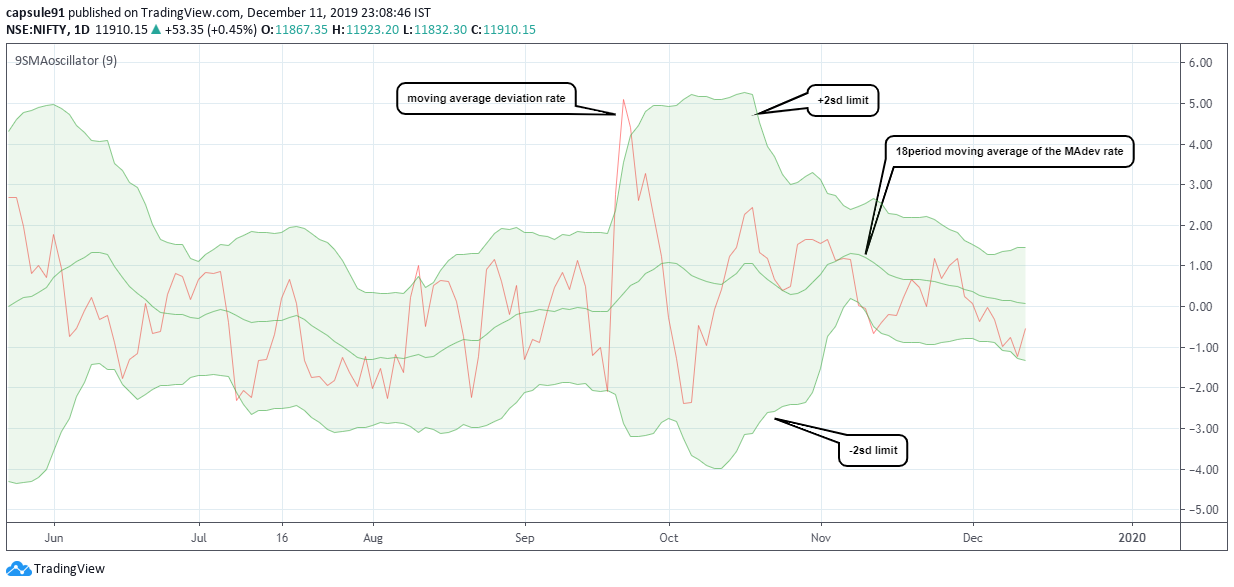
keeping all the deductions aside, using 9period’s sma, Rate of deviation from the price action and assigning +/-2sd to the mean rate, i found an indicator which i believe is the most sensitive and specific of all the oscillators out there…
the 9SMA Oscillator…
here is the source code, [created with trading view pine editor]
//@version=4
study(“9SMAoscillator”, overlay=false)//input
_maPeriod = input(9, title=“Moving average period”)//deviation rate
_sma = sma(close, _maPeriod)
_rate = close / _sma * 100 - 100//deviation rate std
_stdCenter = sma(_rate, _maPeriod * 2)
_std = stdev(_rate, _maPeriod * 2)
_plusDev = _stdCenter + _std * 2
_minusDev = _stdCenter - _std * 2plot(_rate, color=color.red)
_plotCenter = plot(_stdCenter, color=color.green)
_plotPlus = plot(_plusDev, color=color.green)
_plotMinus = plot(_minusDev, color=color.green)
fill(_plotCenter, _plotPlus, color=color.green)
fill(_plotCenter, _plotMinus, color=color.green)
Indicator properties
-
divergence
-
relationship with its own moving average
-
band compression and expansion
-
extreme positions within the band
-
divergence-
analysed the same way divergences in other oscillators are seen…
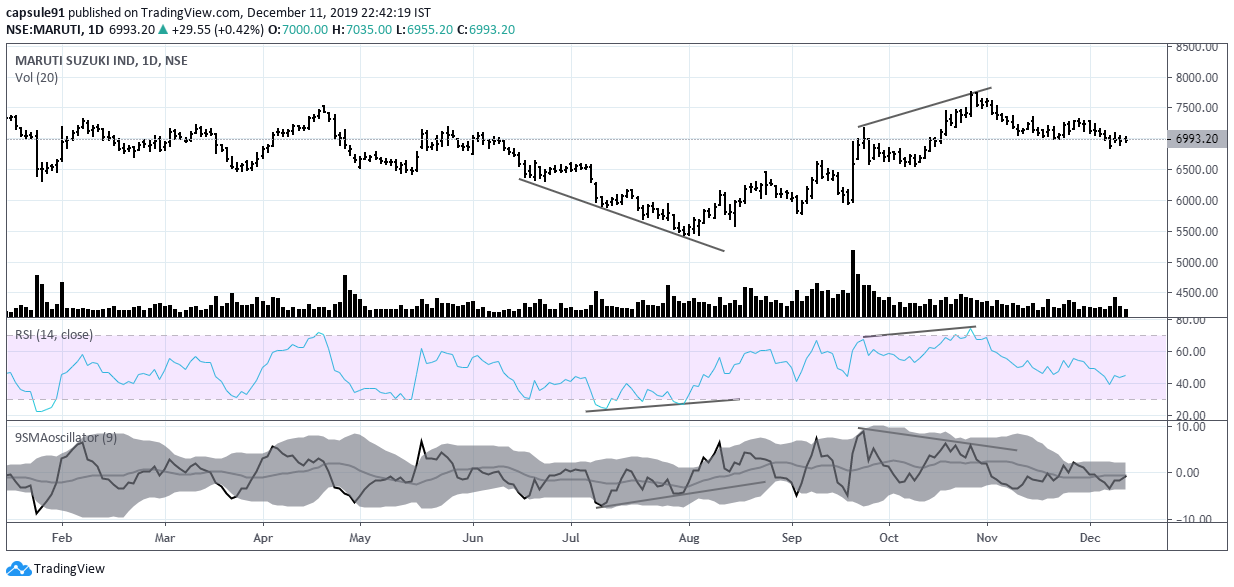
here are some examples, with sensitivity compared with rsi
the bullish divergence is very subtle in rsi , where was the 9smaO has a more visible one
the bearish divergence dosent show up on rsi, the 9SMAO has a prominent one, and marks the local top very well
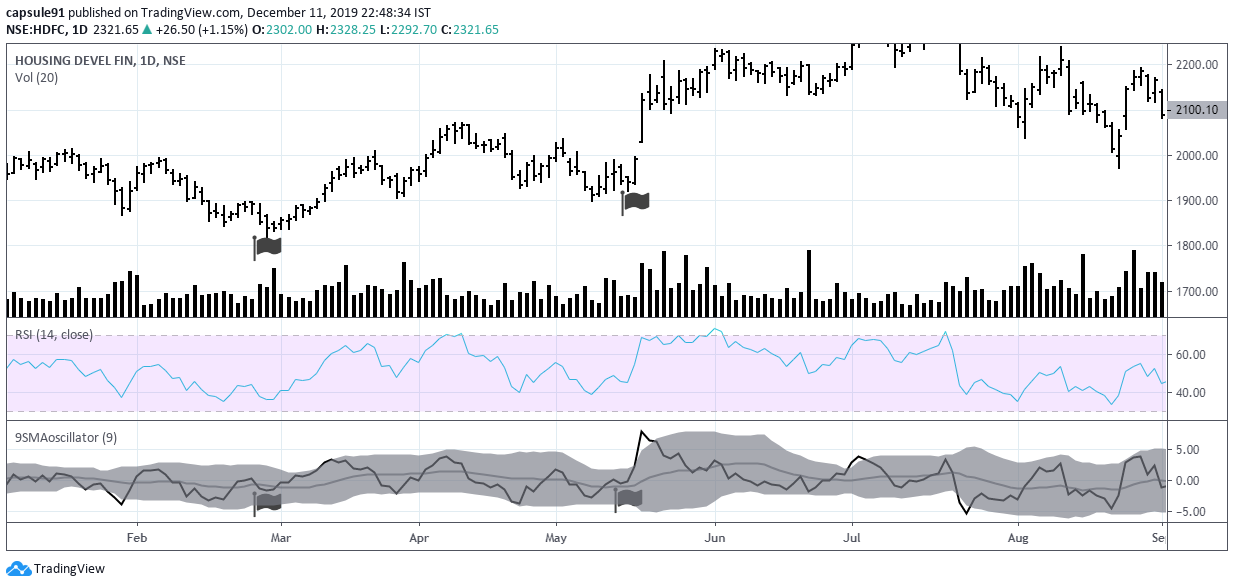
HDFC has an excellent example
there is literally no divergence in the rsi, the 9SMAO has a consistent performance
i will leave the other charts for anyone interested to backtest…

2.relationship with its moving average
this header is just a add on , not a very sensitive signal, but when present definitely adds value
if the 9SMAO takes support from its moving average after crossing from below, it generally indicates an oncoming good acceleration of momentum
3.band compression and expansion
as with bollinger band, band compression indicates a consolidation of price action and expansion is gain of price momentum
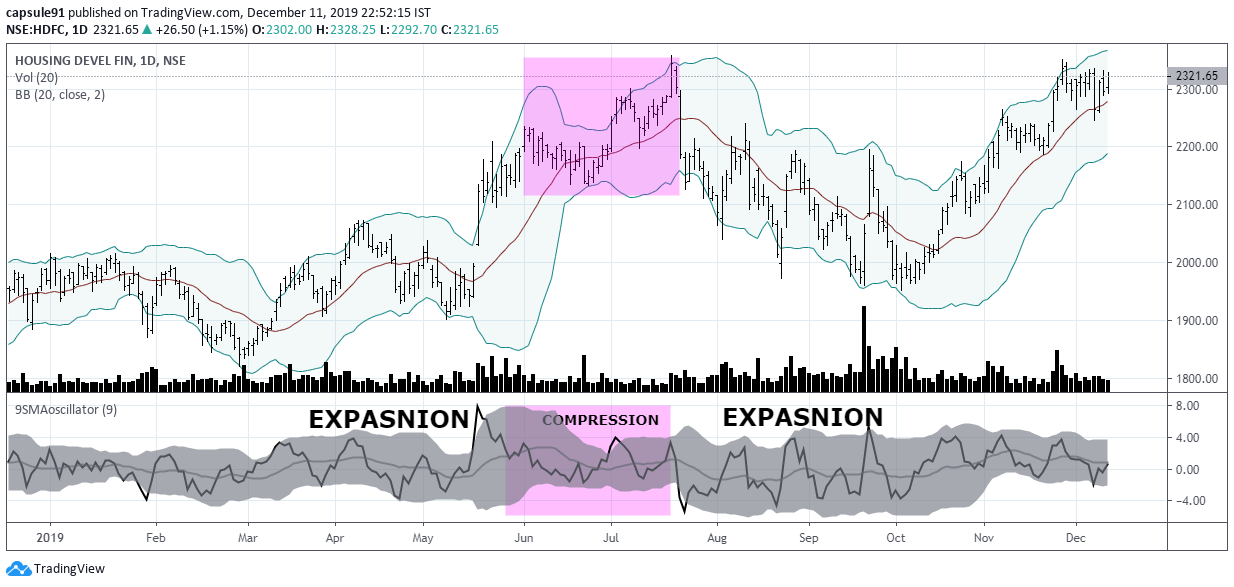
here is an example, compared with bollinger band
here the bollinger band started expanding when the final upmove had started, which might give a false impression that the trend is goign to continue while the indicator 's band remain compressed, indicating the final leg of upmove is a part of the earlier uptrend which is getting exhausted, and starts expanding when the down move starts…
better trend indicator
- extreme positions…
this feature has become a favorite of mine in intraday work where one is always looking to book quick gains
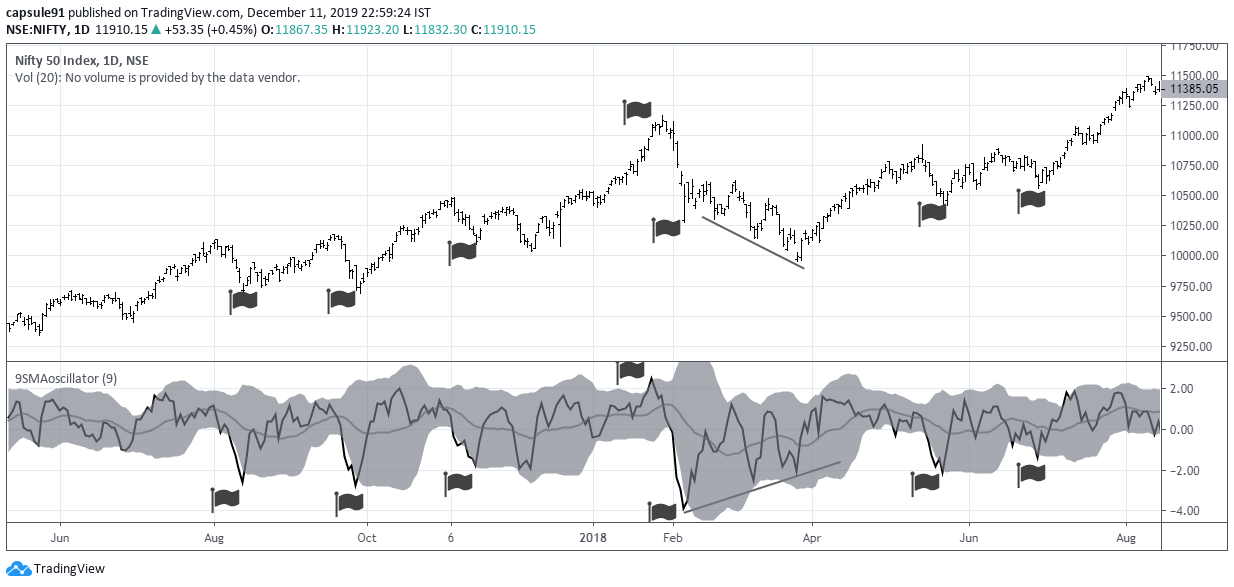
anyway, for daily chart this feature is not frequently present, but when seen, it indicates the end of a trend
the sticking out of the oscillator from its SD max, are very sensitive inidicating a stopping action in a trend
the post jan 2018 temporary bottom, was a false signal, bu the rest of the down trend showed a bullish divergence in the oscillator which led to the uptrend which lasted till september
analysing the present nifty action with the indicator along with the rsi

1.there is gross divergence on the indicator and the price action post tax break rally
indicating lack of momentum in the market, RSI showed bearish divergence betweent he last 2 peaks only
2. the band is compressed till now, indicating a bigger move is coming and the current fall is only a beginning
3.cannot sustain above its moving average since nov, indicating weakness and exhaustion at the top
the source code provided if added to the chart will look like this, i have customized it acc to my own needs
anyone interested can use this indicator on any time frame, if experienced with, this oscillator adds much better value to chart analysis in my opinion…
there are a lot of pattern a behavior this indicator will demonstrate which are of qualitative value, use with trendlines support resistance lines on the indicator , ofcourse along with price action …
hope this helps
10 Likes
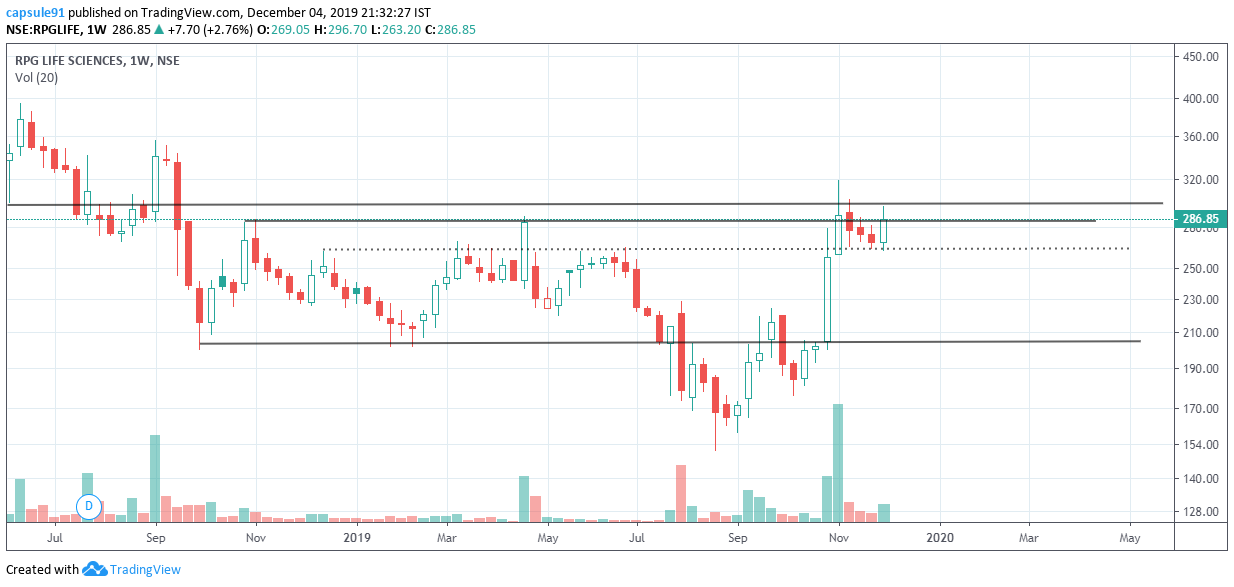
a repost regarding racl…
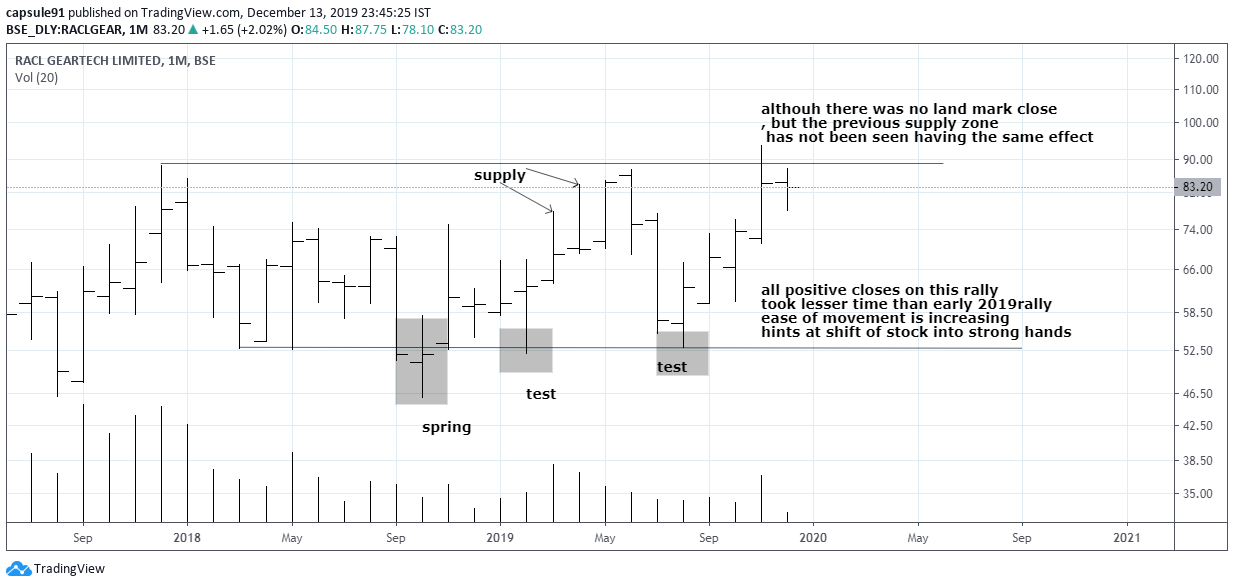
next few months would be very interesting in this scrip…
would expect low volume supply testing further…
disclaimer… closely tracking
2 Likes
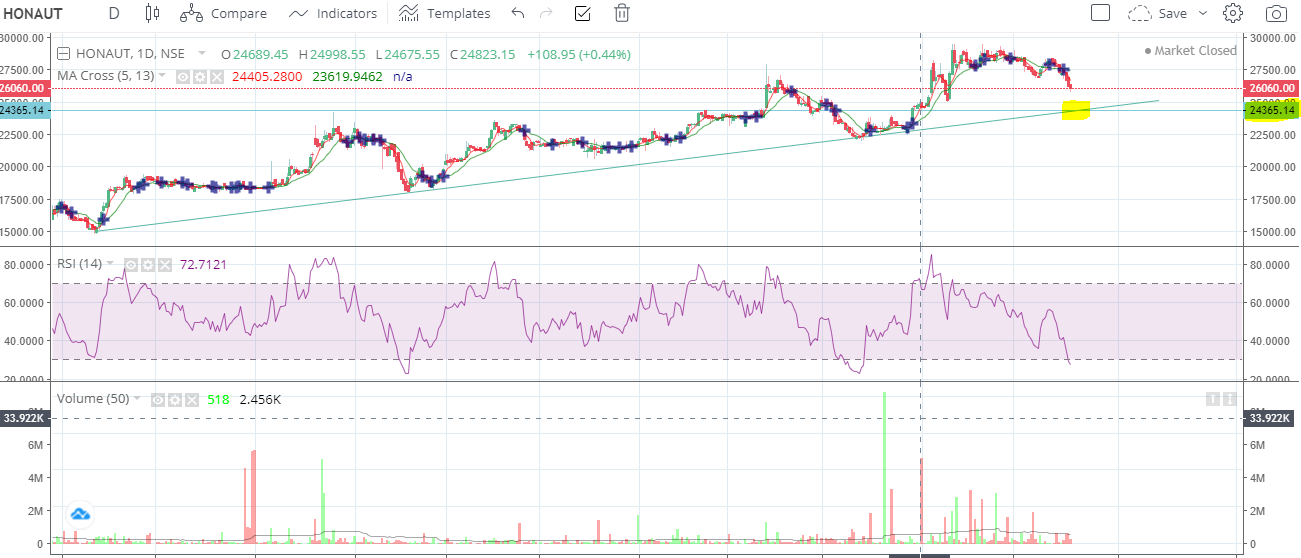
Opinions about idfc first bank…??
Chart looks very attractive for the long term
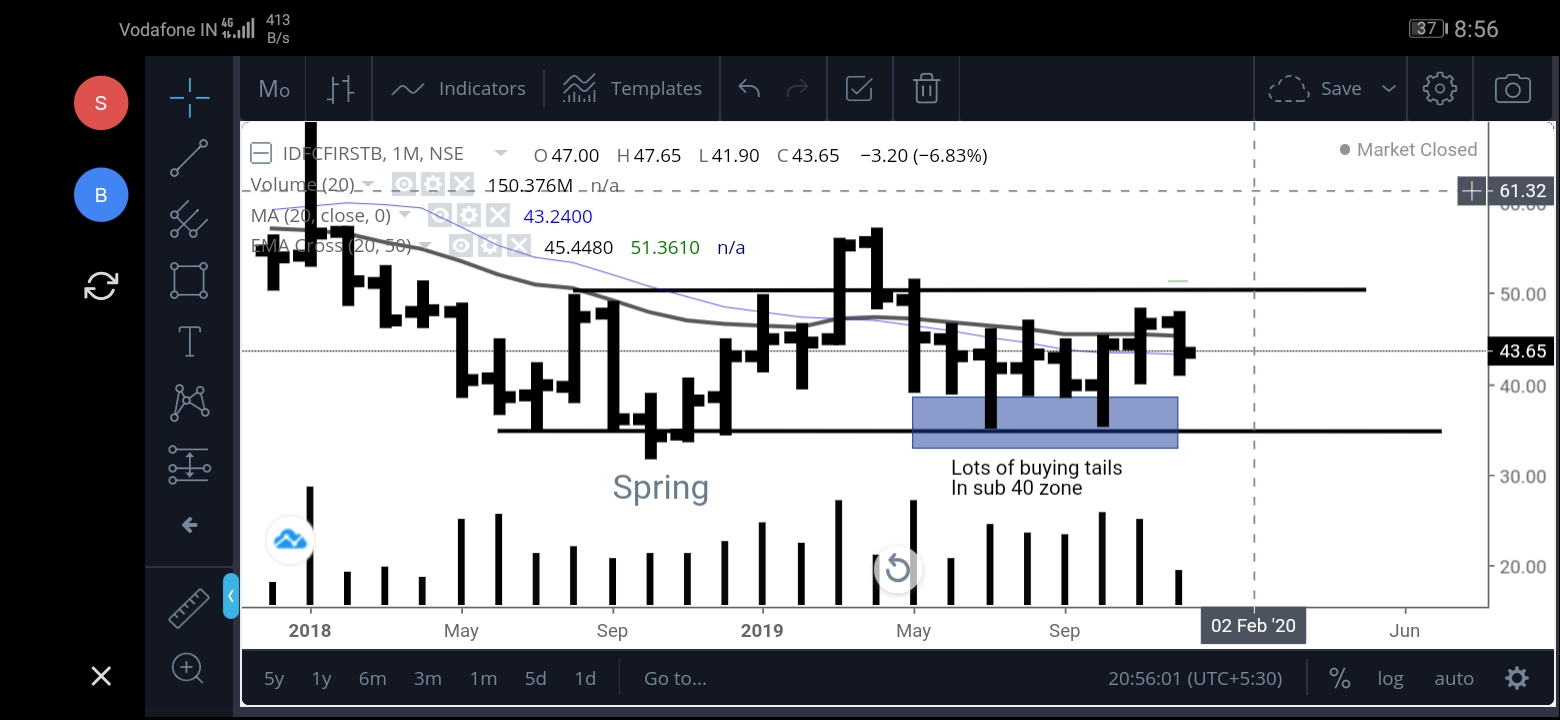
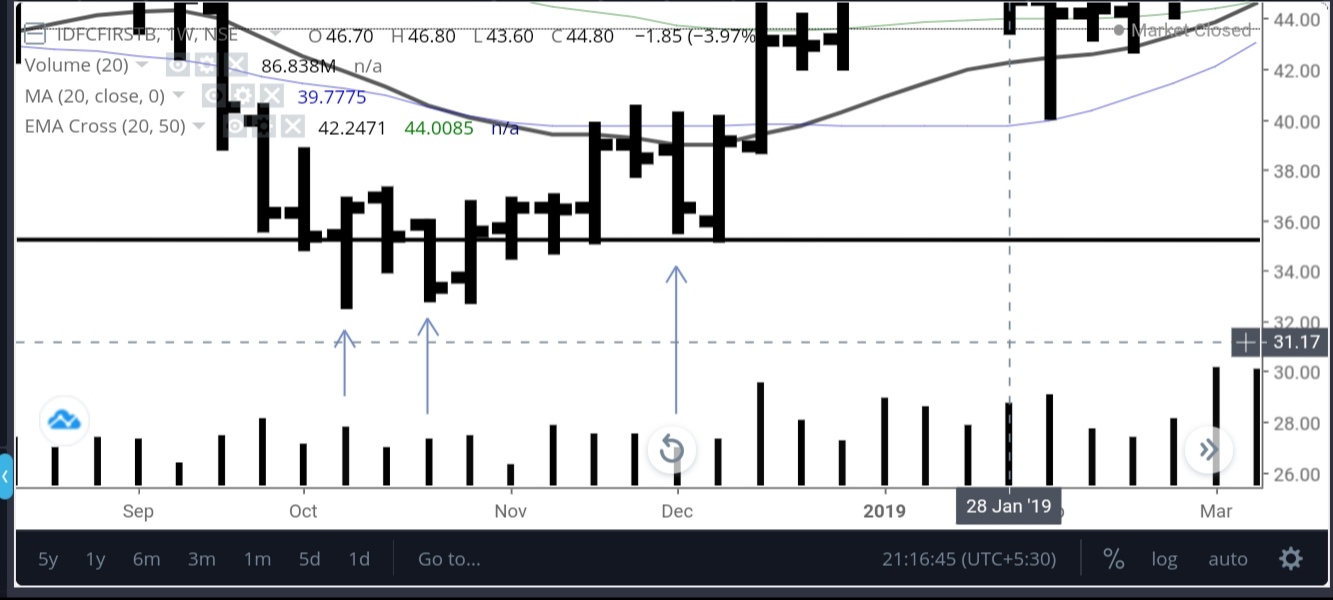
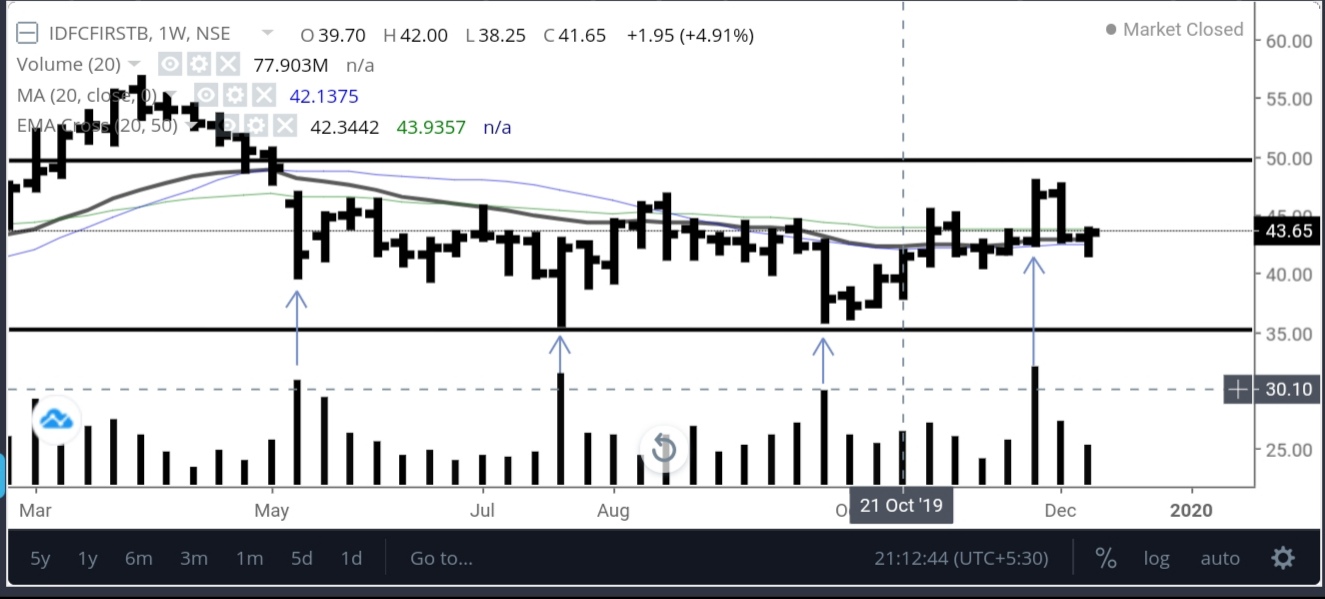
I have a hunch some institutions are heavily accumulating this stock since last 2 years
Sidenote… If any zerodha user here, do u know zerodha bundles tradingview Pro plus plan features for free? Today morning I updated the kite app, they have Introduced the black theme in the update and while checking the settings option I was surprised to see trading view as an option in the charting feature…
The current screen shot is actually from the kite app…
Tradingview in zerodha is way better than the denovo charting tool they provide…
2 Likes
IDFC First Bank investors seem to have a very high hope of outstanding performance by Mr Viadyanathan which is not yet corroborated by financial results. Couple of years ago Capital First was considered a serious competitor of Bajaj Finance, but now BF is miles ahead in terms of performance.
If they are, it’s not reflected in shareholding pattern. There is some FII buying which is almost canceled out by DII selling.
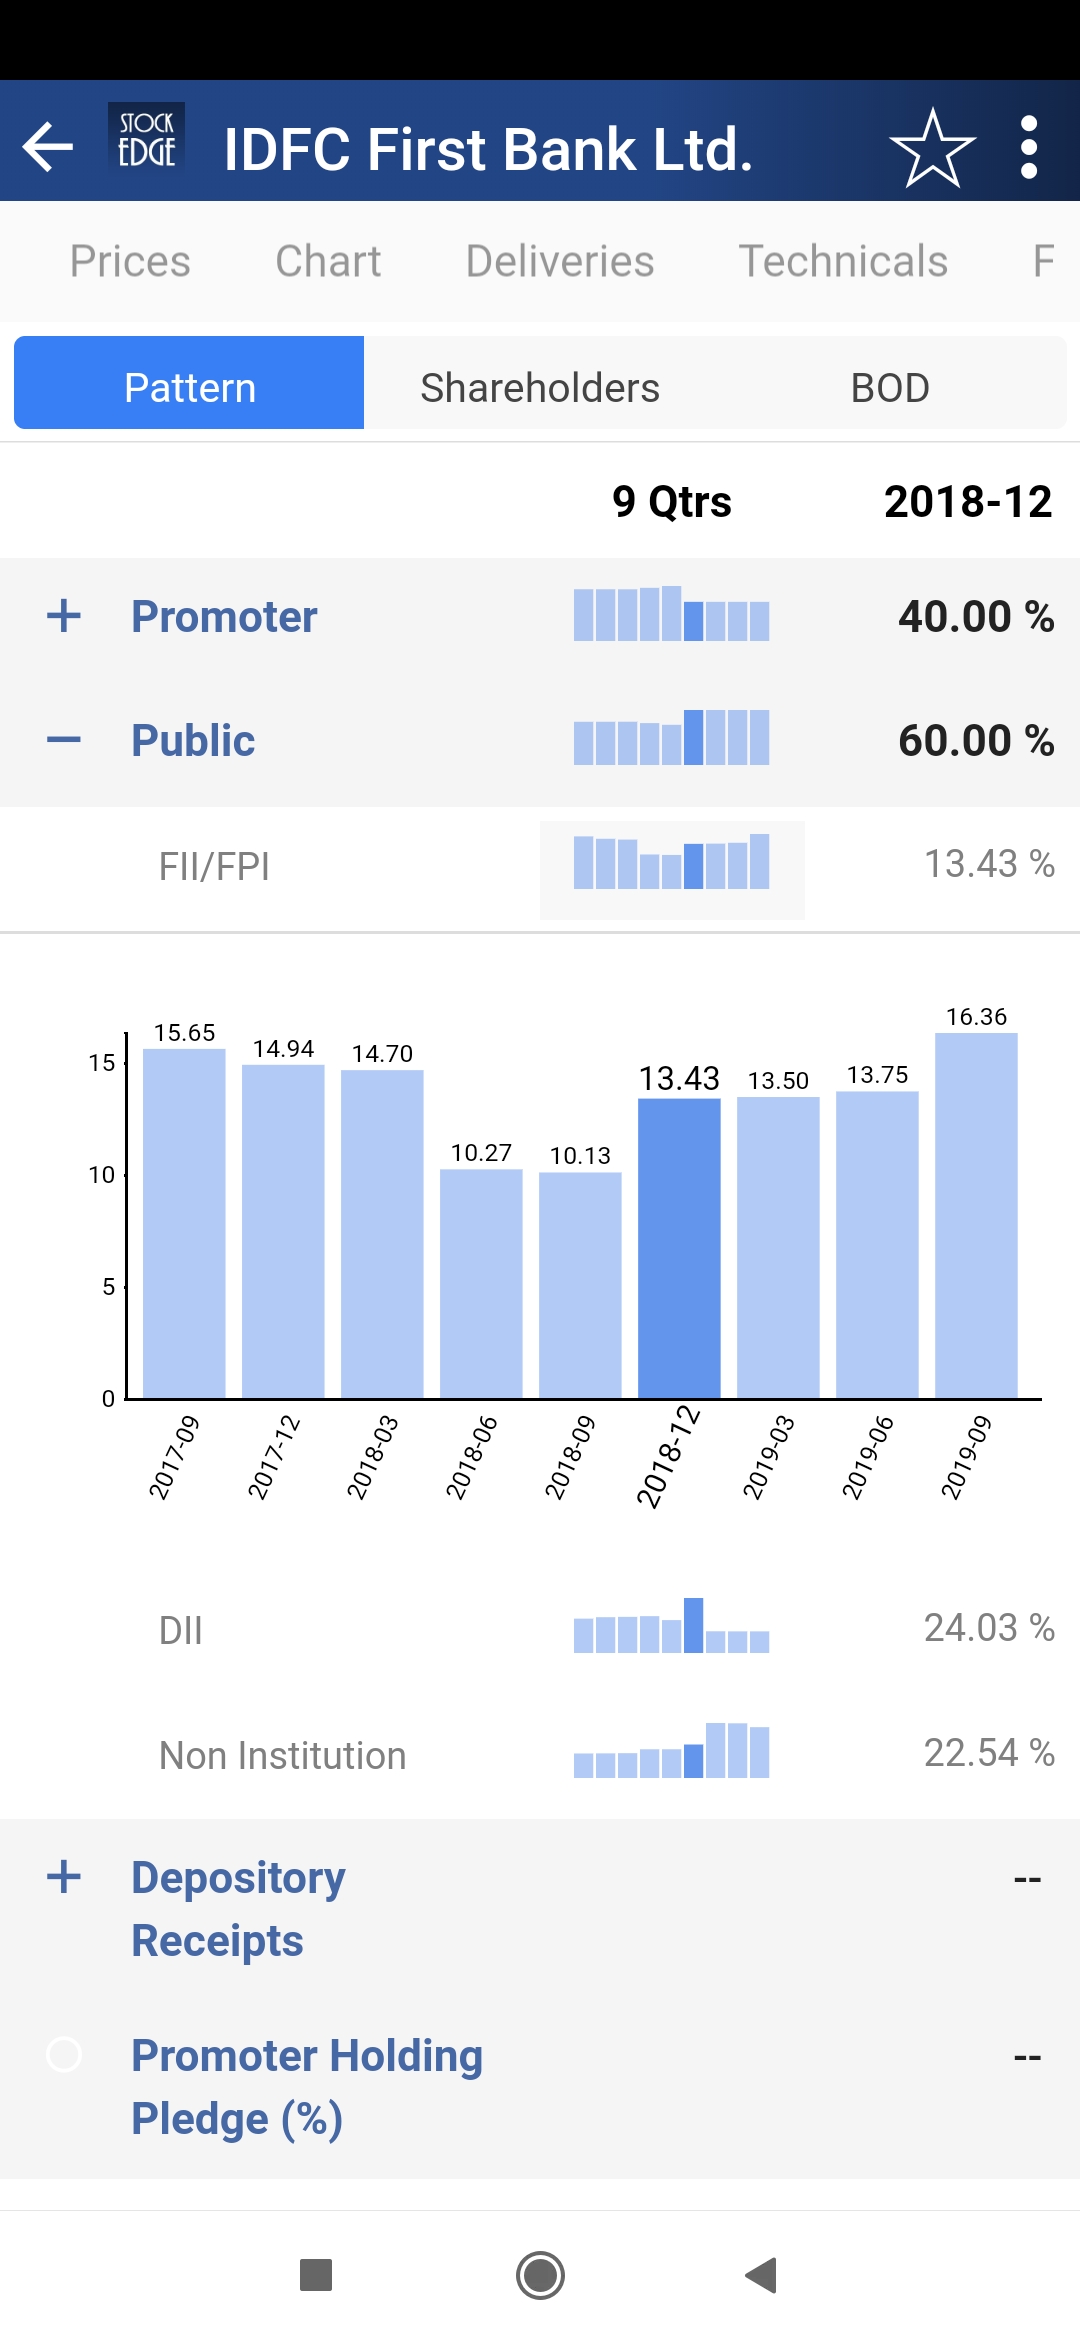
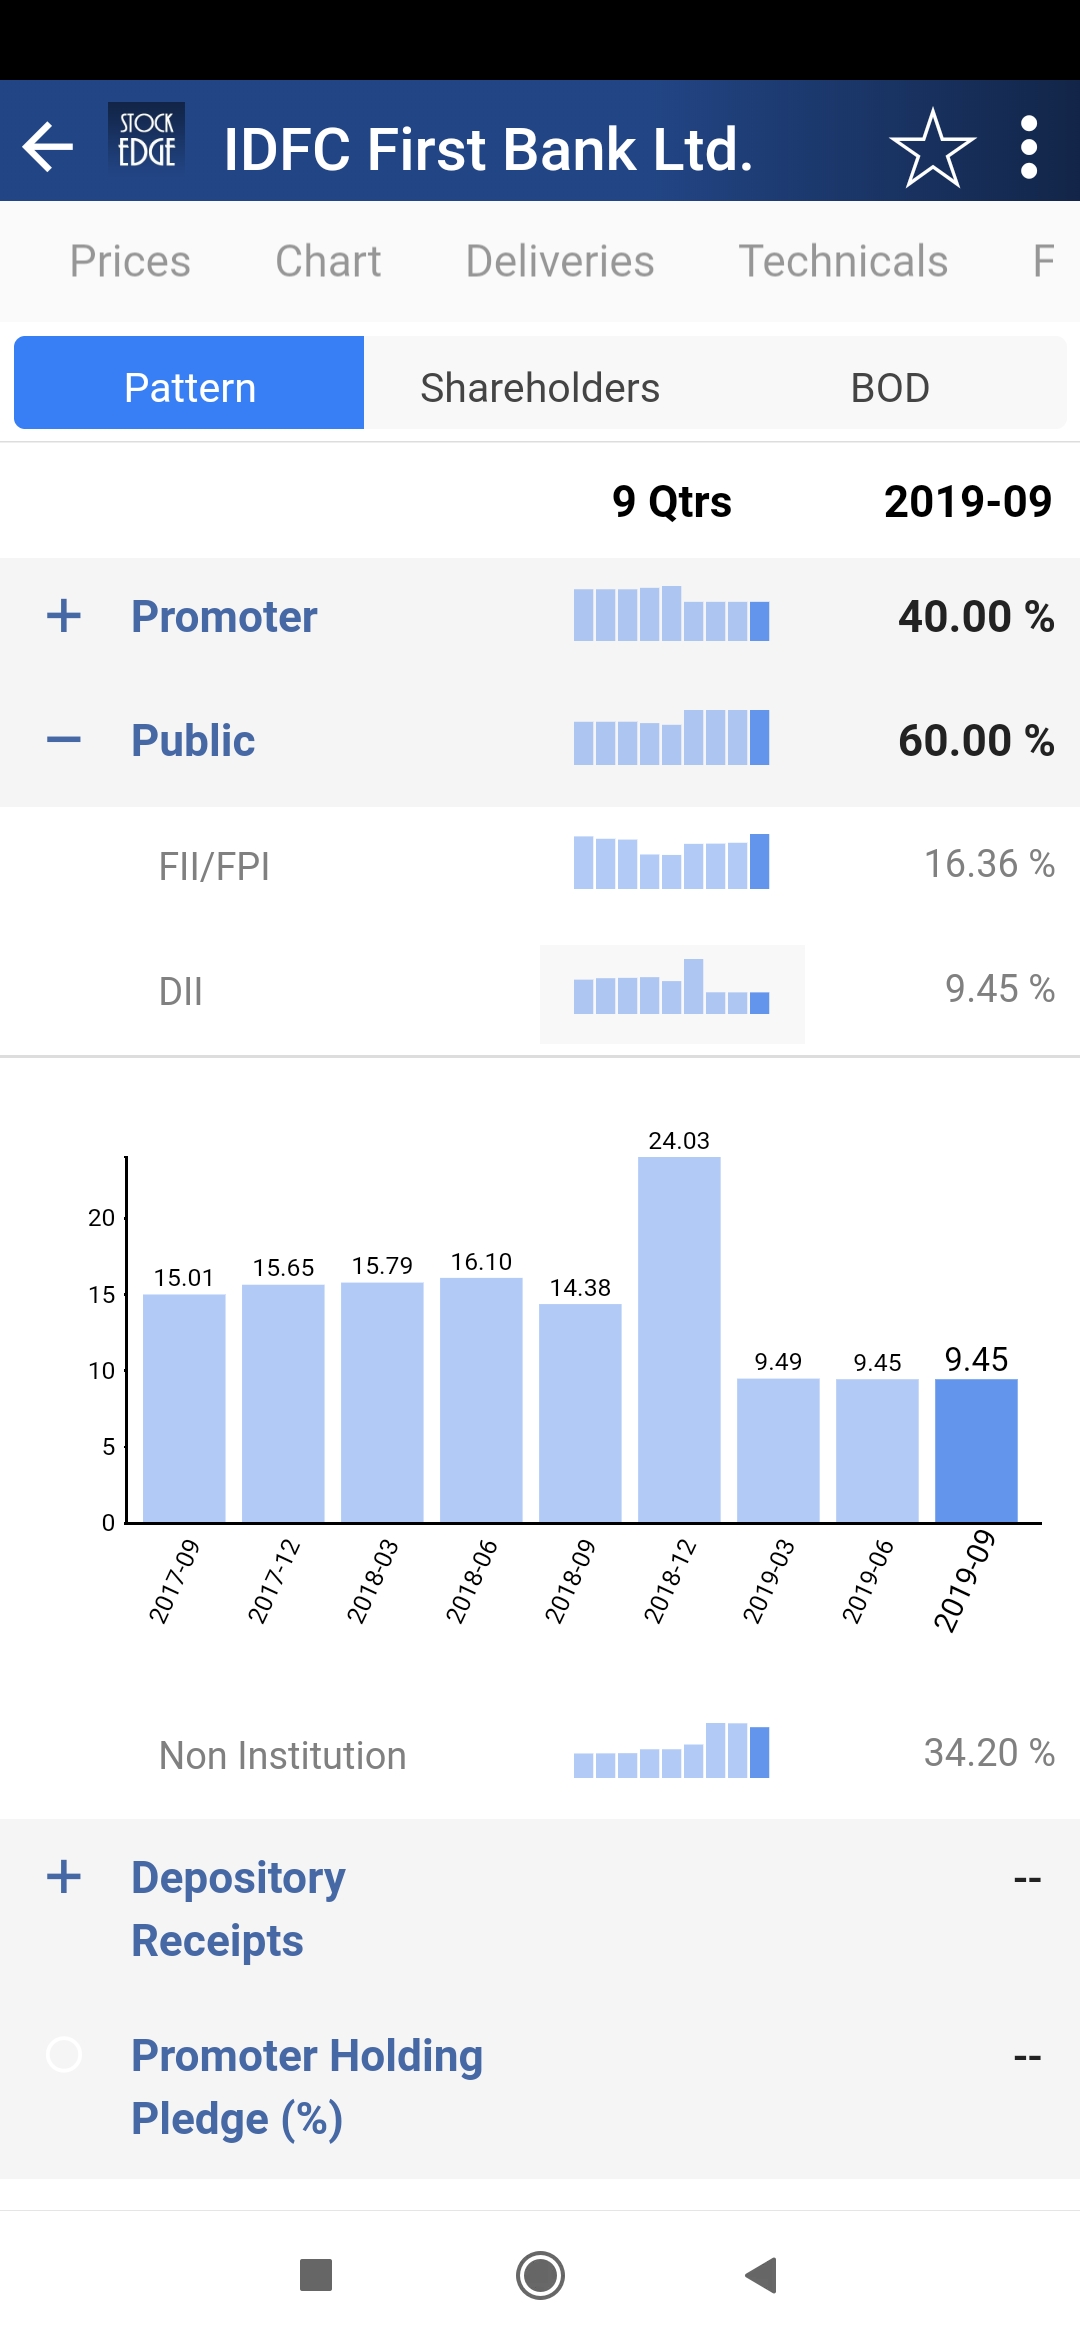
It’s diicult for IDFC FB to ouperform the broader market consistently, IMHO.
Disc. No position in last one year.
1 Like
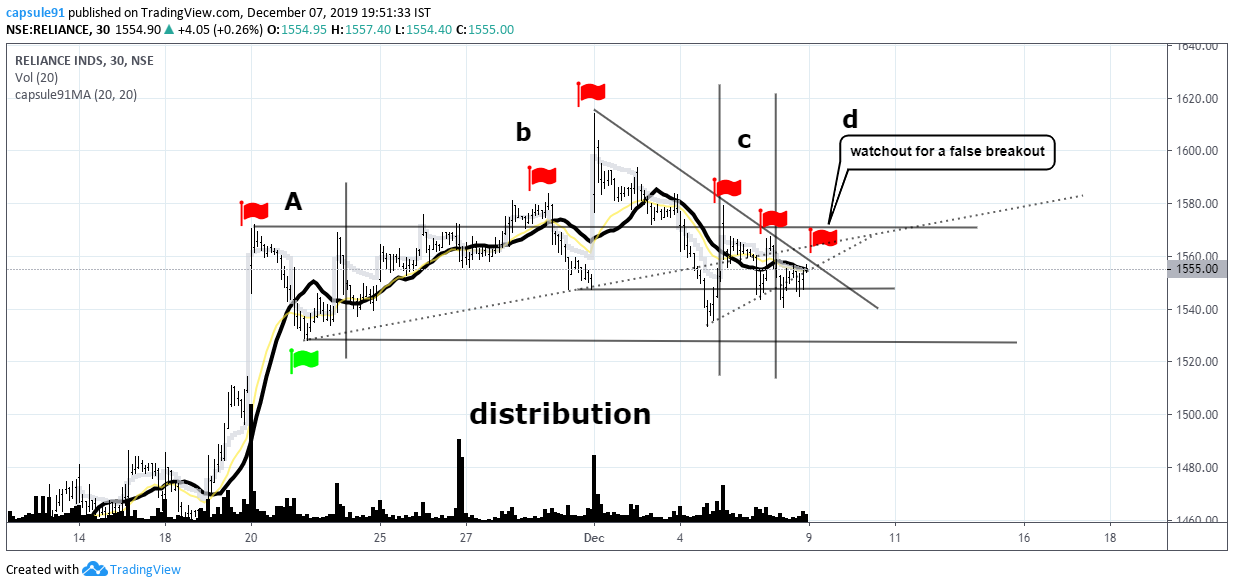
Reliance done with the false breakout…
Now the price should increase in volatility to downside…
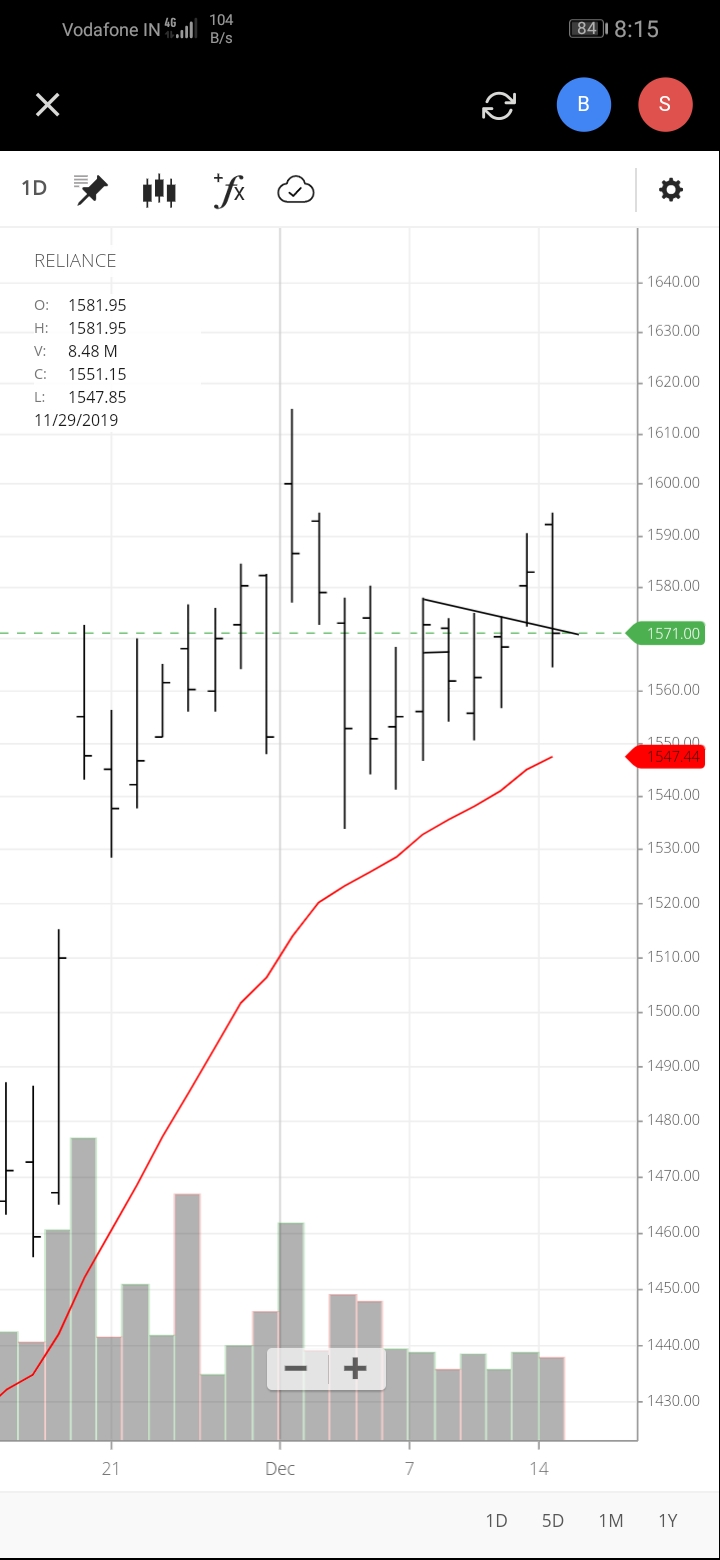
Also closed below the local resistance, besides the bearish engulf…
Disclaimer… Accumulating short positions in derivatives, with close stops… There are potential risks in the trade as although not a single candle in the daily has a positive bias, the price action is above the 20dma and dema…
1 Like