true. My bad. i shud have said volumetric heavy selling. When supports are tested with more than average volumes they tend to break. Same for resistances on breakouts too. 
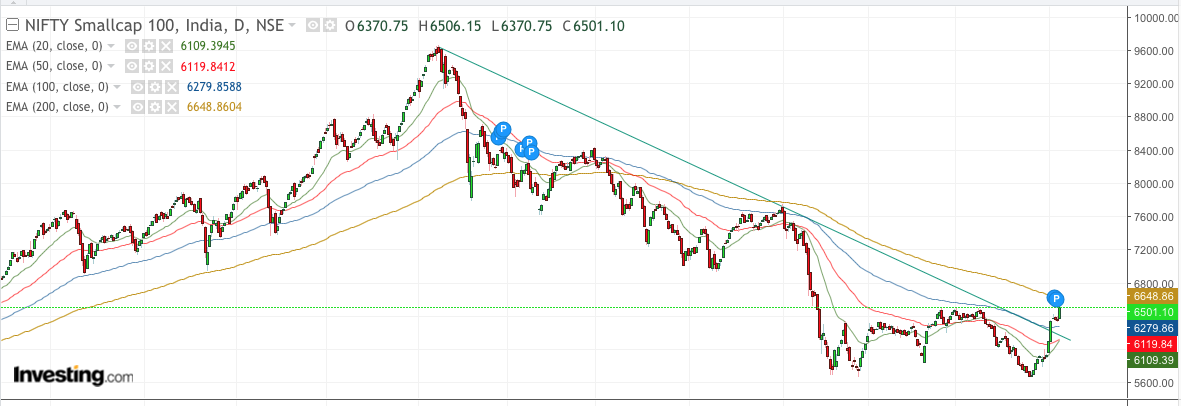
Well said. It’s intelligent enough to wait for dip when small caps have started with “so called” pre election rally. Only risk being… Lot of upside to be missed if it doesn’t reverse from R2.
And it bounced 200 pts exactly from then on along with the broader market ![]()
2 Likes
Nifty Smallcap 100 - Trading above the resistance trendline, above 20/50/100 DMA, 20/50 DMA crossover and close today is the highest close since Sept 27th, 2018. Near-term 200 DMA could be a resistance but the acceleration could continue until 7200-7500 which is still about 10-15% from here - much of it could even happen within the month or early April, if the strength shown lasts.
10 Likes
I agree and this might catch lot of people with surprise. Have inclined my portfolio towards quality midcap and small cap. The market breadth is largely positive and the rally looks broad based. One should ride it for at least 18 months or so.
Regards
Divyansh
Yes… breaking out big…
@phreakv6 I don’t know how to come up with such levels… Could you please post your charts after today’s move
Hi All,
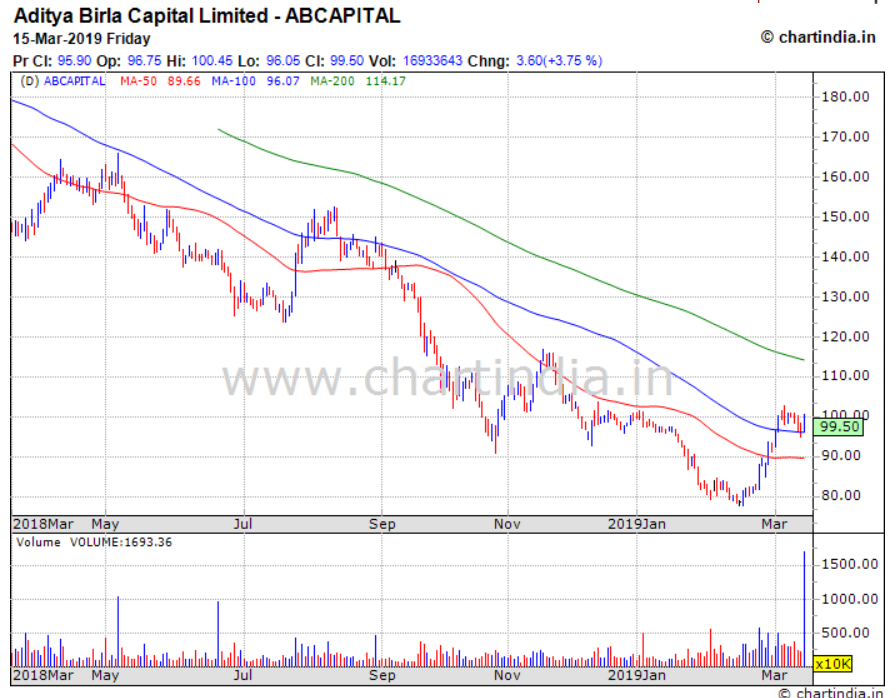
I am a beginner in Technical Analysis. I am looking at chart of ‘ABCapital’. Its been in downtrend since its demerger. It’s above 100/50/20 MA. It had good volume last week.
Whether the bottom has arrived? Please help to interpret the chart.
1 Like
On the higher timeframe chart, A B Capital appears to be clearly downtrending. Lets wait to see some consolidation.
1 Like
I beg to differ in opinion. Though data is short on monthly and weekly; it seems a by indicators and trendlines, a buy above 109 can yield 125-144 target on short term basis.

2 Likes
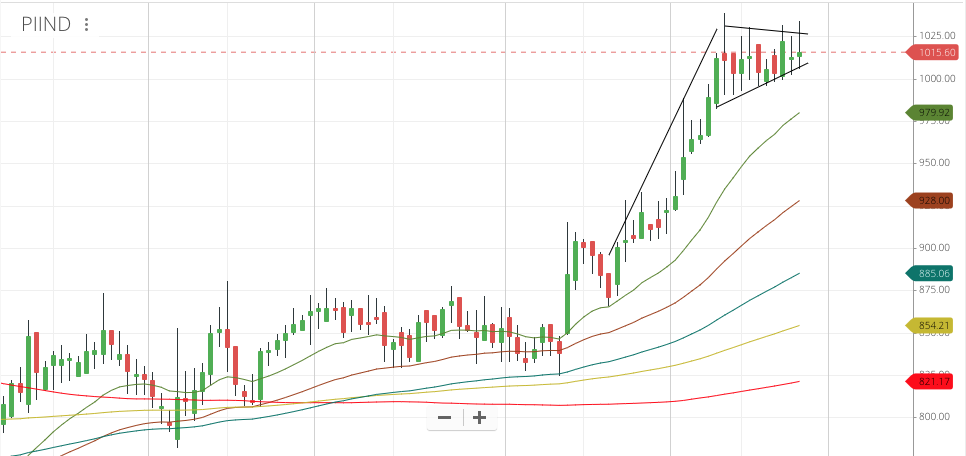
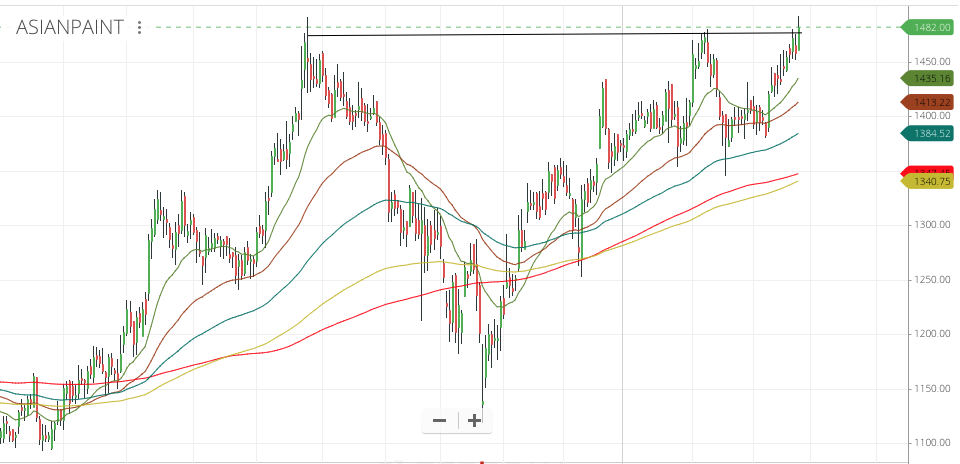
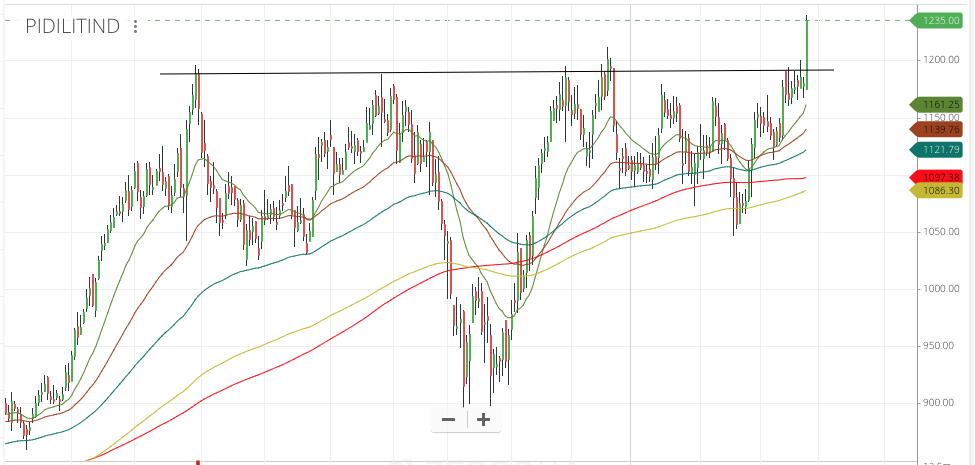
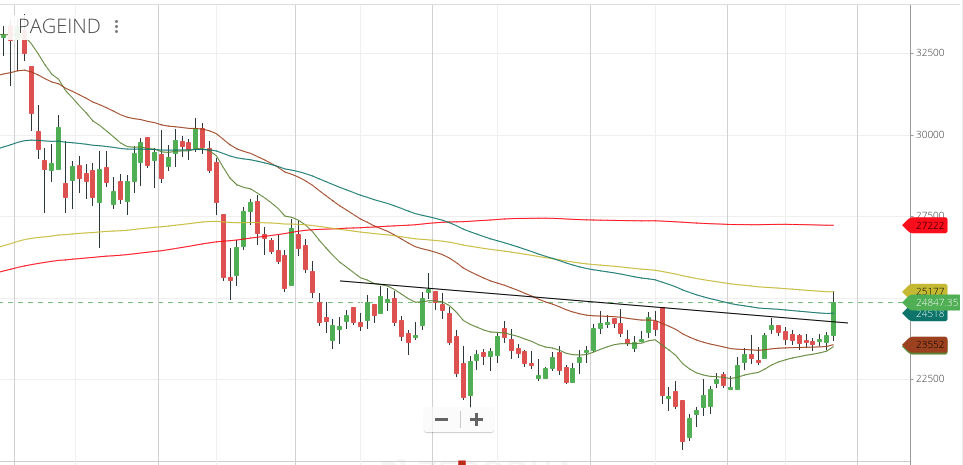
Some textbook patterns I noticed today
PI Inds - Flag
Asian Paints - Cup & Handle
Pidilite - Inverted H&S
Page Industries - Breaking out of a 4 month consolidation
8 Likes
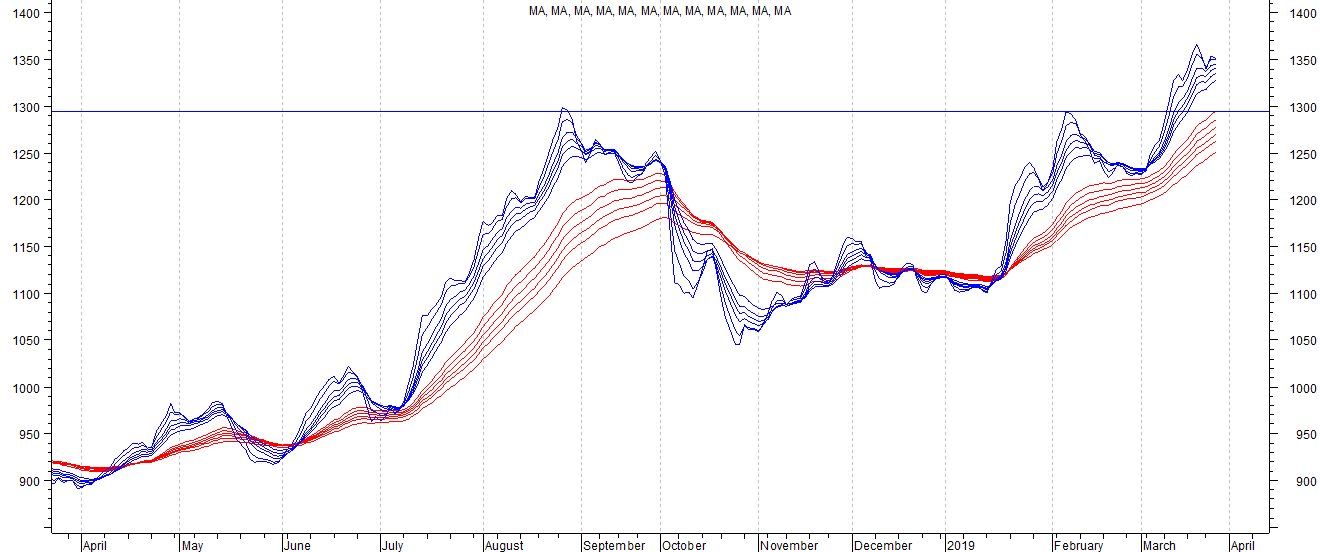
This turned out dead right! Suven did hit 187 end of Jan and rebounded thereafter, forming an inverted head and shoulder. What is interesting now is that the MAs seem to be all positive wrt each other. Will it test previous high within next one month?
Invested.
5 Likes
Hi Sir, can you tell how do you screen stocks on the basis of technical parameters. To explain my question further- I am curious how you landed at Reliance from among so many companies ( is it just one of the many stocks you track daily or you check for few technical parameters/ values to shortlist stocks and then look at their chart patterns)
Screening the stocks for good chart patterns is a laborious process. I dont have any predefined screens. But overall I keep looking out for
relative strength shown by companies during corrections
sectoral moves wherein most stocks from sector start moving together
bottoming formations.
Stocks making the cut to 52 week highs or all time highs.
Charts of stocks suggested by friends and fellow investors.
7 Likes
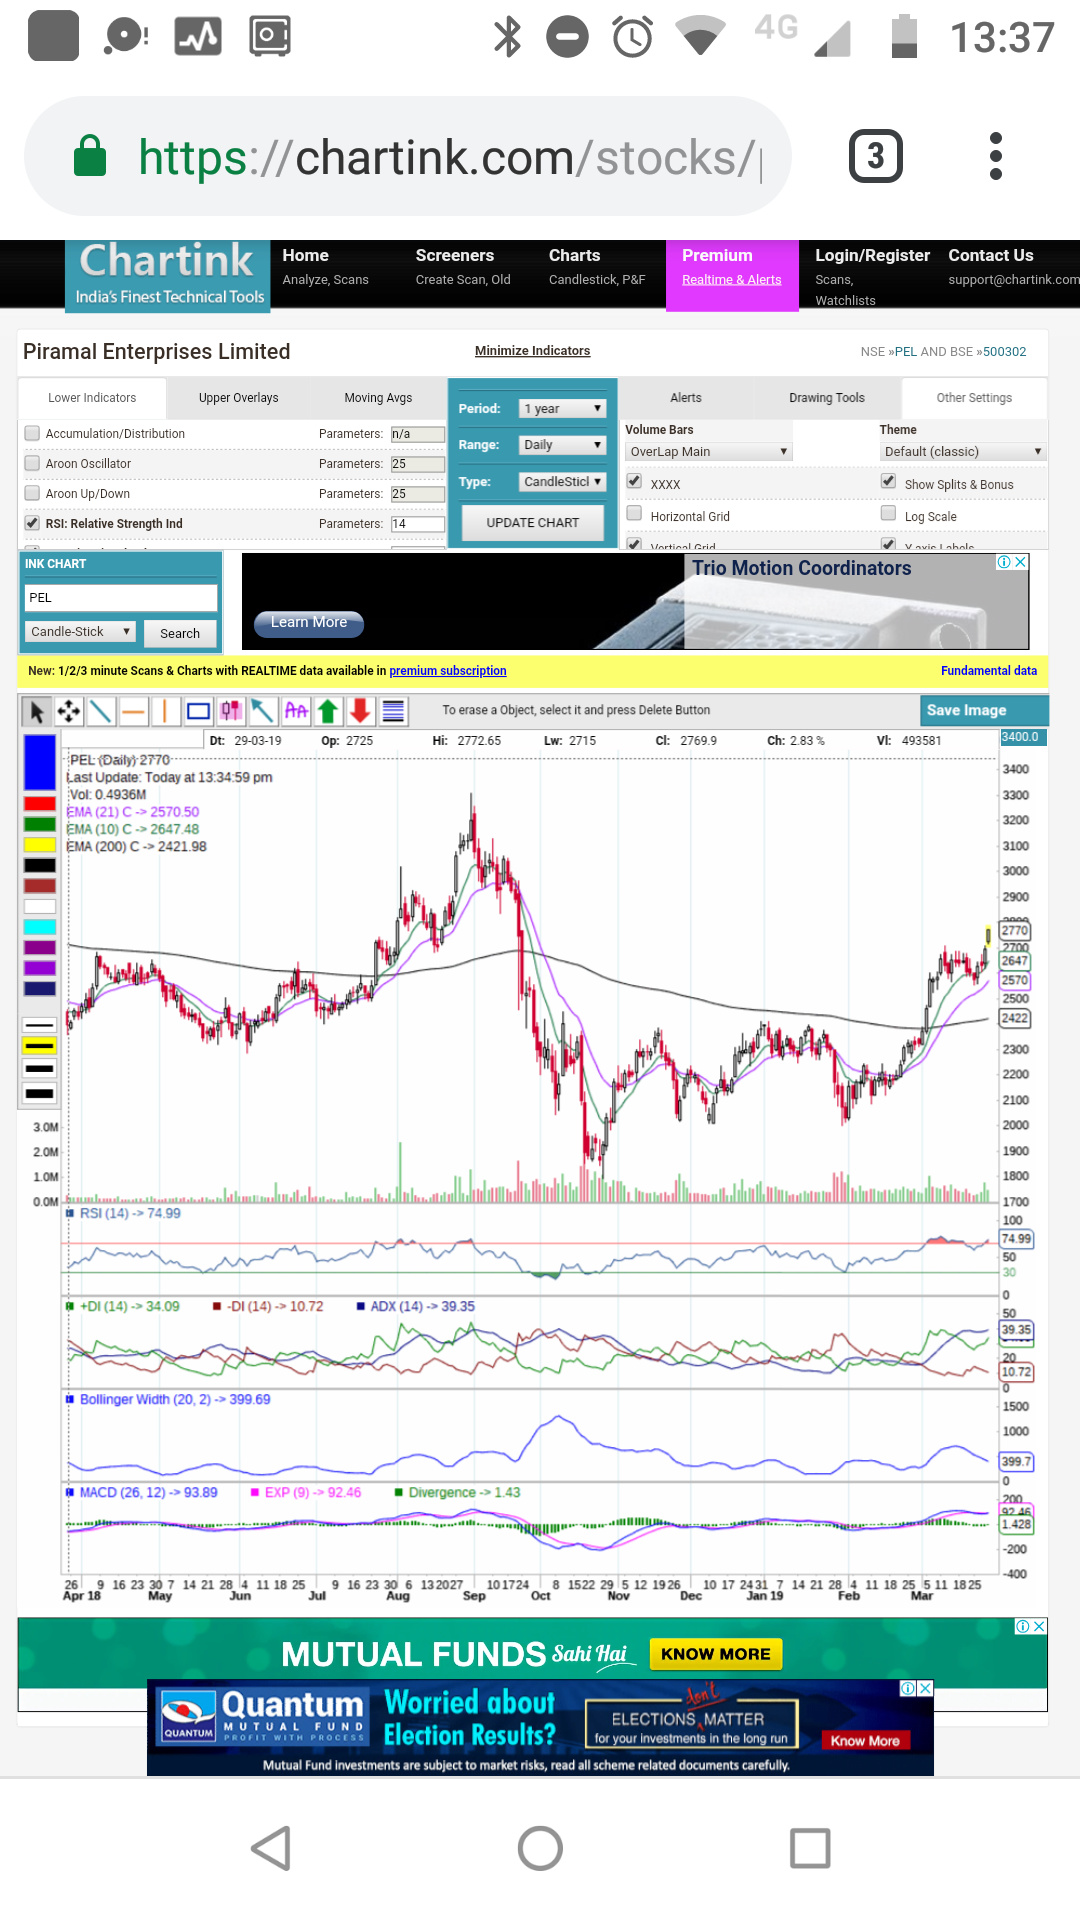
Here is the daily chart of piramal enterprises. The stock has given a breakout from a bullish flag pattern along with decent consolidation. Also are rumours of it buy dhfl. It’s a NBFC and they sure do look like the market flavor for the time being. Targets are around 3000 in a month with stop loss at 2650.
Initiated trading position at 2720
2 Likes
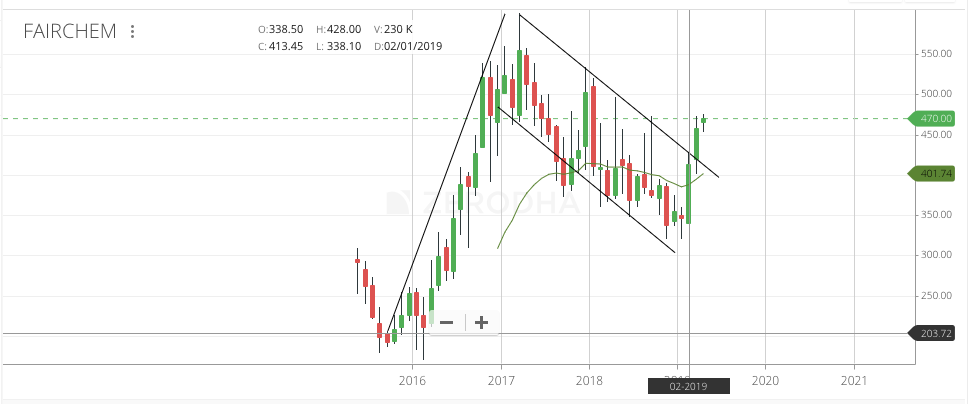
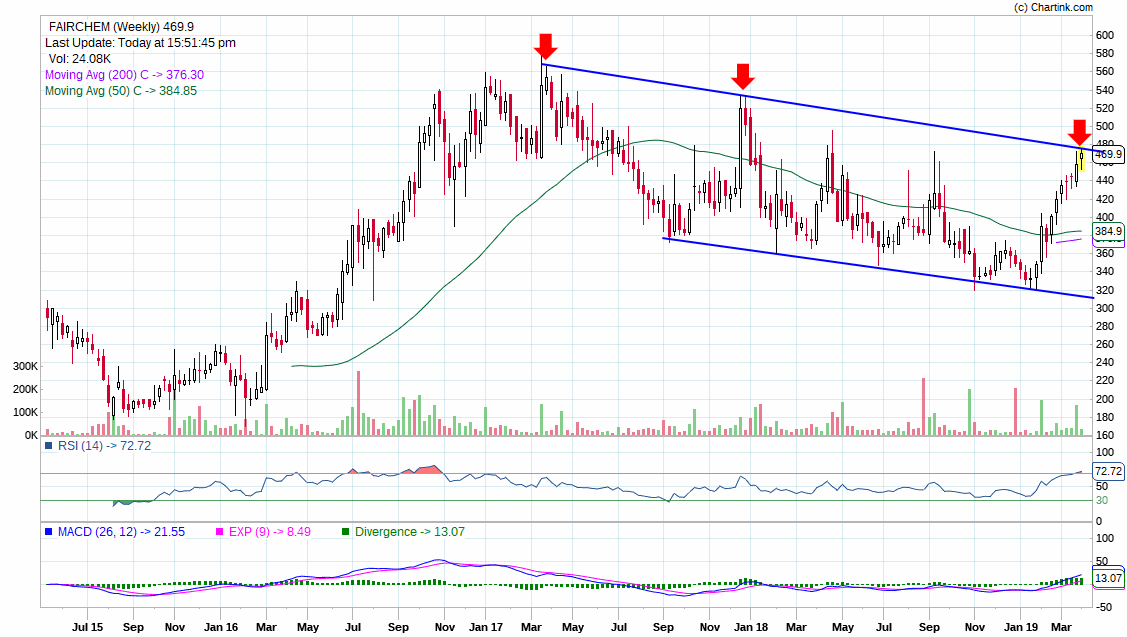
Fairchem - Flag-ish formation. Trading outside two year downward channel
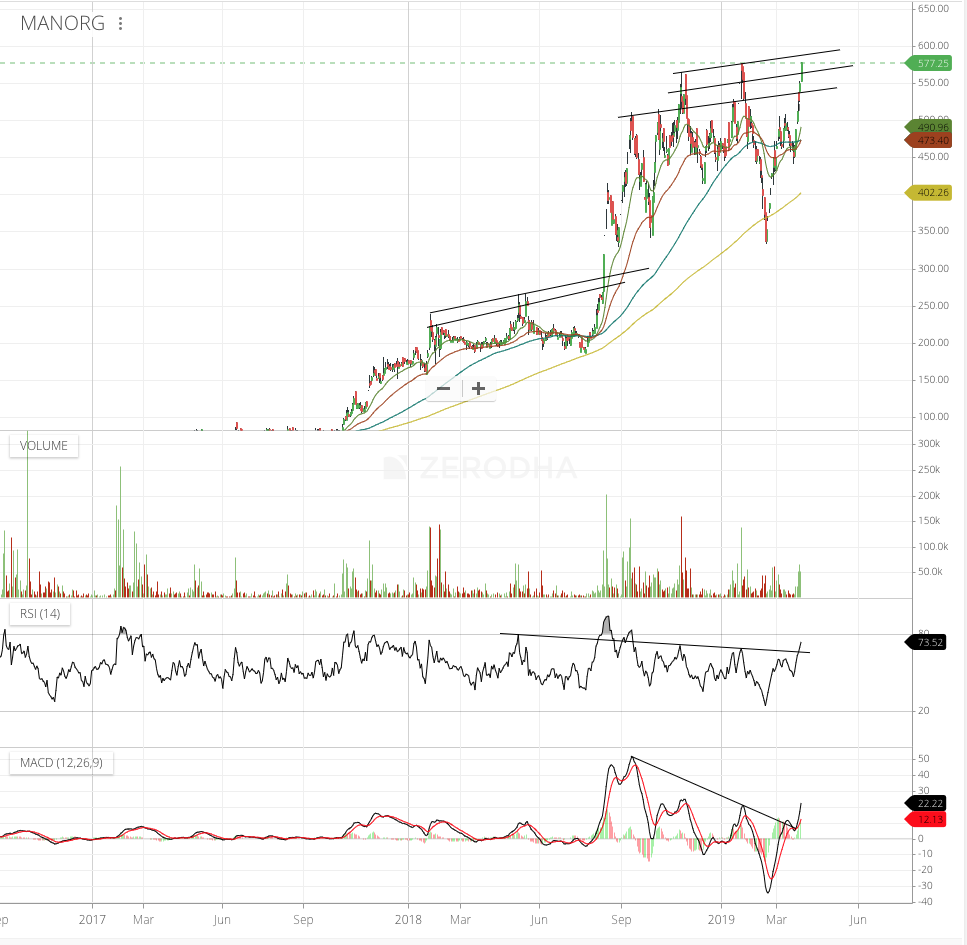
Mangalam Organics - Some similarities in current setup and last year’s big breakout around Aug. Fresh 52 wk high today.
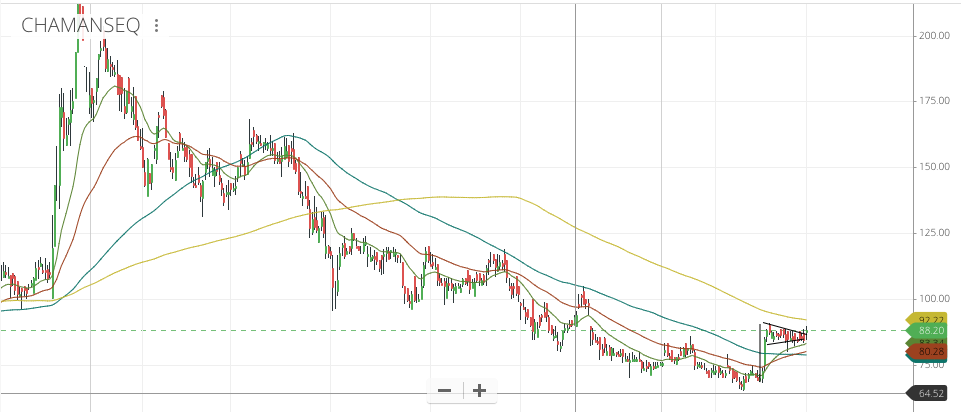
Chamanlal Setia Exports - Consolidating in a flag and breaking out
6 Likes
I think fairchem is near ressistance in weekly. If you see the shadow of candles at ressistance these are simillar in nature.
Looks like the upmove was not real … The trend is still up till 2550 holds but since the risk reward is not in favor I got out yesterday at 2720. No loss no gain albeit little brokerage loss.
Apologies for the late disclosure