Looks like too much bombardment of complex charts in this thread. I would request Hitesh to give his feedback whether thess posts does follow the technicals or merely speculative in nature. Till the above scrutiny is over, this thread ramains closed.
There are few charts where the pattern has not been completed but the poster has optimistically put up the projections of possible scenario. Such charts are to be avoided. So we warn all of you to avoid any misleading projections. Any future violations will not be tolerated. Also we warn all the forum members not to blindly follow the chart patterns and should do their own due diligence of fundamental correlation.
there is another chart i would like to bring to attention of fellow members, which i felt was an interesting development… [will try to start an individual thread on this, since none is there in our forum]
Rajratan global wires…
a autoancillary and a tyre proxy play…
2 products mainly
Tyre bead wire[80% topline] which is used in all kinds of automobile, earth-moving
equipment and aircraft tyres. Its function is to hold tyre on the rim …
and high carbon steel wire.
a market leader in domestic market, with 40% current market share, pre capacity expansion which is planned to come online by the end of this financial year[expansion from 40ktpa to 72ktpa], and partial commission from q2… they also have a subsidiary in thailand, where it it is the sole inland production line, currently enjoying 20% market share[ increasing thailand capacity from 26,000 tonnes per annum to 34,800 tonnes per annum]…
Mention from AR-
1.Exports from Thailand accounted for 45% of
the revenues earned from that country, which could increase by 15-20% in quantum terms during FY2018-19.
2.The bead wire outlook for the Asian market continues to be
favourable. China is rationalizing its capacities in a bid to shrink its carbon footprint.
3.Even as automobiles go through an extensive structural
transformation – from fossil fuel driven to electric variants – we
do not foresee any threats when it comes to tyre substitution,
assuring steady growth over the long-term.
4.Most of our tyre customers are expanding their installed capacities, escalating the prospective demand for bead wire
5.The Company encountered unprecedented volatility on the raw material front: the cost of its
principal raw material increased virtually every month during the year (once on two occasions
within the same month). The cost of wire rods escalated from Rs. 35,300 per tonne to
Rs. 45,500 per tonne by the yearend. In a business where the cost
of raw material accounts for 65% of the total cost of production and where costs can be passed
on to downstream customers only once every quarter, this record increase in costs stretched the Company’s finances, propelling the management to realign its cost structure and revisit its working capital management.
6.With the demand for bead wire remaining robust in Thailand and the neighbouring countries, we will need to raise our production and productivity to service the growing appetite of our
customers. We expect to address this increased demand through concurrent capacity growth and line balancing exercises, some of which were completed during FY2017-18. Due to these reasons, I can safely say that we are wellplaced to report attractive growth from FY2018-19 onwards.
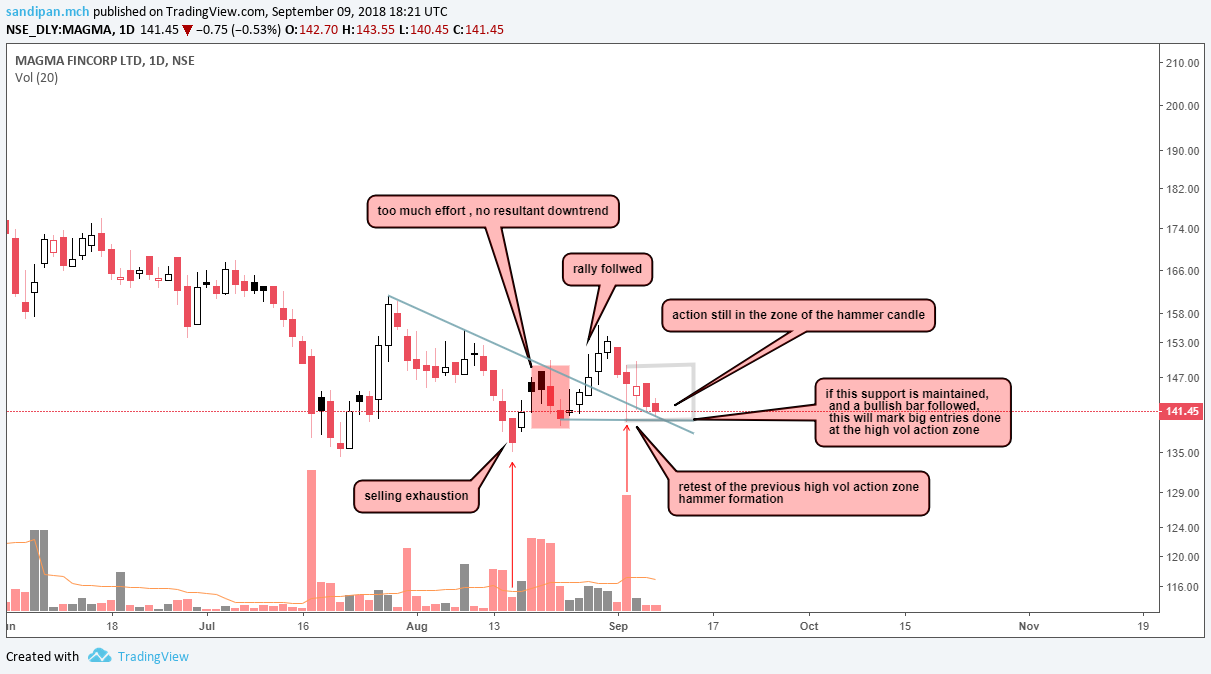
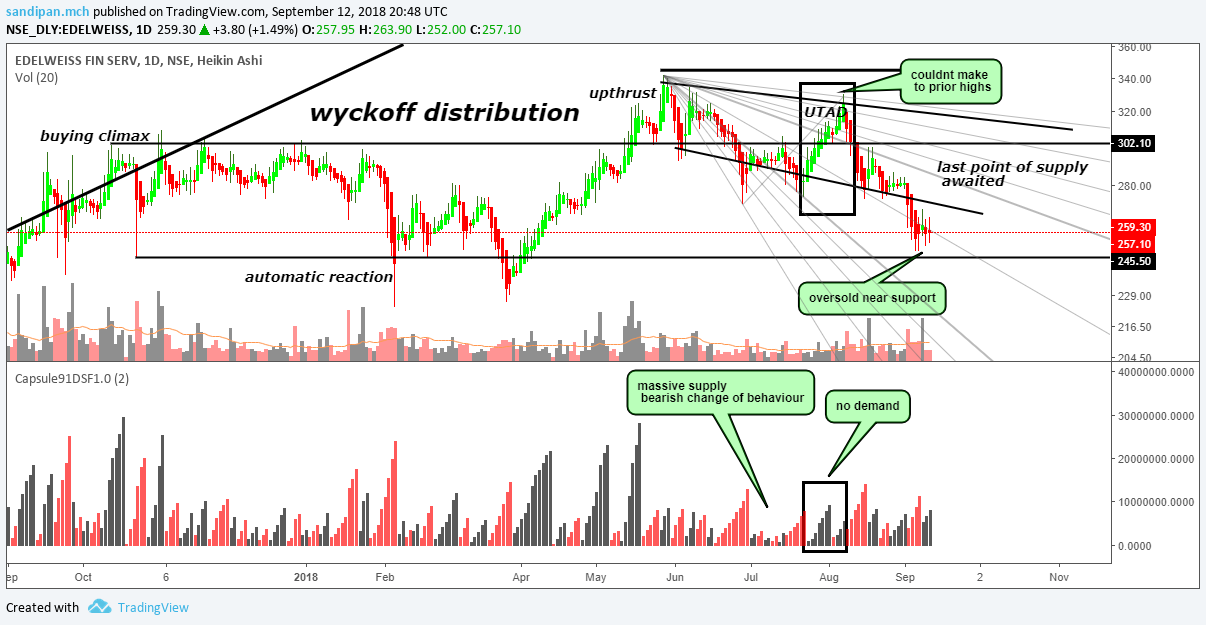
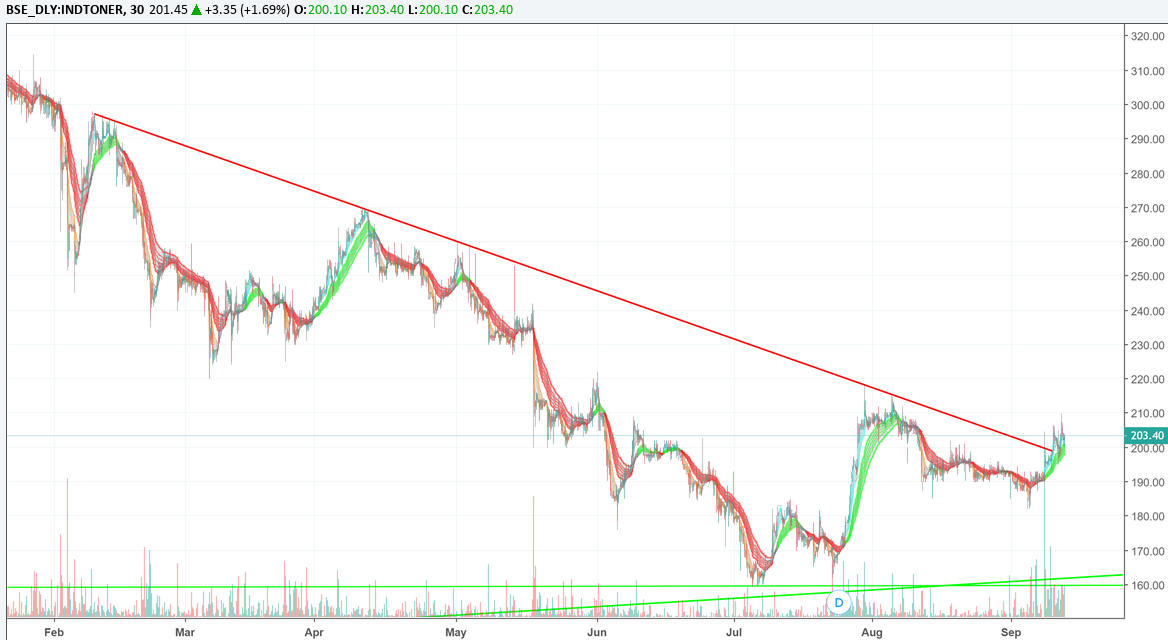
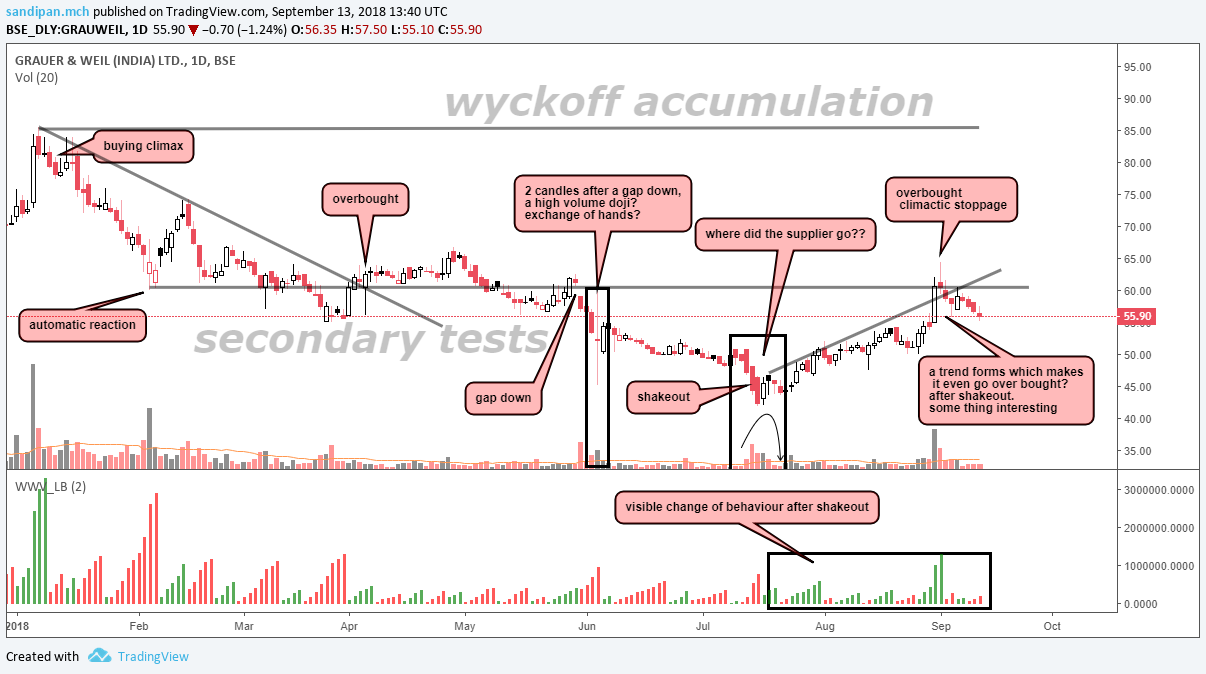
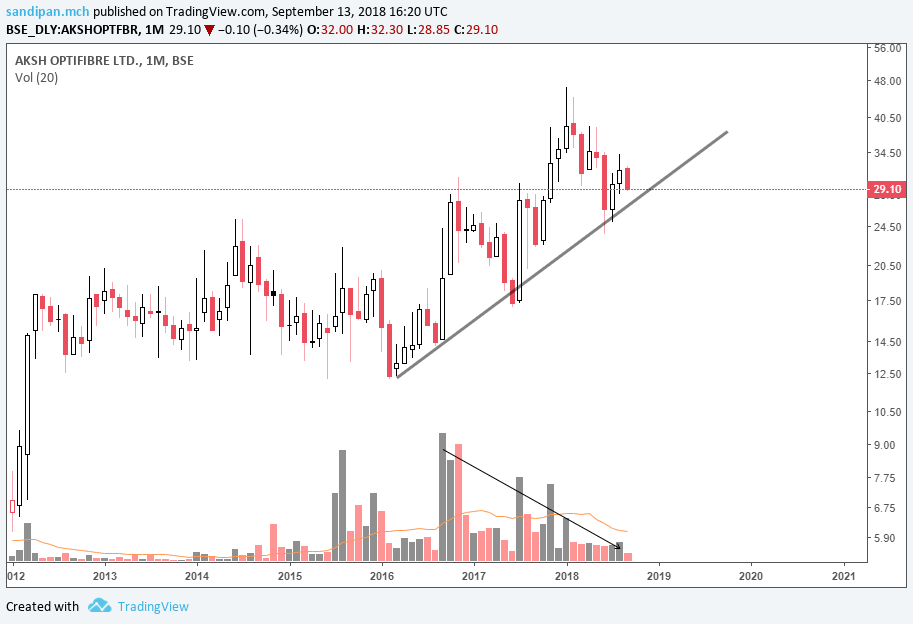
a gross mistake made in the prior post…
which i considered to be an accumualtion , i was looking some where else, focussing more on the activities that happened at the support which seemed like absorption , but totally failed the weaning demand at the top, post result day, i realized this is going to be a bearish kicker pattern that is forming, i booked out, stunned at the events…
the results were per se not bad, and the long term fundamentals still on track…
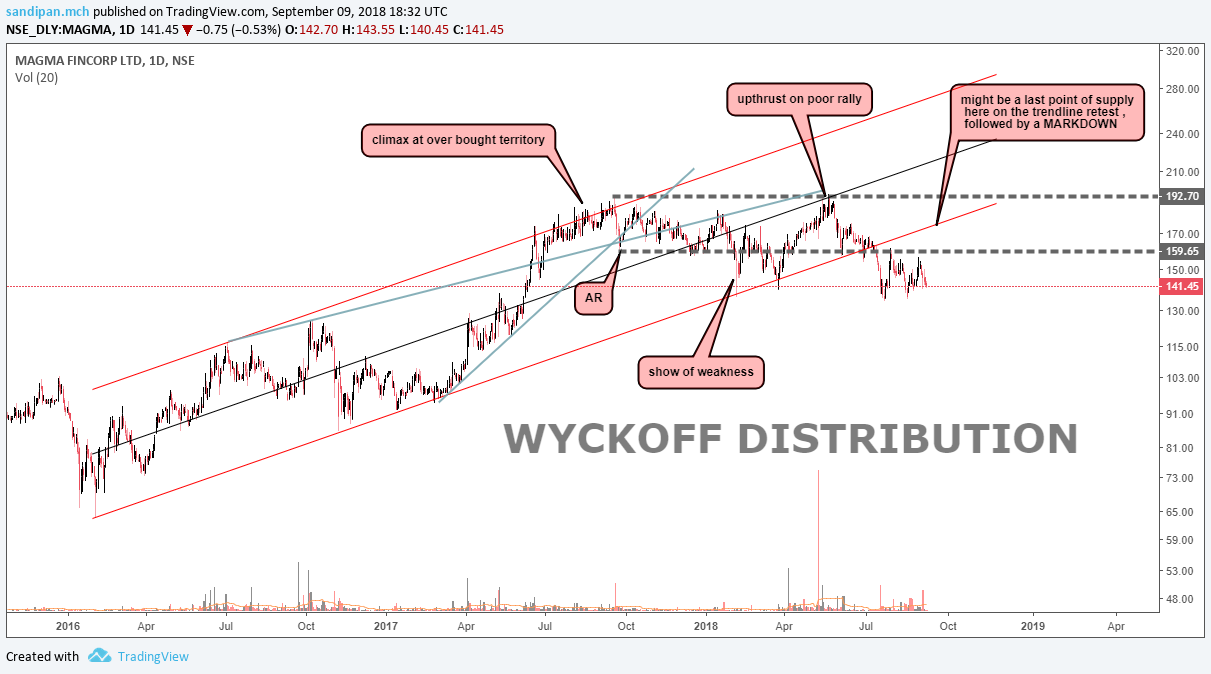
now with the price action in the over sold zone, when i look back it was distribution all along…
entering into phase d from phase c…
there is a possibility of a bounce considering these oversold conditions…
which according to wyckoff schematics, should generate the last point of supply, before markdown…
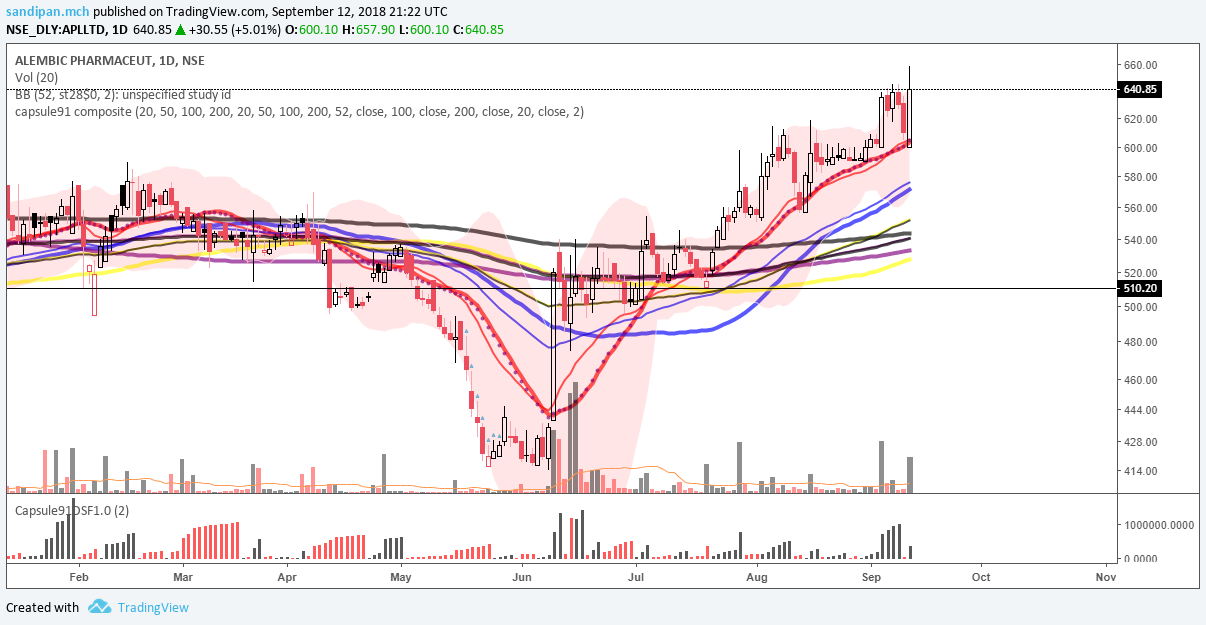
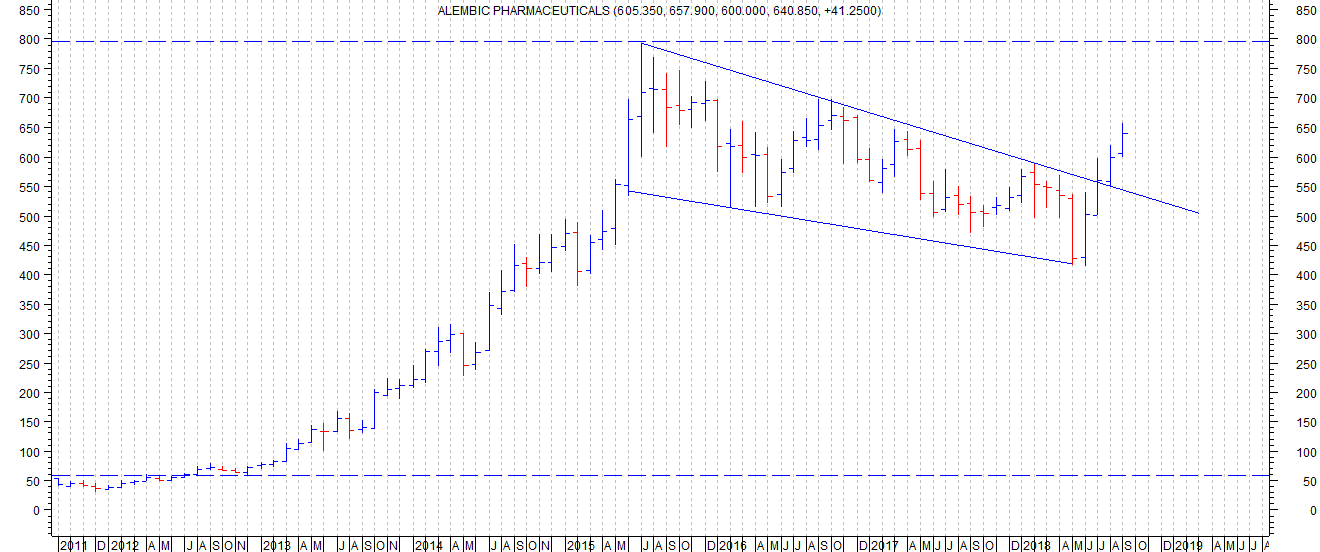
2.alembic pharma
was almost ready to enter into this stock, seeing the constant positive response from the bollinger bands[although i believe pharma as a sector is due a correction, based on impending elliot wave 4, maybe triggered by softening dollar, this stock might go against the cnx nifty pharma]
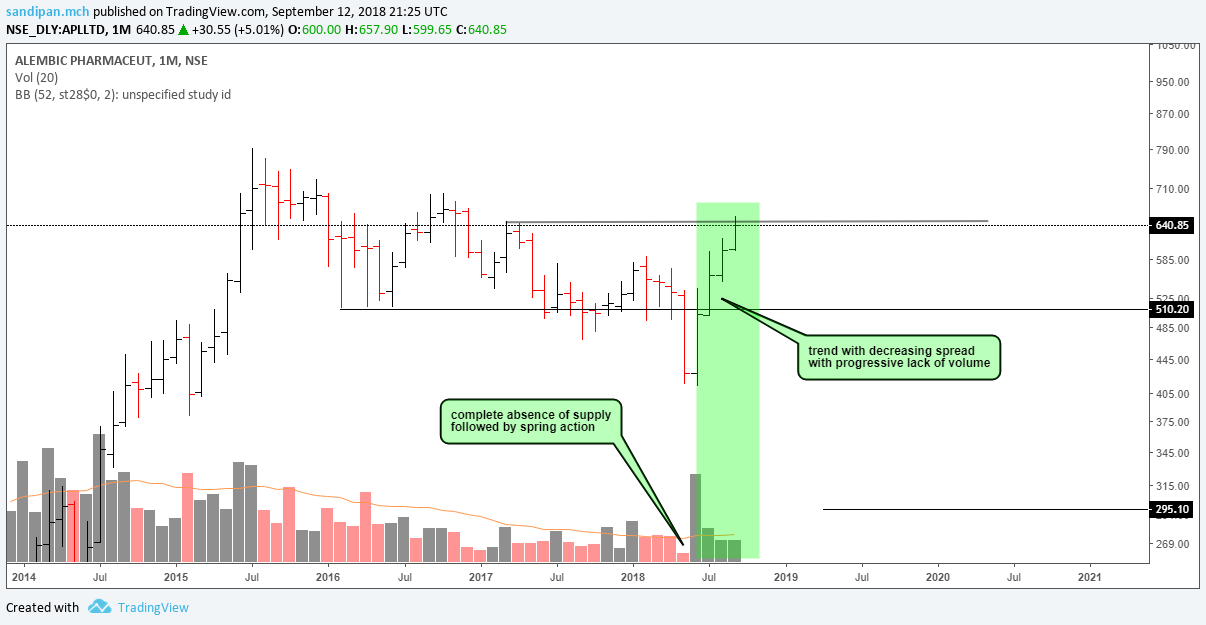
but as i scrolled across the time frame, this picture in the monthly caught my eye and i backed off. thinking it is possible to time the market better later on …
this is a good base formation , but, the decrease in spread of the bars, with declining volume is an evidence of demand weaning off, i want to see if there is any supply that comes in at this juncture and what is the quantum of it, relative to the other downswings prior in this base formation
Current exchange rate should help in higher realization from export
September quarter results have been strong for the company for long time (not aware of reasons behind this)
Promoters stake increased
Successfully completed PIC/S Malaysia inspection for oral liquids and oral powders related to ophthalmic manufacturing facility
Bearish observations:
USFDA recently gave 8 observations in relations to ophthalmic products being exported to USA market which awaits appropriate response of the company to close.
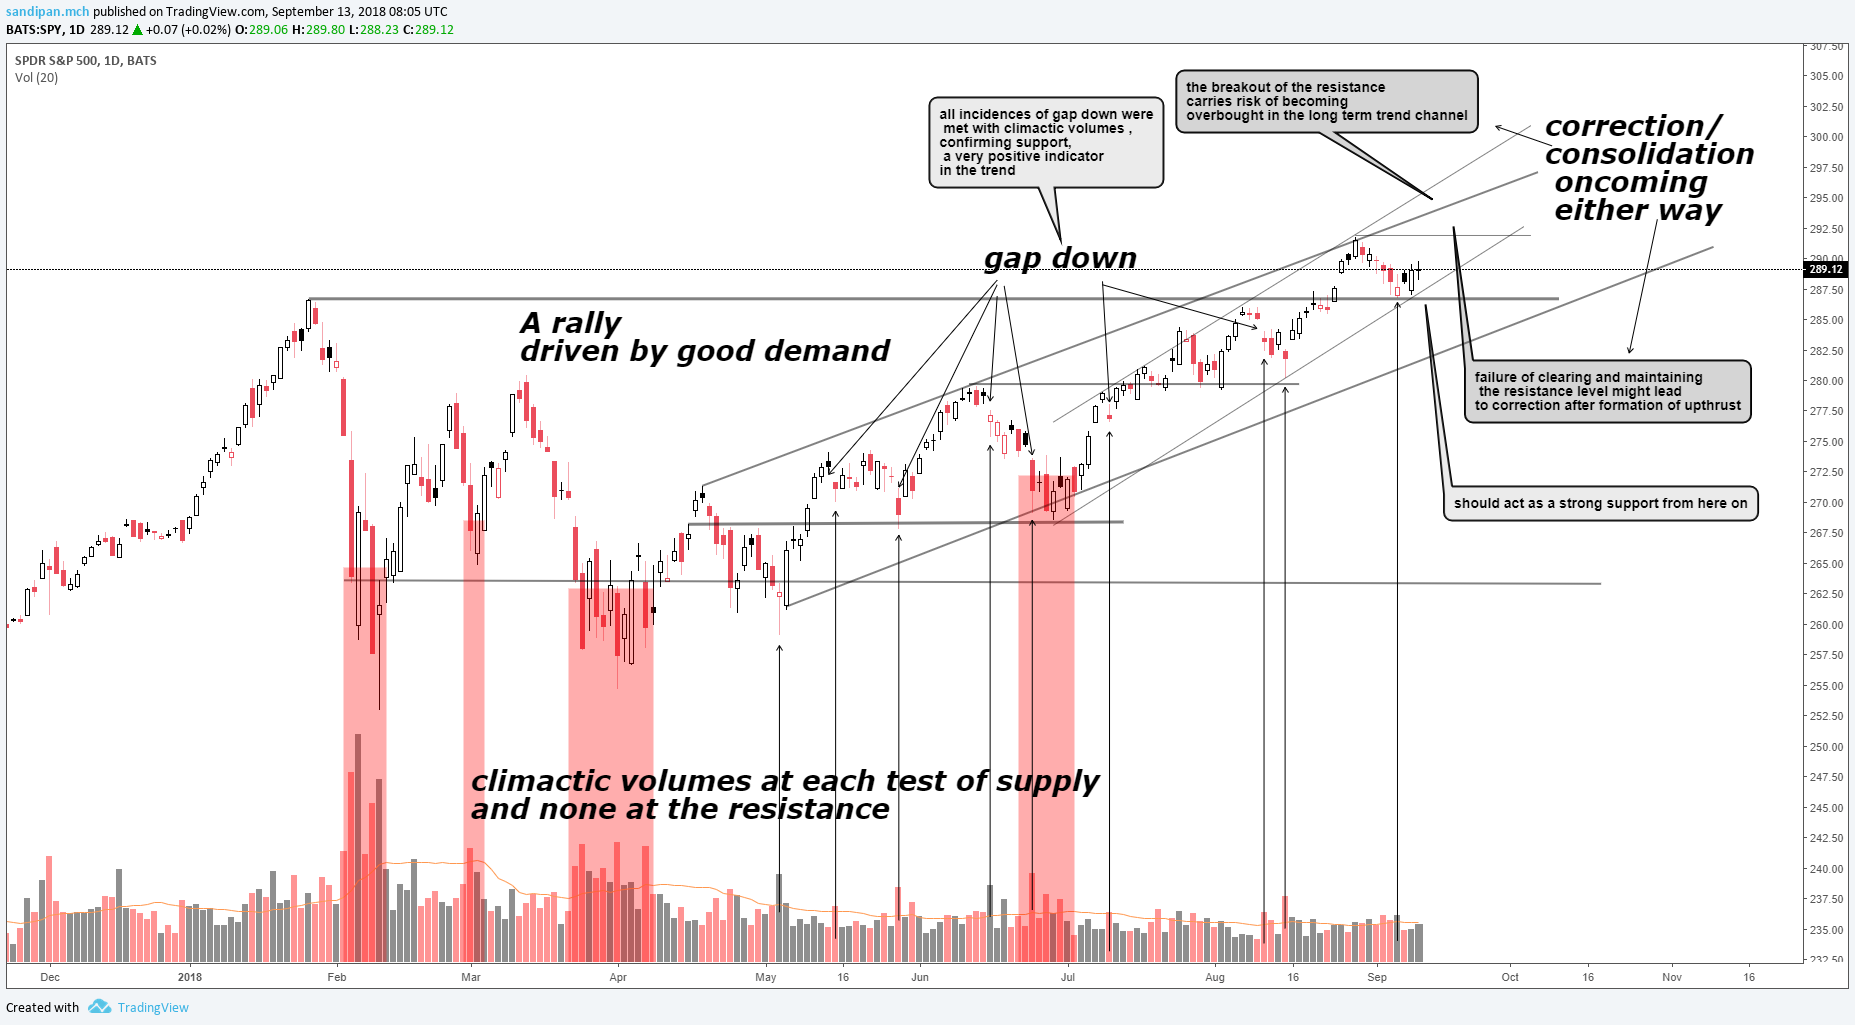
S&p500 headed for volatile times before any resumption of uptrend, either via an upthrust formation or becoming overbought if a true breakout of the resistance is done
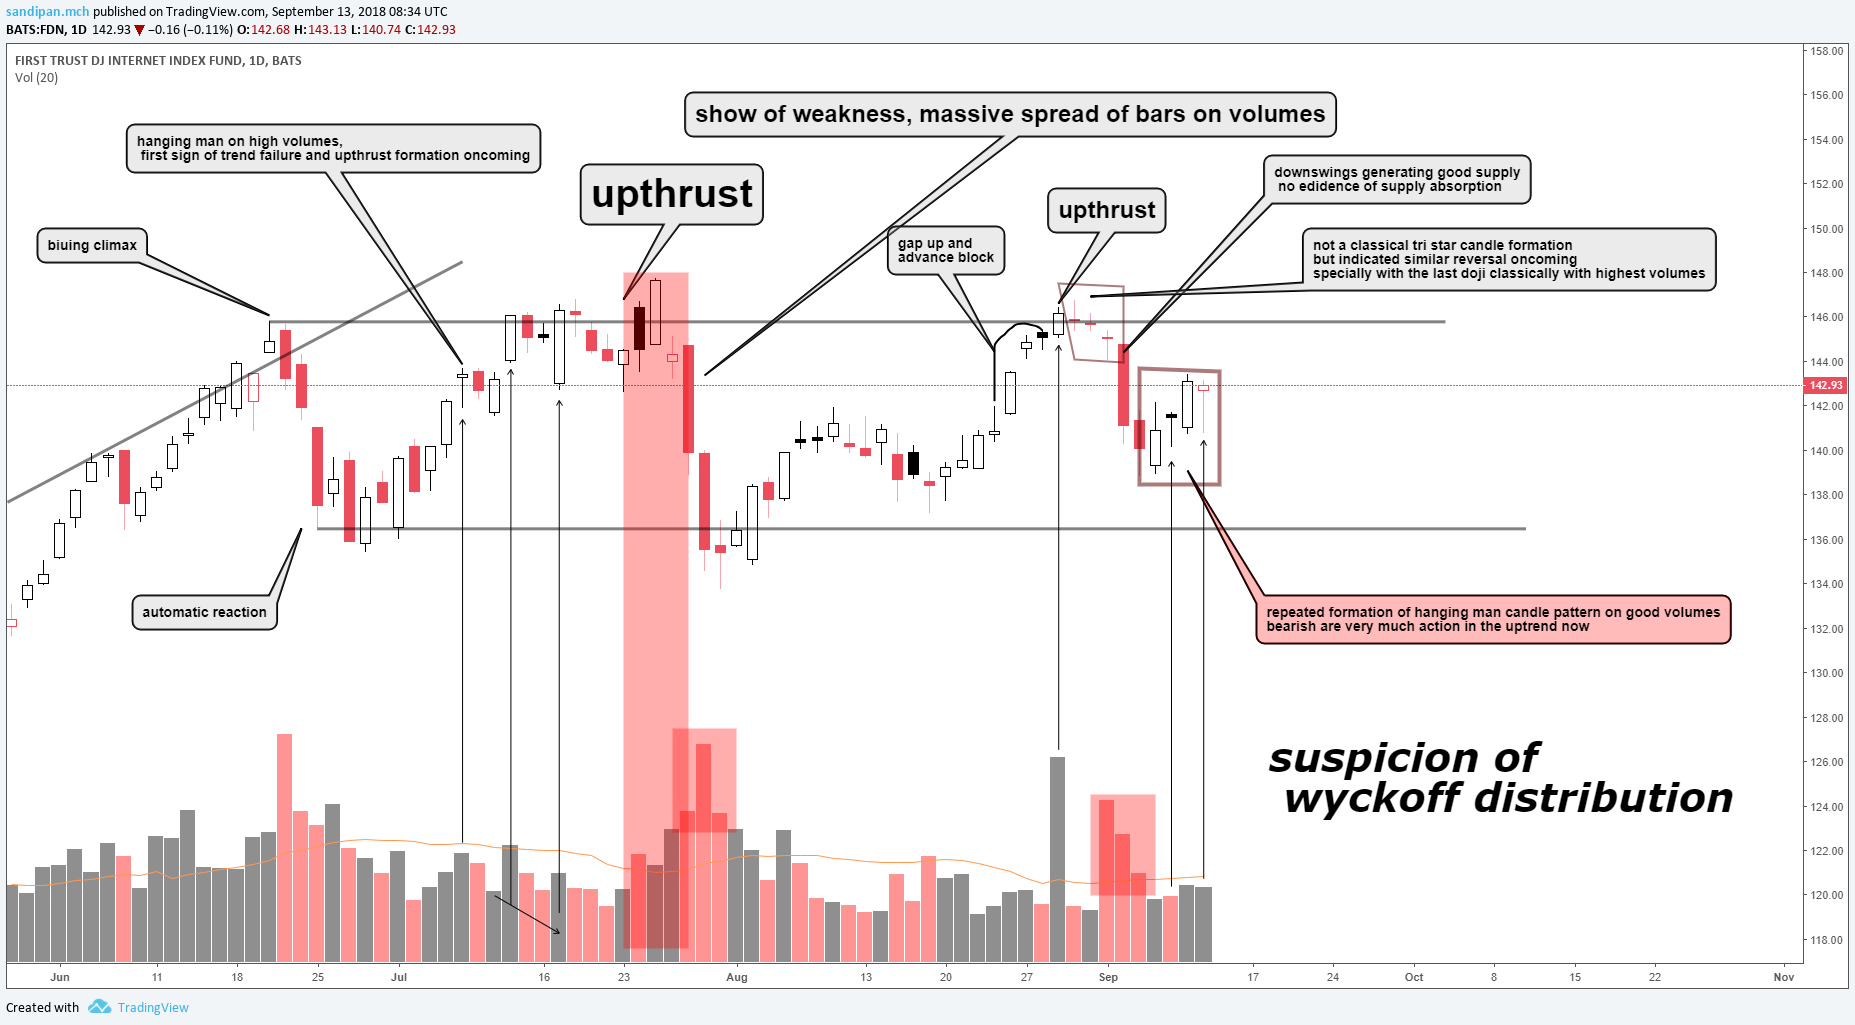
The First Trust Dow Jones Internet Index Fund (FDN) .
A major contributor to FDN performance, were the FANG stocks in this capitalization weighted ETF (AMZN, FB, GOOG, GOOGL, NFLX). Though there are 42 stocks in the fund approximately 35% of the weight is in these five symbols. For the sake of this exercise lets assume assume that FDN is our imperfect proxy for a FANG index.
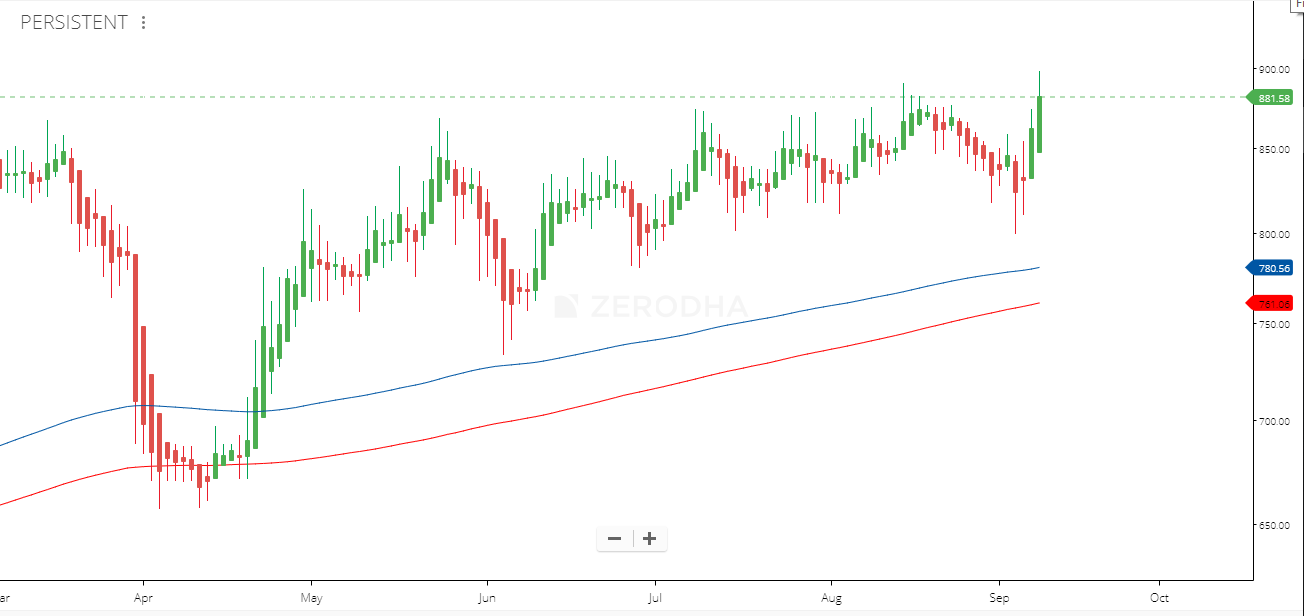
interesting developments
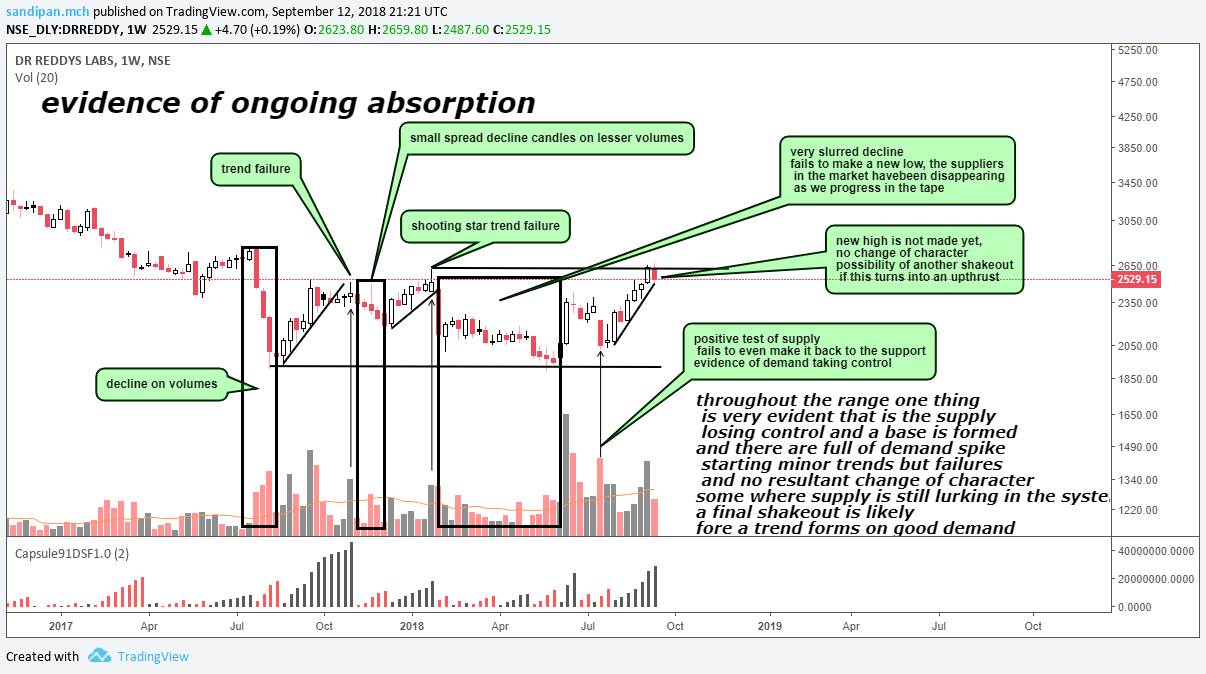
although the change of character across the gap down broken support has not been seen yet and faced a climactic stoppage at the attempt , a base might be forming, there is enough evidence of accumulation as mentioned…
Alembic pharma long term chart shows an interesting flag/pennant like pattern on monthly time frame. After a stupendous rally from levels of 60 in 2012, stock went to post a high of 750 plus in 2015 and then went sideways into consolidation mode. The correction was more of a time correction with valuewise correction of only 50% retracement showing inherent strength when all around it was falling like nine pins. Now it has broken out of the consolidation in the form of flag/pennant.
These are longer term monthly charts and daily variations can be there based on market based newsflow etc. But over longer term if pattern plays out it could give quite decent returns.
While looking for good long term candidates we want to look out for stocks displaying strength in the form that even while correcting they dont give up much while undergoing timewise correction.
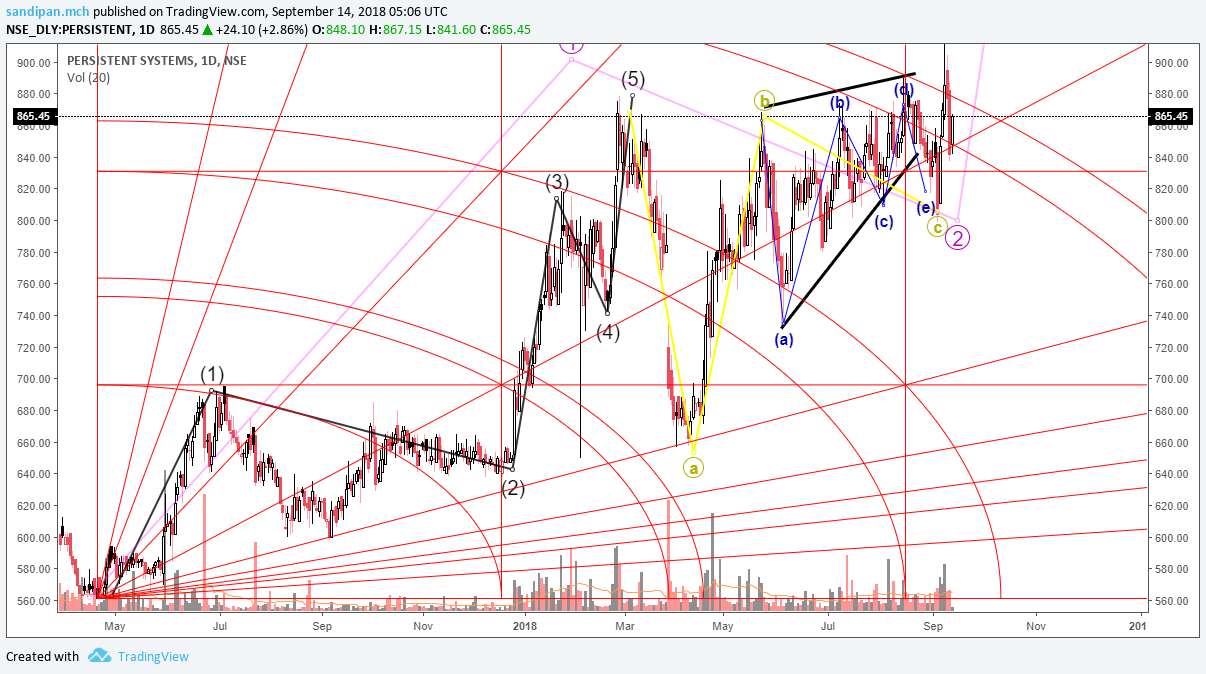
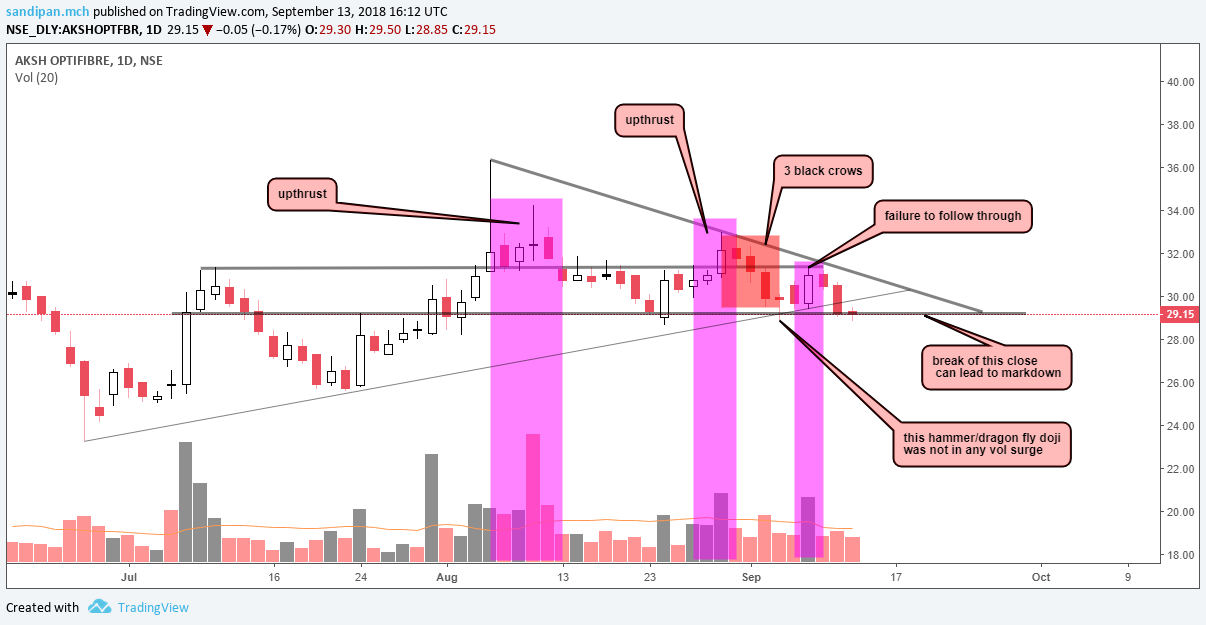
sir, i am backing off from entry into the current price action looking at the decrease in spread of this bars…
i mentioned this dilemma in this post of mine…
can u please share how do u look at the present trend, or it would be better to wait for any minor correct/retest of supply?
[the 3 black crow candle pattern/3 identical crows is not classical in the fact that the first candle was of a slighly smaller spread than the other 2, but since it was coming down from an upthrust and high volume, i would comfortably call it so, as the underlying sense of the pattern seems to be working, the following demand bar even failed to make a higher high on good volumes]
there has been no show of significant demand after the downswing…
in the daily picture… its more of a equivocal picture, although the supply seems to be dominant enough to emit upthrusts , but the higher low formation tips the scale away from the bears a bit, the support trendline although broken, the price forma very small spread candle at a support level…
new few sessions should be vital in deciding the trend
Regarding alembic I think since its a monthly time frame chart on daily movements it will offer good entry points if it keeps fluctuating within a range. But overall on monthly time frame it looks like the trend is gradually changing from sideways to maybe up. Still needs to breakout above its previous high to be absolutely certain.
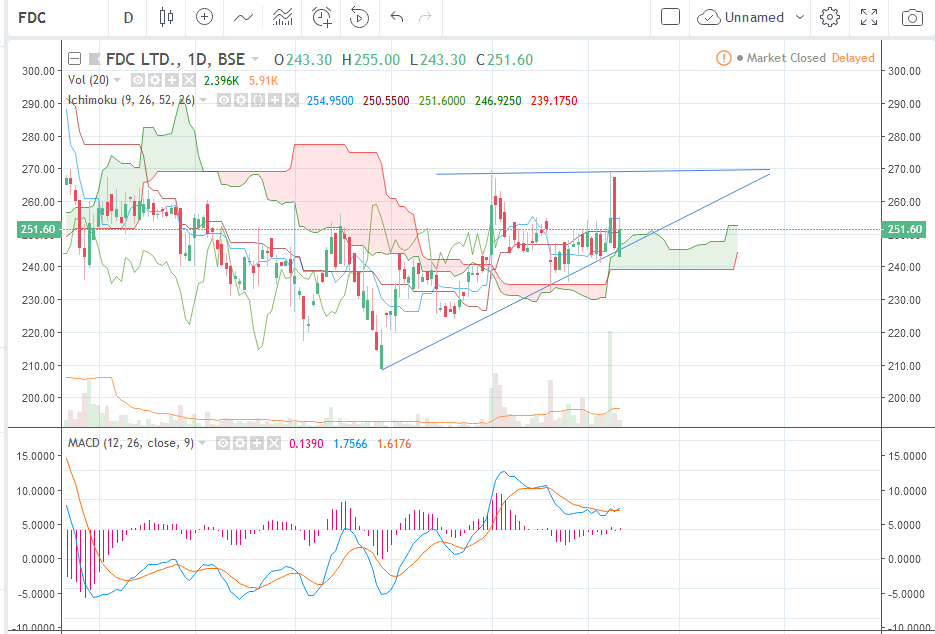
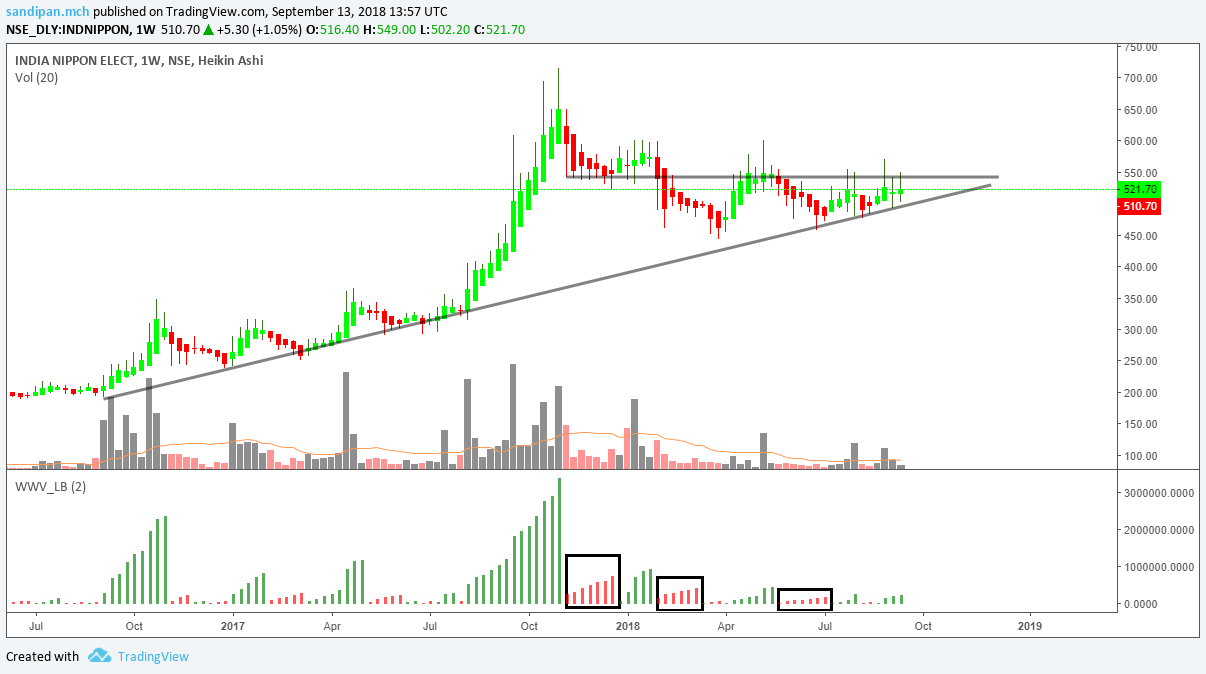
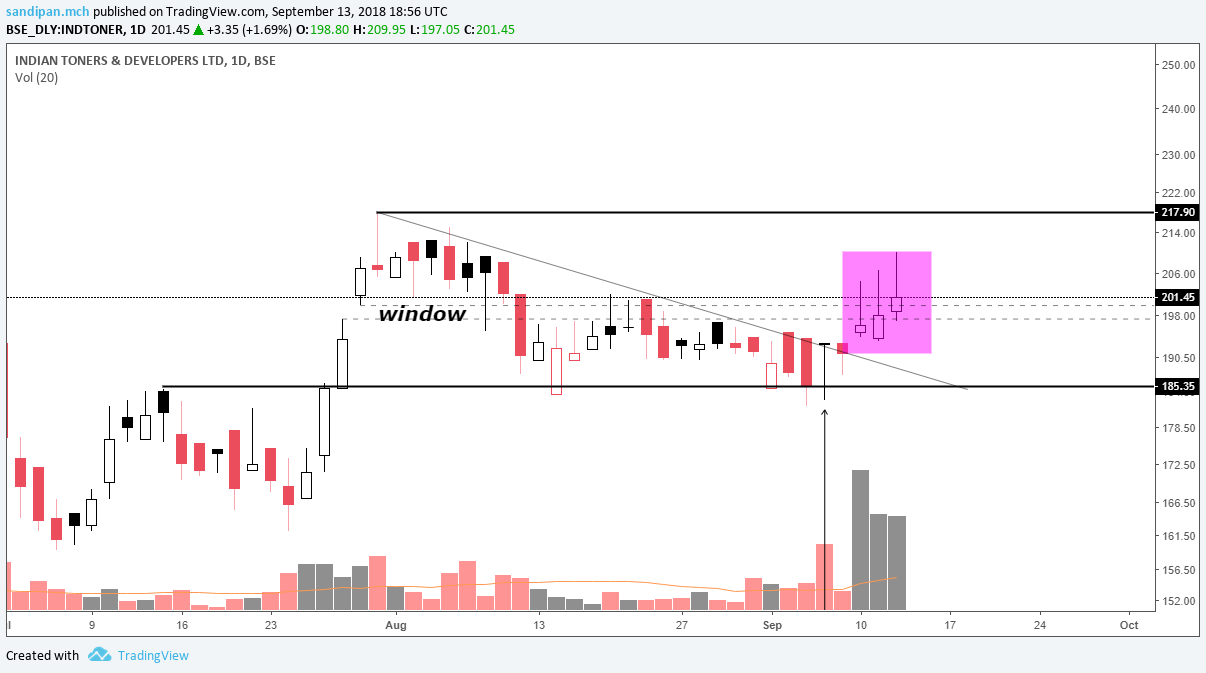
although there are a couple of good things in this chart, it would be a bit too early to call it as a break out , unless 217 is taken out by a positive closing
although there is change in character, across 185, as it has been tested 2 times, second time with a bigger volume forming a dragonfly doji, confirming support
the local supply line also broken out…
but i noted, there has been a window, which is also acting as a resistance…
and i wonder, why all these huge volume offtake, and no resultant movement in the price, maybe because of the bearish broader market
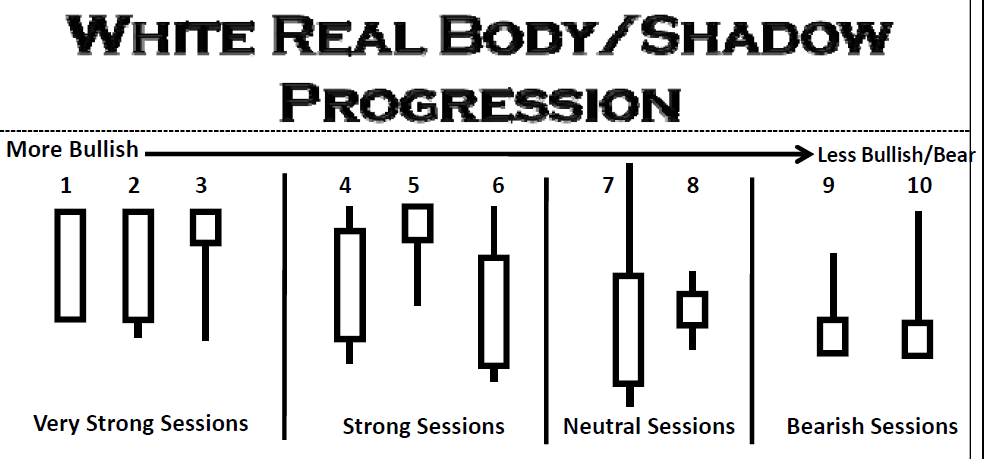
[infact the price is stuck within the window, and is generating upwicks, the resulting candles are actually the weakest of all bullish candles as described by nison]…