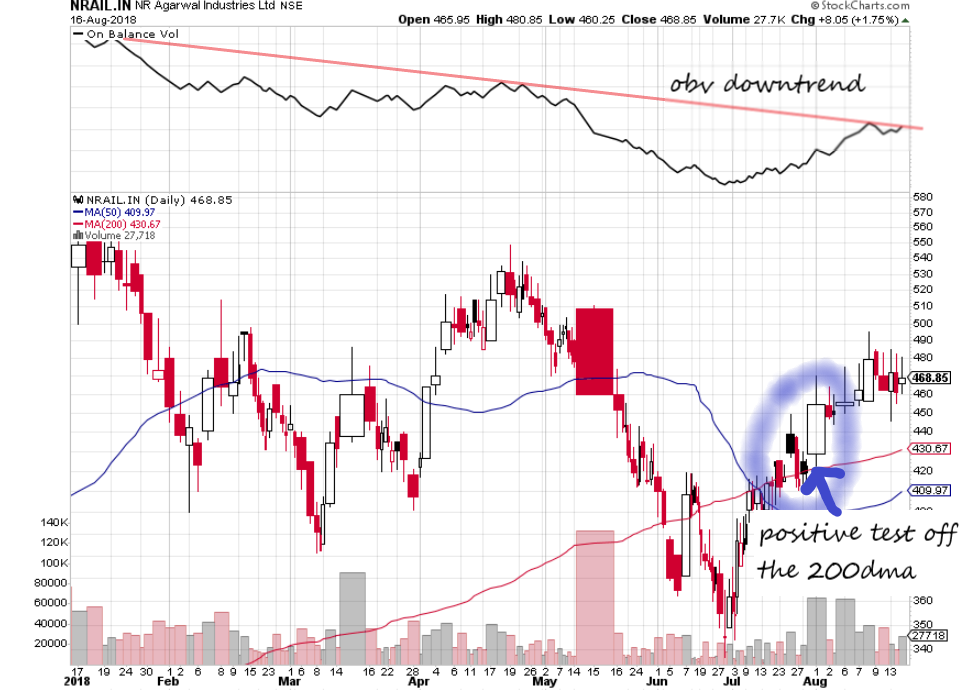
there is something to note in the on balance volume, which seems to be a bullish behavior to me…
looking at the bigger picture there is every reason to believe this is accumulation…
there is something to note in the on balance volume, which seems to be a bullish behavior to me…
looking at the bigger picture there is every reason to believe this is accumulation…
@Capsule91 @phreakv6 @PE_Ratio @manivannan.g and others.
Nice initiative by you guys on this thread. But one request, please post distribution patterns, breakdowns too, which, I presume, are also plenty now a days, so that we are able to comprehend both sides of the coin and decide accordingly.
A trade is neither a permabull nor a permabear. He has just one friend - the trend.
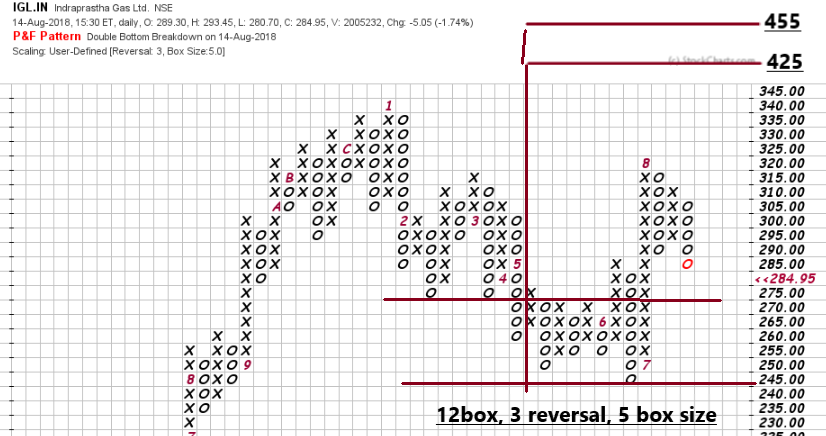
Indrapastha gas…
interesting chart…
notable is the anemic volume off the downswing~19million shares transacted so far and comparing with the previous downswing volumes, the absorption of supply that has occurred in phase b is visible, and this comes after a bullish change of character in phase c…
the volume candle chart …
point and figure calculation of rotation point
The management aims at maintaining EBITDA/scm at Rs6
and pass on any rise in the cost of natural gas to consumers
disclaimer… no current positions
@Capsule91
Any inferences on Suven after numbers?
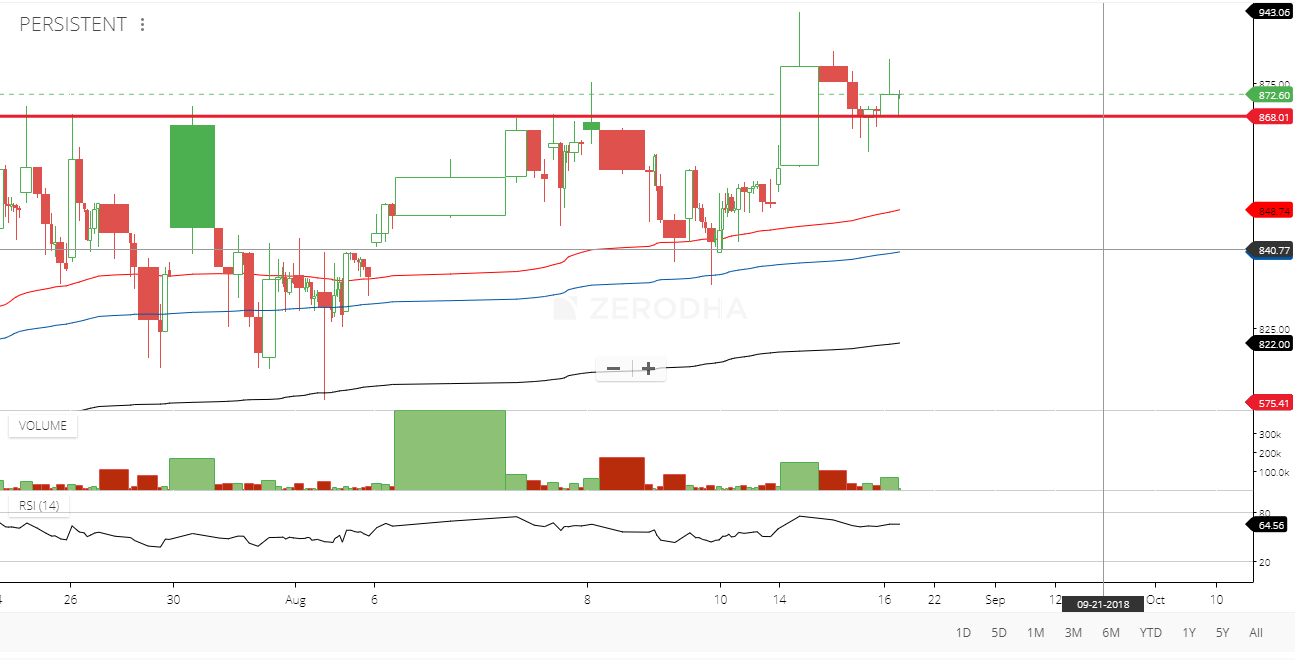
persistent systems…
868 opening after more than 3 years
last time it did such an opening was early march, 2015
hope it holds the level to breakout…
quick heal…
supply drying off
disclaimer… have positions on both the stock
RENKO CHARTS. PREDICTION, ACCURACY, USE.
COURTESY. Mr. Praveen Pathiyil, Executive Director, Pentad Securities Pvt. Ltd.
speaking at Finbridge Expo 2017- Mumbai
Hi sir, how does chart of NR Agrawal industries look
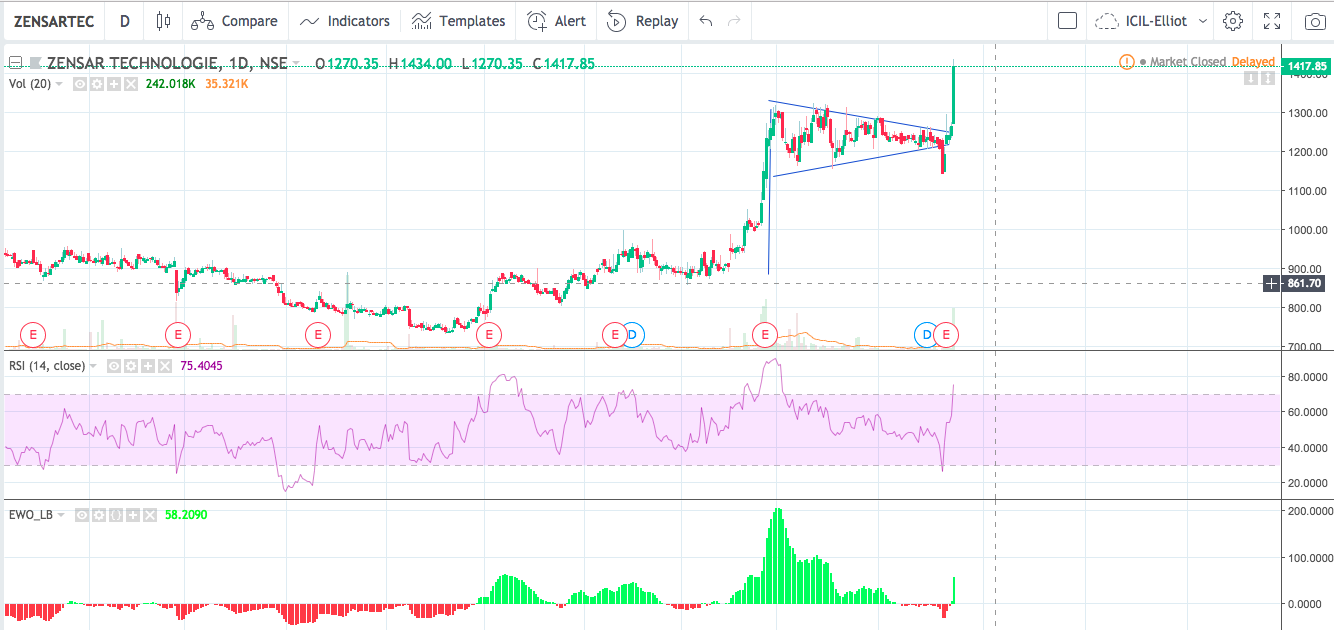
There was a fuzz about zensar and upon checking, a perfect flag has been broken out. A nice shorterm movement expected.
Minda Industries, forming a bottom around 420 range and the handle of the cup also looks like a flag from the bottom of the cup. There’s a bullish divergence in RSI.
Pale Greenlines: Cup and Handle pattern
Blue lines: Flag pattern
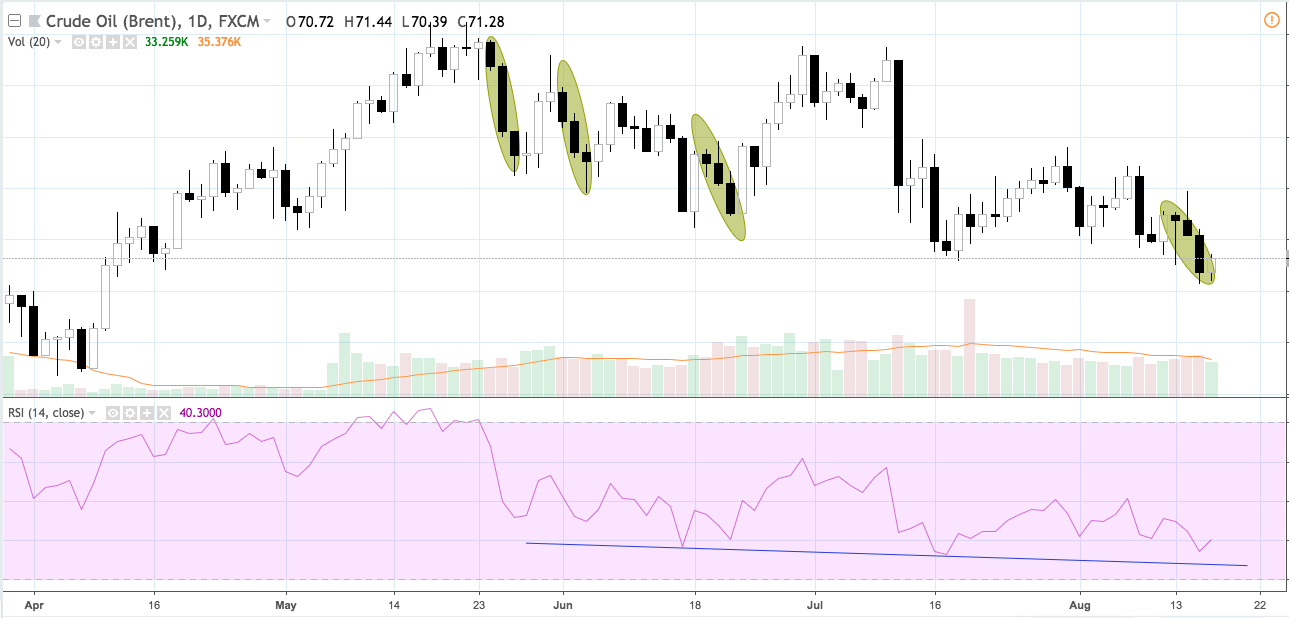
Crude shows bearish signal.
Why ? We have a pattern called “the three black crow”. Most of the time, three black crows appear near the top and if they post new lows from the top, indicates clear bearish.
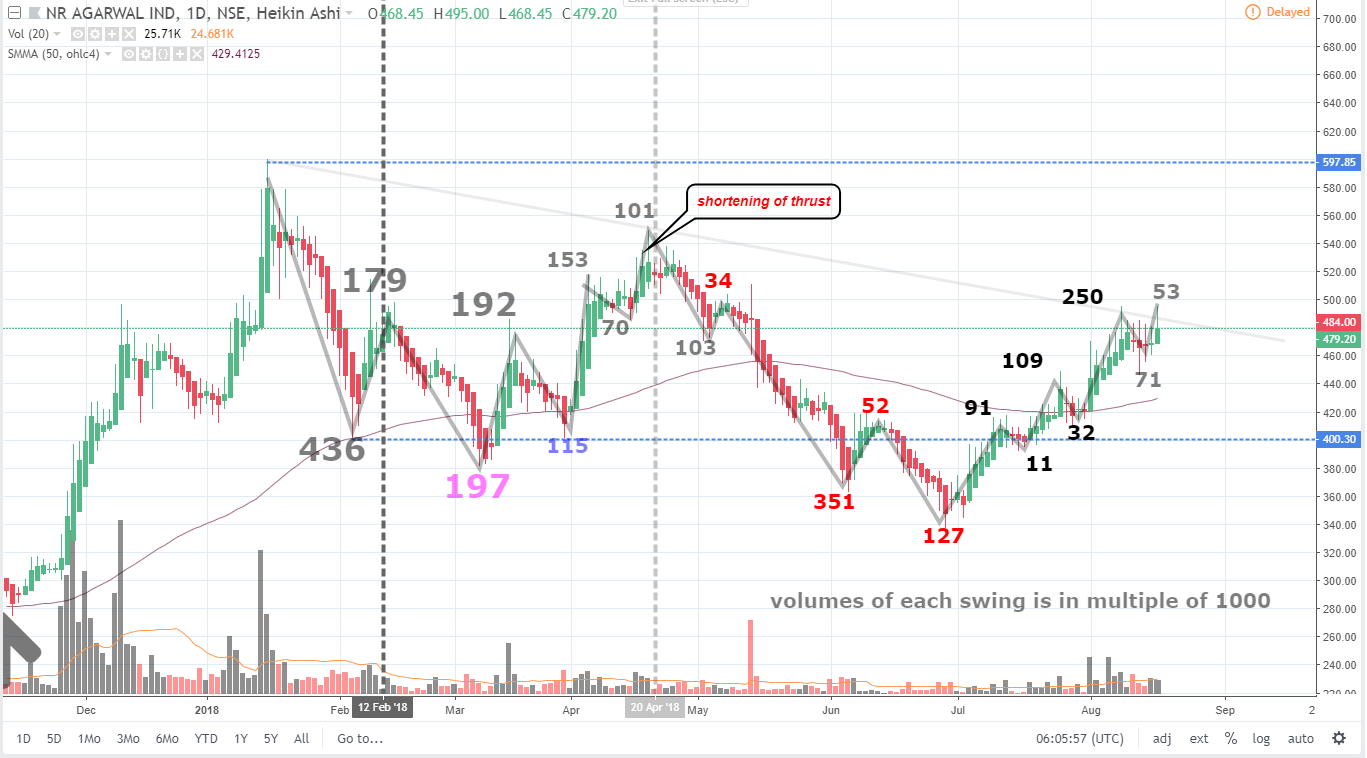
NRAIL…
chart is highly suggestive of accumulation, but it seems like there is a lot of supply still persisting in the system and the composite group might go in for more shakeouts…
another event that looks positive in this rally, is there was a test of 200dma breakout and the test was successful on good volume candle…
personally, looking at the volume candle chart [above] the present rally’s character looks unsatisfactory to me, and i doubt if all the supply has been absorbed or not…
it will be a key to see where the current rally terminates and then the supply levels generated off the bigger pull back…
that would give more idea about the supply persisting in the system…
then again, that test off the 200dma on volumes, was a bullish sign…
disclaimer… no positions
SBIN…
i have been following and trading sbi chart for sometime now…
and this is a lovely case of base formation
there were 2 tests as mentioned, and both of them were positive, specially the 244 to 37 million drying off , of the volumes in the downswing was a screaming case of buy…
there was a very high volume stopping action which generated only 120 million in the supply, whether it was climactic or not, we will soon know… for now, it is holding the previous high as a support for 2 days now, and last day was on pretty good volumes…
what happens from now, here, is anyones guess, but only the brave hearted will open new longs here…
if the support holds, the next upswing will be critical , as there is very high chance of a buying climax on shortening of thrust to form after the present stopping action… maybe followed by a distribution [ psu banks have consistently been pump and dump chart and the last 3 quarter sbin results are not encouraging enough for a bull market campaign to launch from the operators…]
disclaimer… trading positions
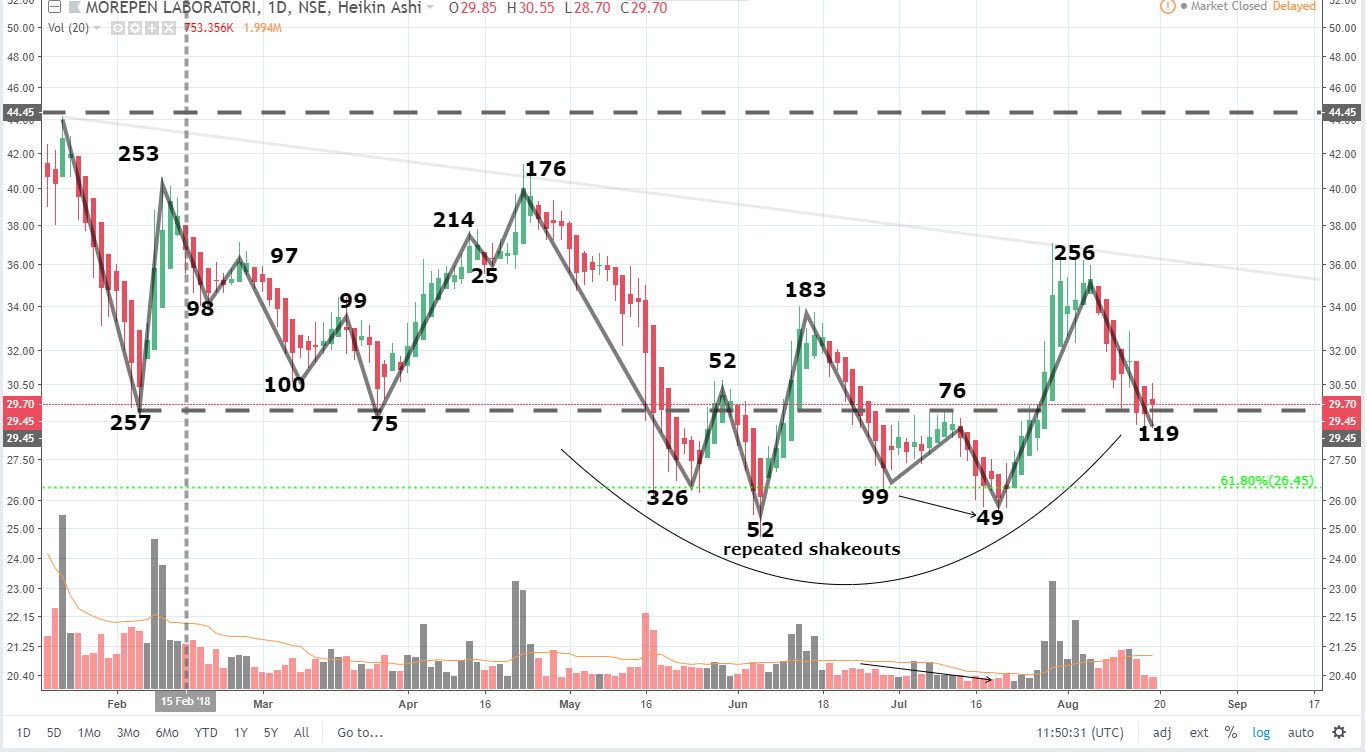
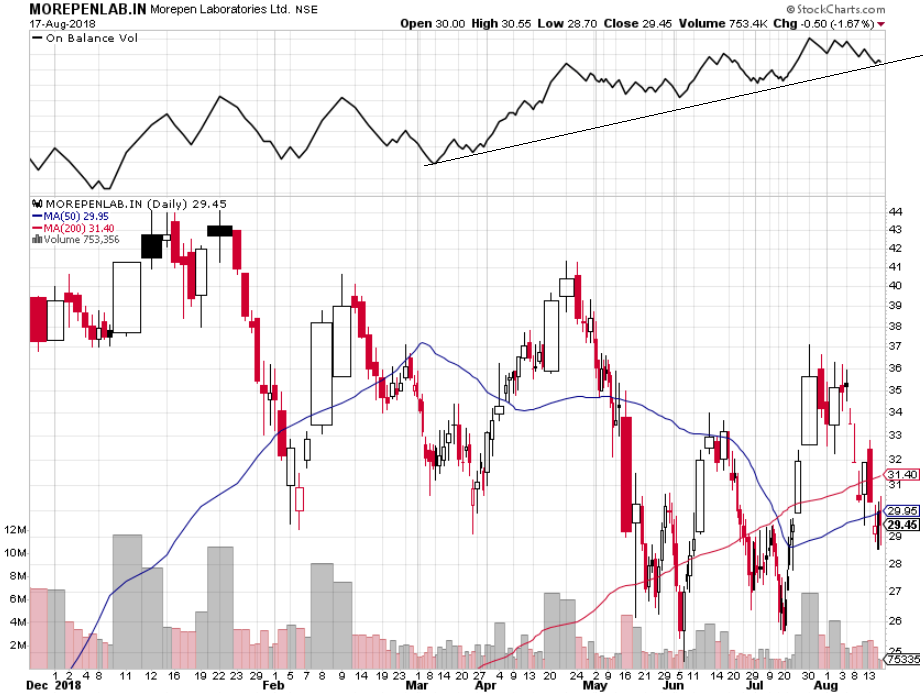
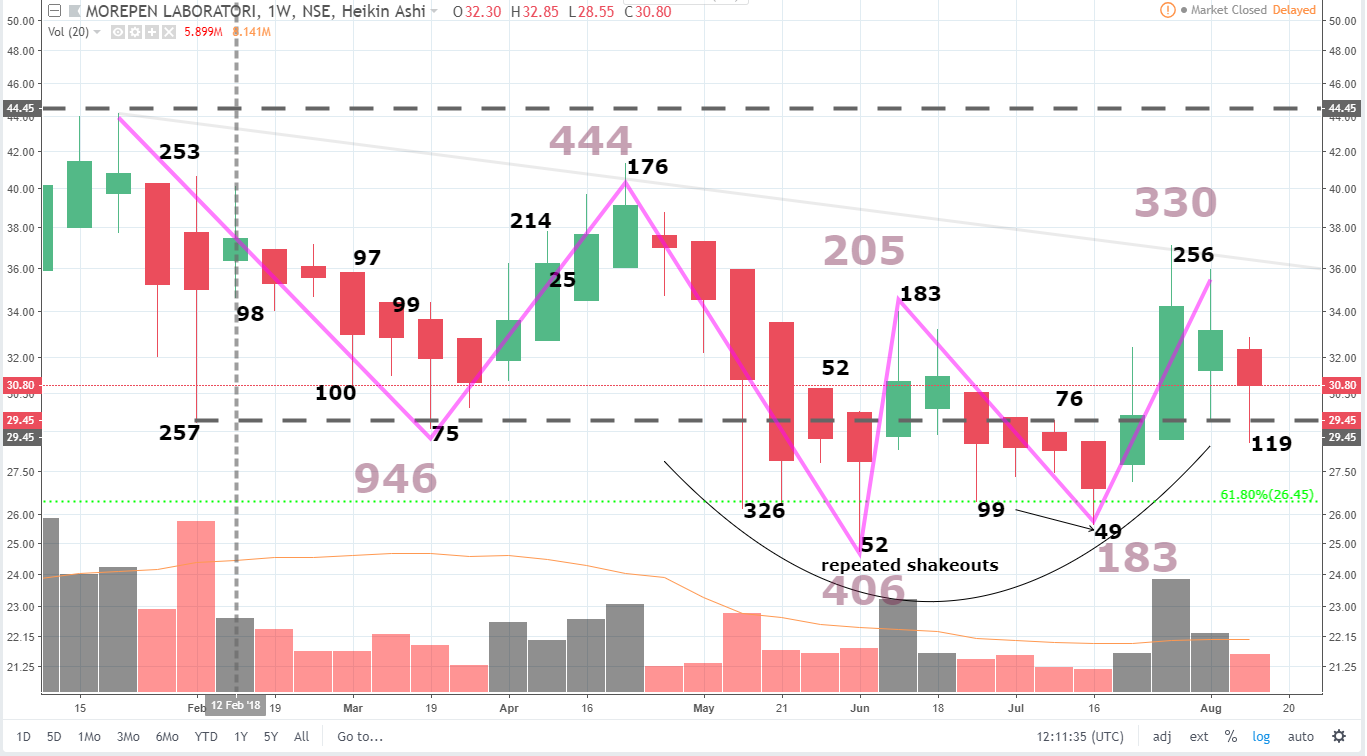
morepen labs…
weekly swing volumes
disclaimer… tracking , no positions
bajaj finserv
reaccumulation on a bull flag
TradingView Chart
supply absorbed on the last downswing at much lower volumes…
vols in multiples of 1000 shares
2 ascending triangles of my pf…
https://www.tradingview.com/x/fMp2ubXe/
https://www.tradingview.com/x/m1D7WZl0/
persistent is already in markup, so the momentum generated will be significant
suven is still in phase d of reaccumulation, so it will begin markup after breakout…
piramal in phase d of reaccumulation, forming the last point of support
continuation of the previous schematic post…
exited positions on the run up to sign of strength, will re enter after lps formation is complete
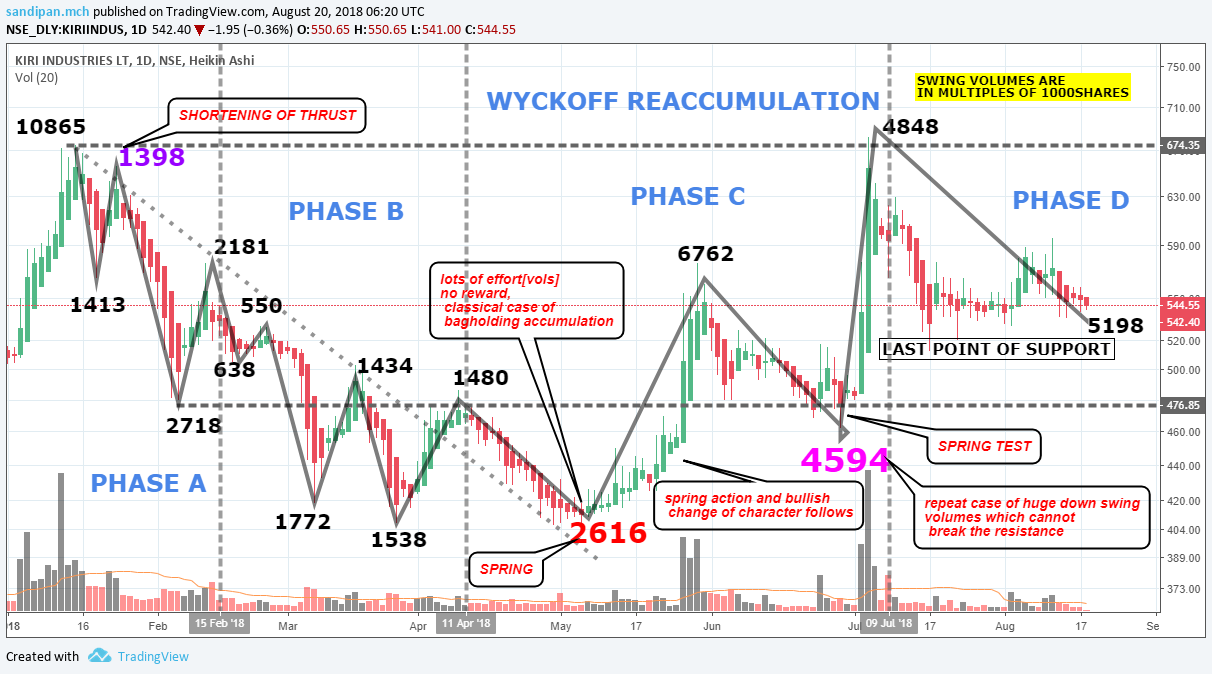
KIRI INDUSTRY…
another case of wyckoff reacumulation in phase d forming last point of support
no positions yet…
HEG…
the scrip was a classical case of wyckoff reaccumulation a couple of months back,
but now with the markup objectives reached, point and figure chart showing gross rotation, now the footprints of the operators looks very much like distribution…
disclaimer… i have started closing my longs in this scrip , will be looking for upthrusts in phase b to close more, hence my views can be biased…
[quite interestingly , graphite india chart dosent show any of these features yet… also i am finding the chart is a bit lagging, which is not surprising a GI always used to score lesser using relative strength, and the point and figure chart do not show any rotation and the markup objective has not been reached as yet… nevertheless, the price action fell out of the uptrendline today… definitely a bearish change of character ]
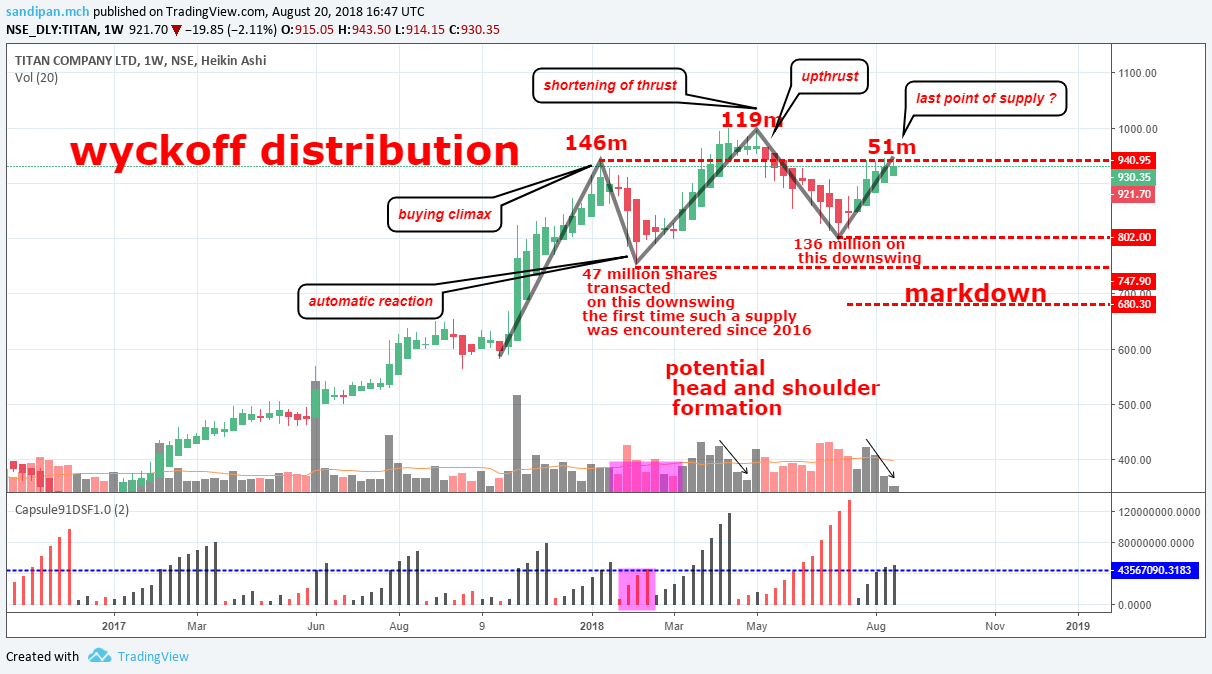
TITAN
continuation post…
the action corrected and bounced off the 802 level which was an important support on confluence … and it looks like a head and shoulder more now than before…
evidence of distribution on upthrust which was actually shortening of thrust on lower volumes , and backed by heavy show of downswing volumes…
the case can be made using the wyckoff’s third law effort vs reward , that the massive second downswing with 136 million share transaction failed to produce a new low and maintained the support at 802…
in that case this might look like a reaccumualtion and the downswing supplies are being absorbed…
and we shall never know for sure until markdown/markup begins…
but considering the numerous divergences in mathematical indicators, and the climactic stopping of the trend by a heavy downswing generating a buying climax and a automatic reaction, followed by the the upthrust…
this is to me, seems like the composite operator is trying to keep the price floating high and distributing the shares to the retail without triggering a downtrend[markdown] until they are done…
the probable right shoulder might turn out to be a last point of supply…
i will take the side of distribution being the more likely phenomena going on, rather than reaccumulation…
its almost funny, most of the broker houses have given a long target on this scrip in the last few months, except hdfc which has recently changed stance to neutral…
i remember, in himadri specialty how brokers were ultra bullish on their publications , all hitting the news feed of the retail right when it was doing the upthrust before markdown began…
disclaimer… no current or prior positions, not interested
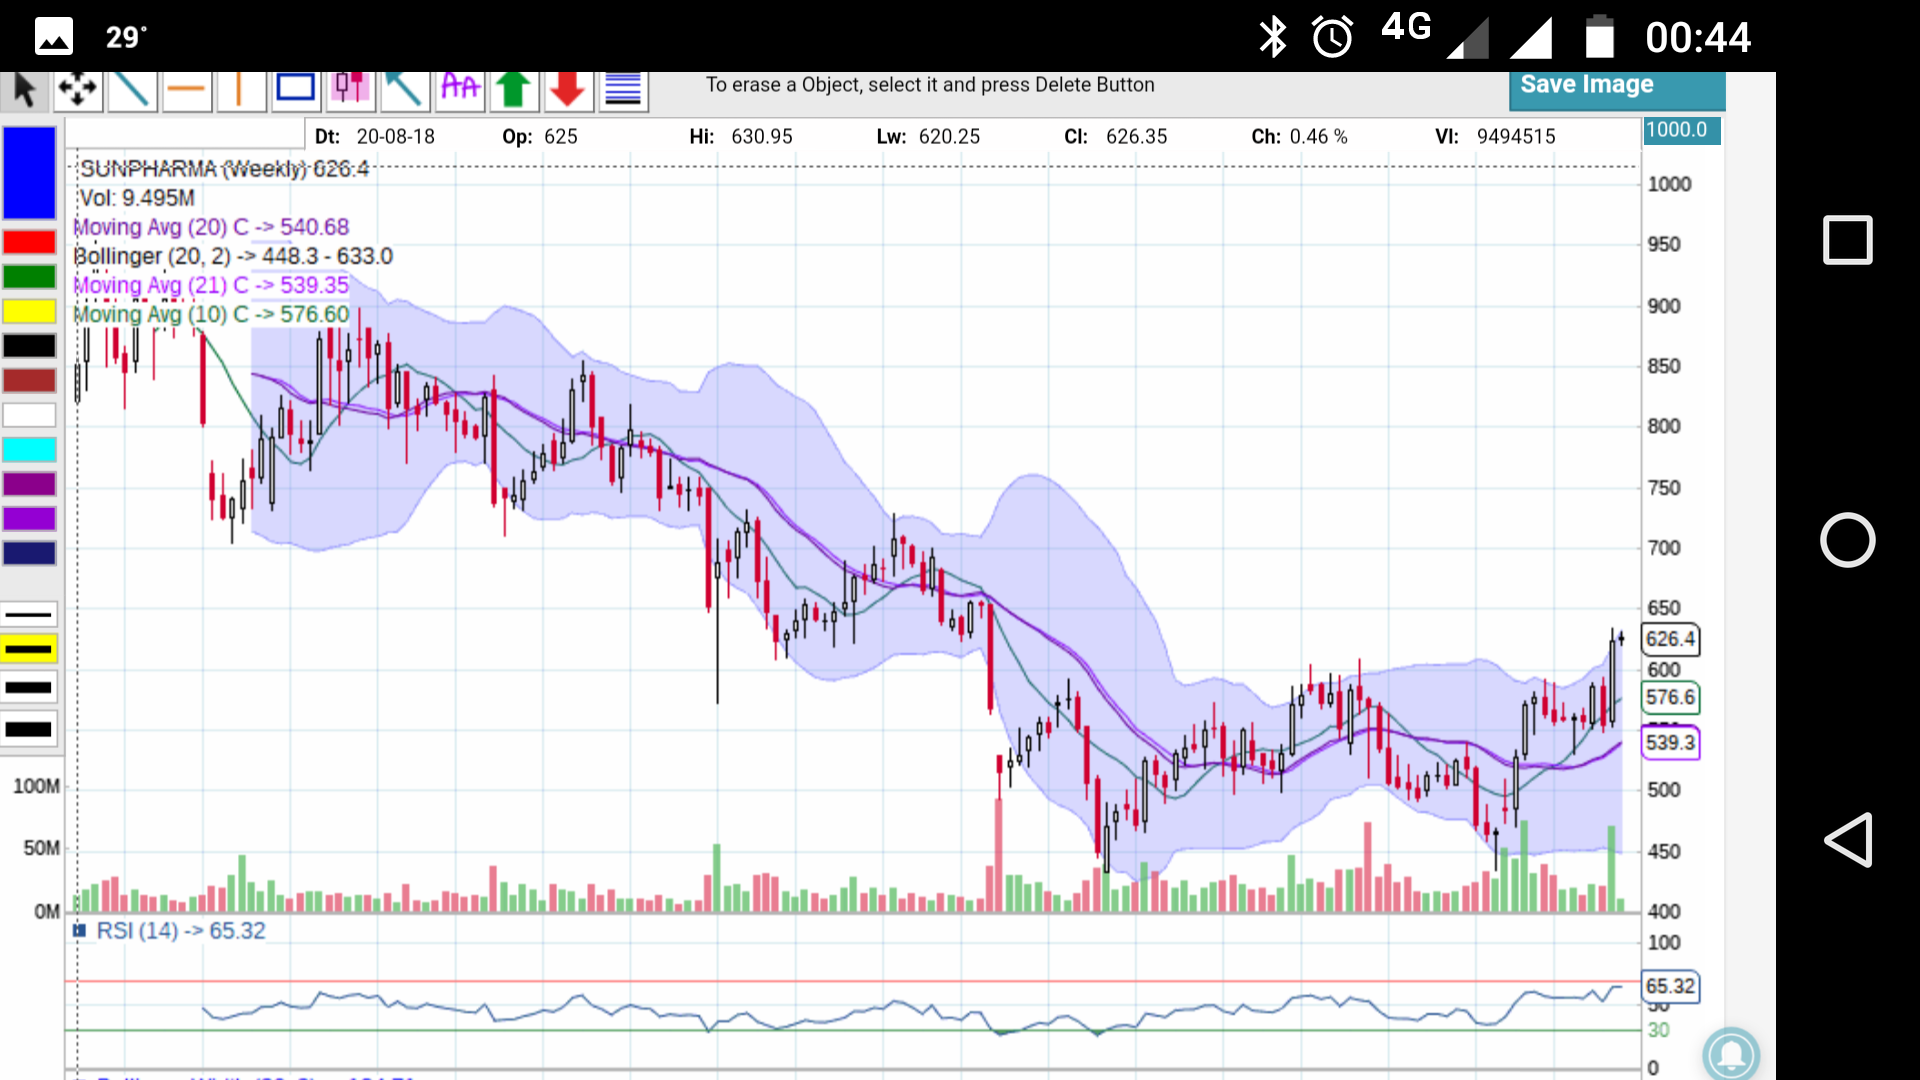
i was going thru the charts of pharma stocks and sun pharma stands out in the pack. It has broken out or multi year resistance trend line both on the weekly and daily charts. The price action from here might be swift and targets are likely around 750. The stock price can test levels of 590 or so and that should be kept as stop loss. My experience says that such moves have quick follow up and the uptrend is pretty sustainable.
Planning to go long around levels of 610 or so …Target 750 time frame # a month
suven shaking out the retail before breakout??
https://www.tradingview.com/x/jvwXBcp3/
the shakeout seems to have ended at the 50dma[blue MA] which started the rally leading to the flag on the previous run
disclaimer… added more longs of the scrip in the flash dump, early morning