Tata Motors chart is an interesting chart according to Elliot Wave theory. Here’s what Ramky Ramkrishna mentions in his book Five waves to financial freedom about Simple corrections -Flats.
A flat correction is a horizontal correction that occurs between two impulses. Like all corrections this wave also is made of 3 waves. The wave A in a flat is made up of just 3 waves. This by itself signals a lack of strength to correct deeply the prior impulse wave. Wave B inherits some of this characteristic and ends near the start of Wave A and unfolds in 3 sub waves. Once B is completed the Ensuing C unfolds in 5 subwaves but once again unlike wave C of a zigzag this wave C will finish at or just beyond the terminal point of Wave A.
The most important clue from the preceding paragraph is when you see a move back to the start of an initial 3 wave correction you should get in the habit of labeling it as a flat correction. This would mean the end of Wave C is unlikely to go much beyond the bottom of Wave A.
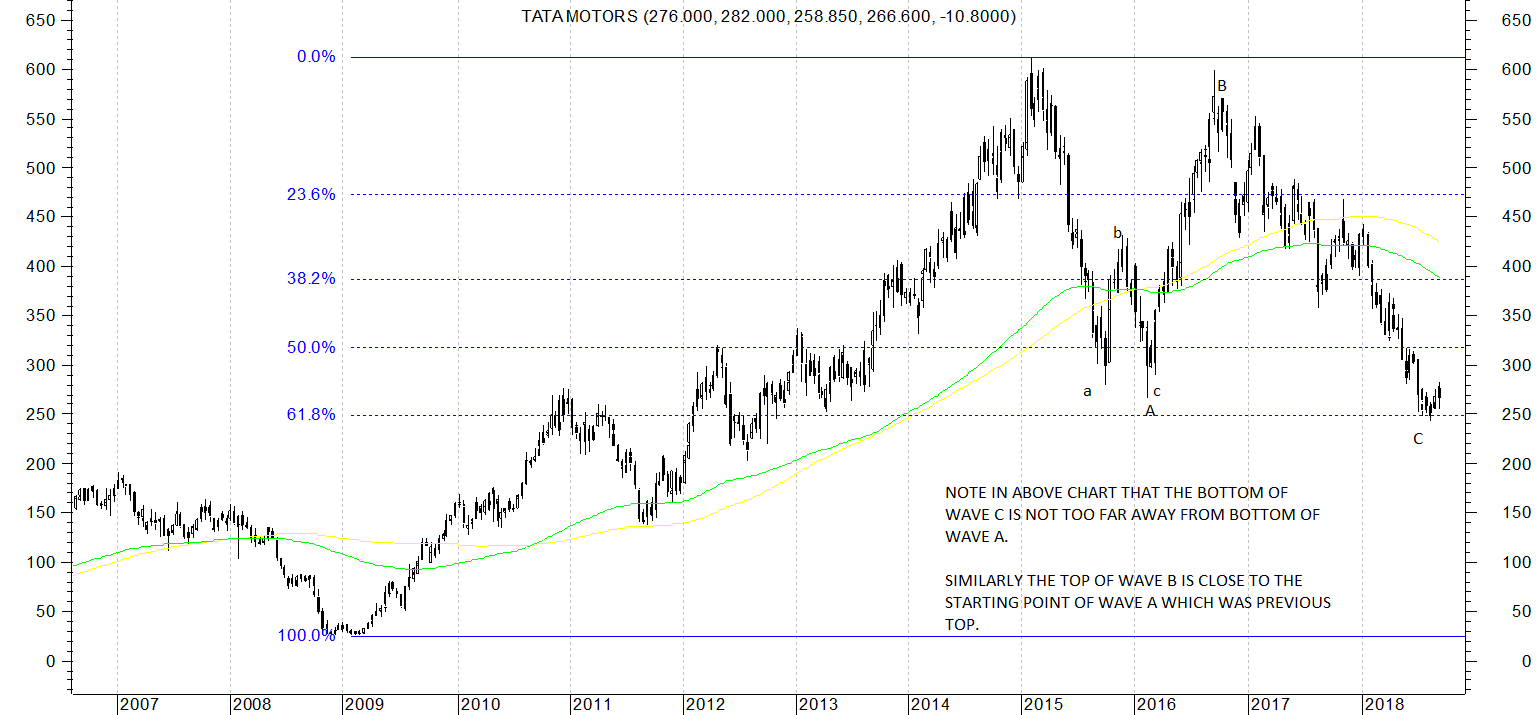
With the above information provided in the book if we try to apply this knowledge to the chart of Tata Motors, we can see that Wave A was a 3 wave affair labelled in the attached chart and went from 612 down to 265 a distance of 347 points.
Then wave B went up from 265 to 598 which is just below the high of the start of wave A which was 612. distance was 333 points.
Then wave C went down from 598 to a low of 243 which is a distance of 355 points. Now it seems to be showing some signs of stabilising by not revisiting lows of 243 and a small but bull candlestick last month. All this happened at exactly 61.8% retracement of the whole previous upmove from a low of 26 in Jan 2009 to a high of 612 in Feb 2015.
If it were to turn and change is trend the current level seems to be a good level to turn up. Lets see how it plays out.
disc: took a small starter position to test the hypothesis.