
Accumulation / Distribution line break out
Hi,
Here I am discussing another type of breakout which I feel is very significant as the price break out or even more important. Break out on an accumulation distribution charts. I have done a detailed study for various periods in the markets from 1997.
For this I calculated accumulation distribution and plotted an AD line. Calculated as follows
Money Flow Multiplier = ((Close – low)-(high- close))/(high-low)
Accumulation/distribution = volume x money flow multiplier
A/D line = Prior A/D + current accumulation/distribution
This AD line is plotted against time axis. It has been seen that whenever there is a break out in accumulation level of the existing trend or break out of a previous highs in accumulation levels that indicates the start of new bull trend. It has been seen that price break out happen a long after this. The level of accumulation reaches or crosses previous highs means a lot of smart money is coming into the markets at the lower levels and stocks are accumulated by strong hands. I feel this can be a very good indicator for bottom picking. (At least history says, not a guarantee for future).
If one was following these charts he/she would’ve been able to enter the markets at almost the bottoms in 2009, and also in 2004 just before the start of the bull rally which ended in 2008. I clearly believe that the level of accumulation is the most important indicator of the strength of markets.
Here I have done breakup of the charts for different periods
1997 - 2001.
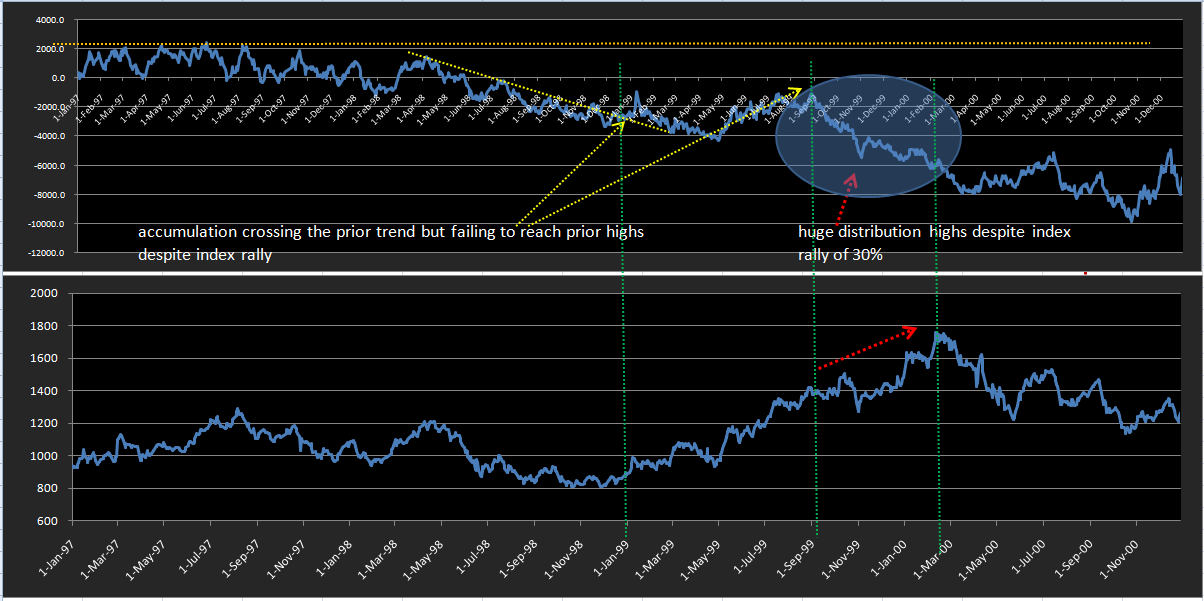
From the charts it is clear that during the entire year of 1997 the accumulation was range bound and by 1998 markets started distributing and by January 1999, the trend in the AD line was broken out and nifty was at 1000 range. Then the rally in nifty stared soon to 1800 but the level of accumulation had topped in September 1999, when nifty was 1400 levels. But this level was way below the previous highs in accumulation levels. Nifty still went on rallying a 30% further but this time with huge distribution. This means market had shifted from strong hands to weak hands. When market entered into a bearish phase it lost 50% and the bear phase continued for 3 years.
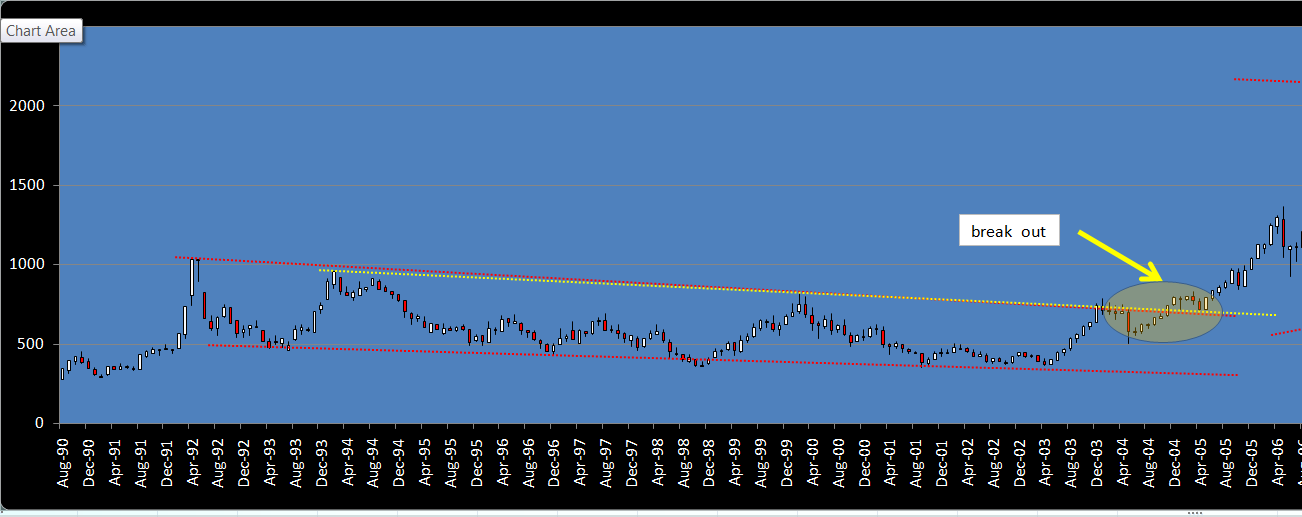
2003 bottom formation
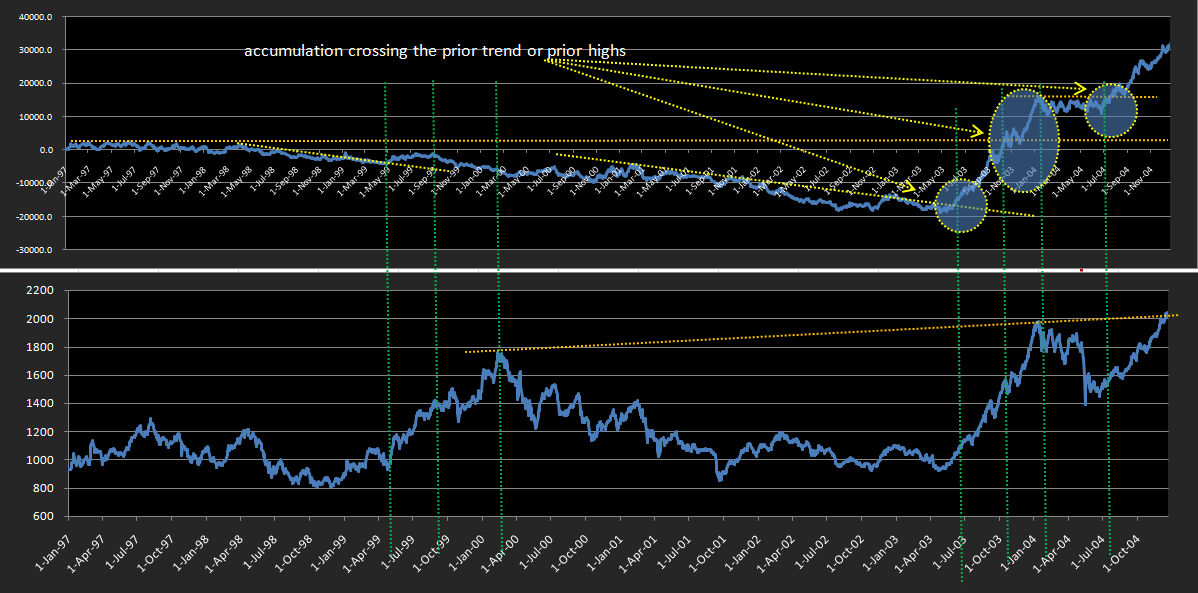
During the 3 year long bear phase no significant accumulation was seen. In july 2003 there was a breakout seen in accumulation levels in the AD line chart when nifty was at 1000-1200 levels. During the rally started in July 2003, the accumulation levels has crossed the previous highs in November 2003 when nifty reached 1600. The rally continued further till nifty reached 2000 levels that too with good accumulation.
2004 Dip
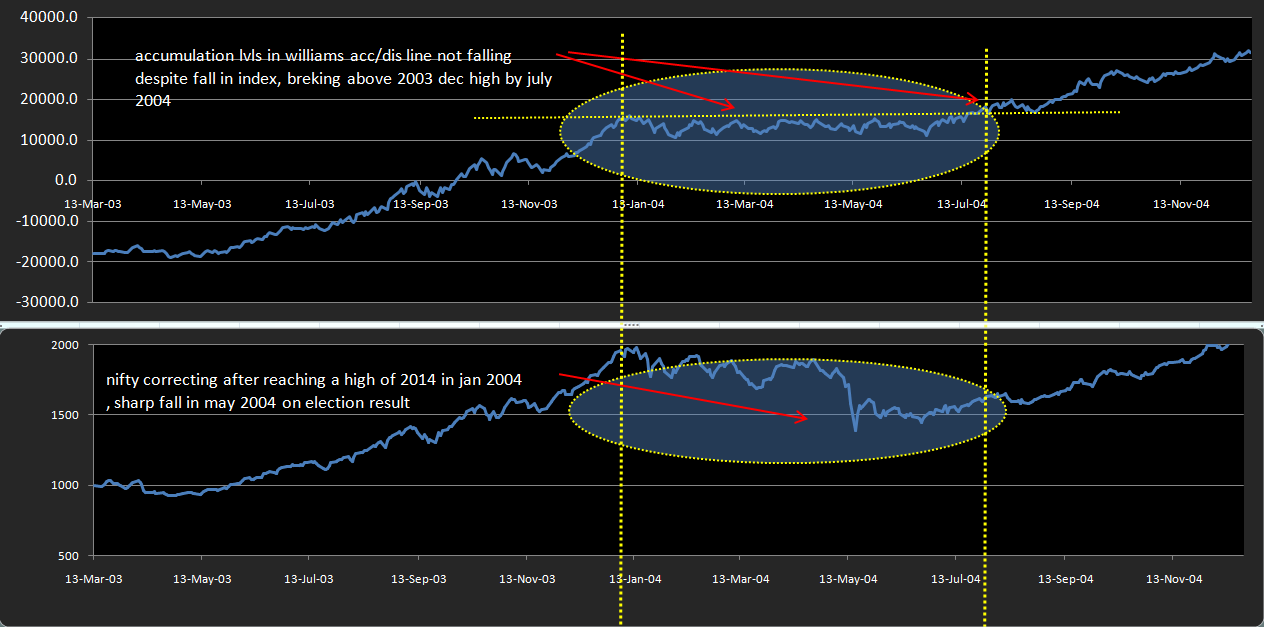
Nifty fell almost 30% due to unexpected defeat of NDA in 2004 election. But from the charts it can be seen that there was no significant distribution during that period and the accumulation crossed the highs of December 2003, by July 2004 when Nifty was still at 1600 levels. Then nifty rallied till 6300 in 2008.
2008 Market crash
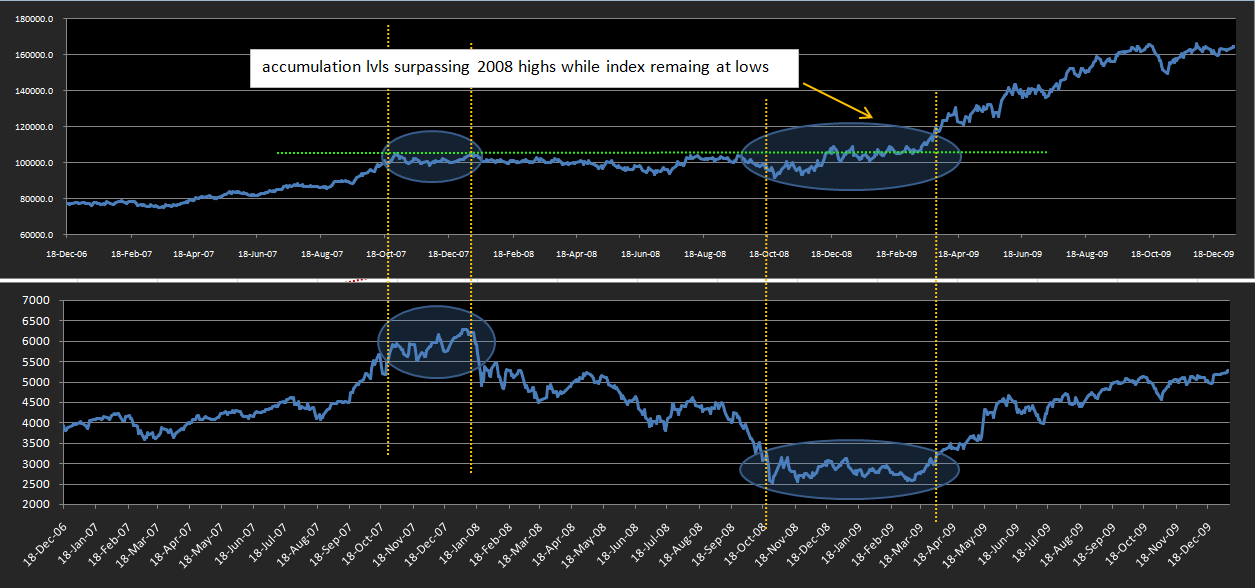
During the market crash of 2008 nifty lost almost 60%. If we look into AD line charts it can be seen that during the period between 2008 December and 2009 March, the accumulation levels has crossed the 2008 highs, while nifty was still at 2500-3000 levels. Nifty rallied to 6300 in 2 years.
2010 Correction and 2011 bottoming out
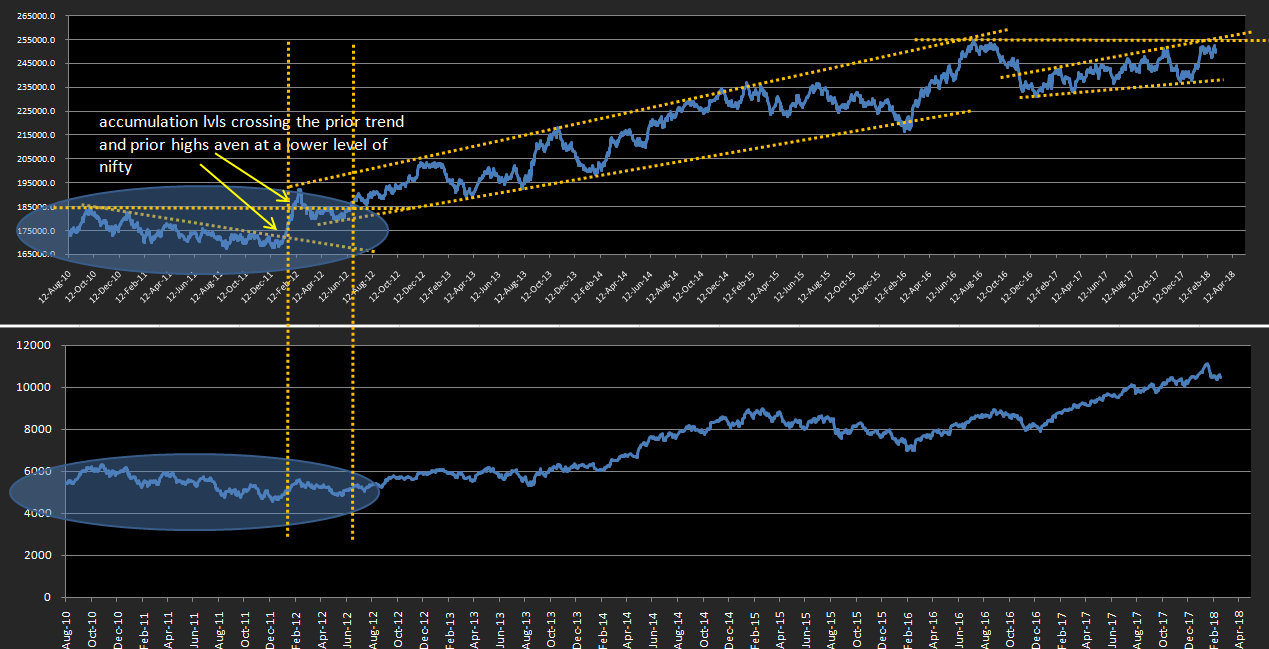
After reaching 6300 again in October 2010, nifty went into correction mode. The downward trend in accumulation levels was crossed in January 2011 and the rally started from there. And that rally is still going on strong
2016 top in accumulation levels
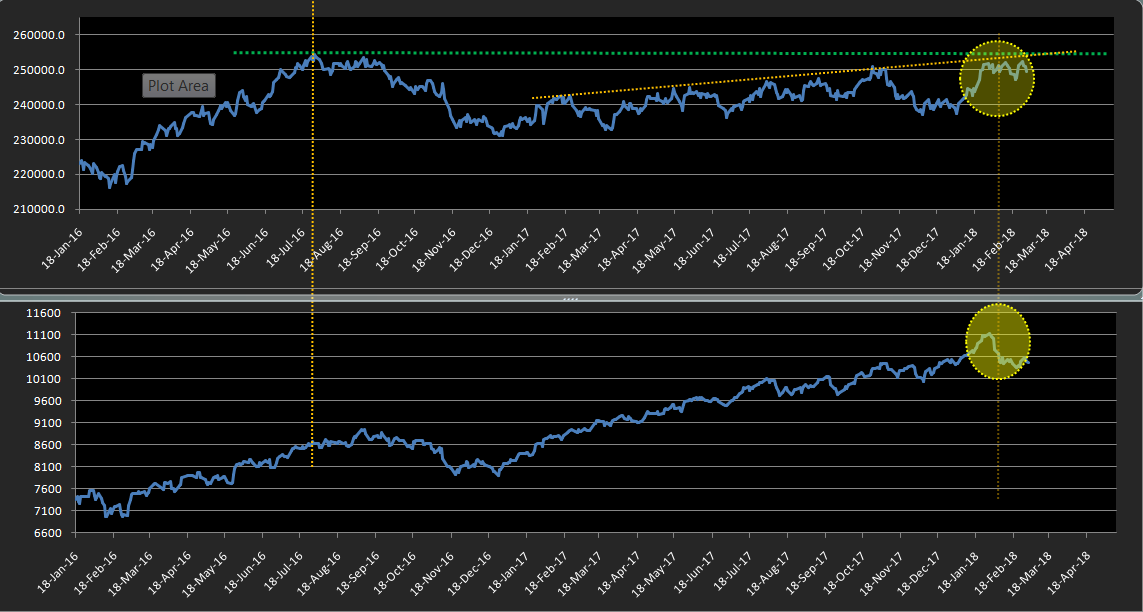
If we see things in this perspective a major concern will be that the present accumulation level is still below the high made in august 2016 when index was below 9000. Nifty rallied 2000 points but accumulation level has not reached the highs of august 2016. The distribution during the minor bear phase between 2016 september highs and the demonetization lows (a fall of 1100 pts), has not been covered in the current bull rally of 3200 pts. (demon low of 7900 to current high of 11100).
Even though the accumulation level has not reached the 2016 august highs still the markets were rallying with increase in accumulation levels.
Rally from demon lows
The rally from demonetization lows is seen with steady accumulation but still unable to surpass 2016 accumulation high levels
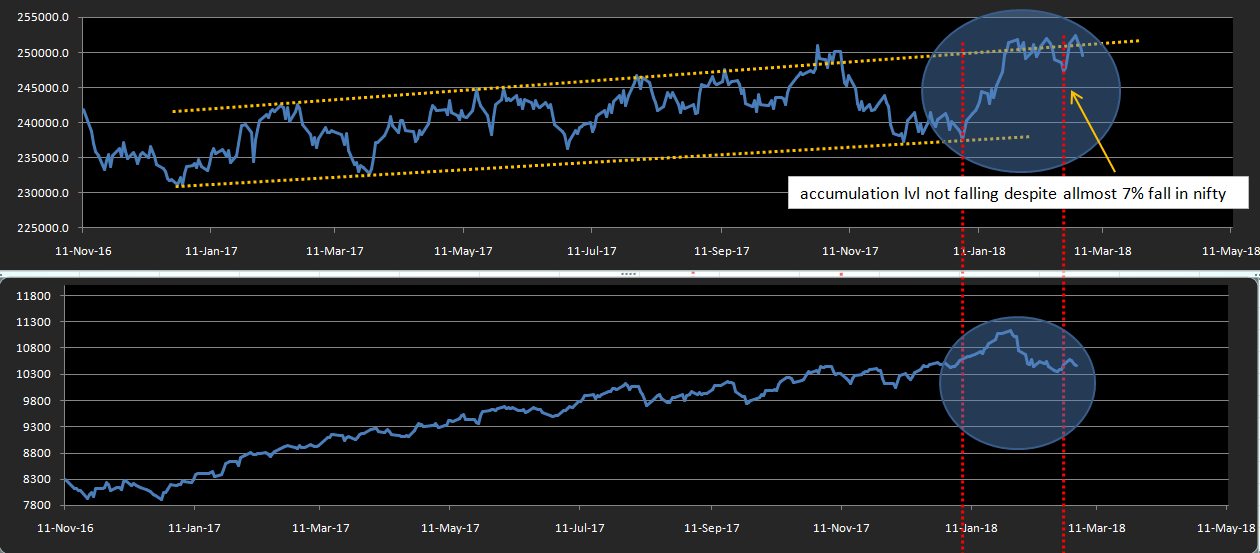
The current fall in markets
From the previous charts it can be seen that during the current fall of nearly 7%, the accumulation levels has not fallen significantly. Though this does not guarantee that we may not fall further, there is every possibility that the accumulation levels can breakout above the highs of 2016.
So I feel it is very important to watch the accumulation level at this point of time. Once the accumulation level crosses the 2016 high and make new highs, especially if it happens with index still below the all time highs, I feel it will be the starting point of the next bull rally which may be similar to the rally started in 2004.
It cannot be said that this may happen very soon as the present accumulation levels are very close to the 2016 highs or it may take more time also if the present correction continues. So what makes me more confident is days which nifty closing in red and still we got accumulation. More precisely gap down openings with close near day’s highs, whatever may be the color of nifty candle. By this type of markets the accumulation level will break the high of 2016 and nifty still maintaining the corrective mode. This type of market will flush out weak hands, which are still left in the markets. I feel markets will enter into the next zone only after strong hands accumulates sufficient quantity and flush out all the weak hands remaining in the markets.
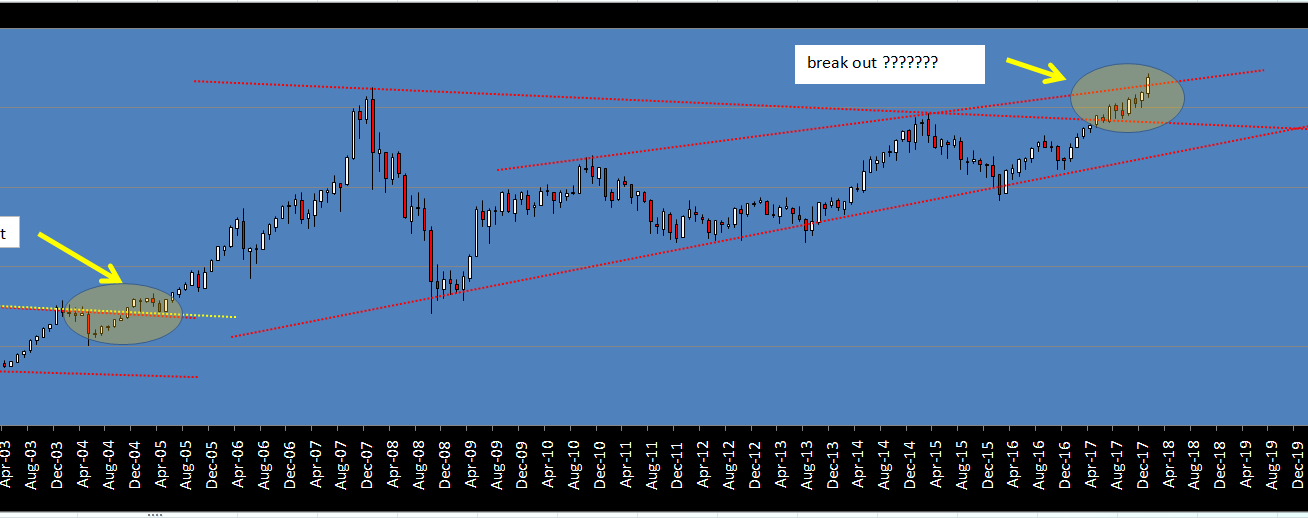
Also there is another break out happening or on the verge of break out is on the inflation adjusted Nifty which is similar to that occurred in 2003-2004
2003-04 breakout in inflation adj nifty
breakout or on the verge of breakout in 2018 ( only data till january entered)
Discl: 80% invested 20% cash planing to deploy more if a clear breakout happens on accumulation charts.