
Risk minimisation is a function of money management and increasing probabilities (more reward to risk) while entering into a position (a transaction for a particular stock).
Now breakout trading
Breakout trading refers to ‘breaking out’ or burst through a ‘new territory’ from ‘somewhere’ through ‘influential buying’. You can see four elements in bold here. Now let’s define them now:
Breaking out- meaning price shoot through on a particular day. How to define price appreciation?
New territory- the price has reached a territory or zone which has broken mentality or behaviour of participants (buyers and sellers). How to define new territory?
Somewhere- the breakout has to happen from launchpad. Whether the launchpad is constructive or not is another issue.
Influential buying- whether a good section of participants believed and participated in the breakout activity.
Before we define further few of these things, let’s go back slightly a bit towards more towards a simplistic view:
- Stock market is a place to buy and sell shares.
- Stock market is driven by forces of nature. Like any human or animal, we all are driven by forces of nature. Whether it’s physics (momentum, gravity, rotation) or medical science (neurons, compartments of brain, heart etc).
- Consistent momentum for a long period sets a trend or direction.
- Stock market is a place of probability not certainty. You cannot buy anything (long or short term) with certainty, no matter what your research is.
- Maximum adversity beats you down to a winning probability less than 60% for best of breed. Below average like me hovers around 40-45% winning maximum.
- When people pay a higher price for a stock it goes up.
- When people joins in queue (bids) to buy a share a momentum sets in. Force of nature ensures momentum continues unless over ridden by another act which leads to reversal of force of nature.
- Stronger momentum requires more forces. Here it is volume which can be provided by big buyers supported by rest of crowd. In India due to high promoter holding and low float HNI plays a big role other than institutions for volume action.
- Forces of economics ensure engagement and disengagement of buyers and sellers both. Volatility increases when they engaged, it reduces on disengagement. This is popularly called constructive price behaviour in stock market.
When a momentum sets in you can buy either: a. on the breaking out day b. follow up buying as long as you feel momentum is intact above new territory. This includes even at the time of pullback (called pullback trading)
An appreciation should be sufficient to take the price beyond line of least resistance. This is a price to a new high including all time high. This price passes through a point which demarcates old crowd behaviour and new behaviour, popularly known as pivot point. The appreciation has come either prolonged inaction or continuation of buying (launch pad).
Now task items:
-
Do not look for pattern everywhere unless you understand whether you want to catch momentum. Say for breakout trading momentum is a must. So, go for the stocks where price has appreciated to some extent i.e. say 30% or more 3 Months, OR 50% or more in six months.
-
Speculation alone can not ensure a long-lasting momentum or trend for ever. Where speculators desert a stock for greener pasture stock lost its trend. But when a trend is supported by both investors and traders it becomes enduring. So, look for stock which have a primary trend in your support (here uptrend). Primary trend can be determined on a long period. I take 5 years as maximum (3-5 Years) considering political changes. A 3/5 year chart with weekly unit will show you whether primary trend is up and down.
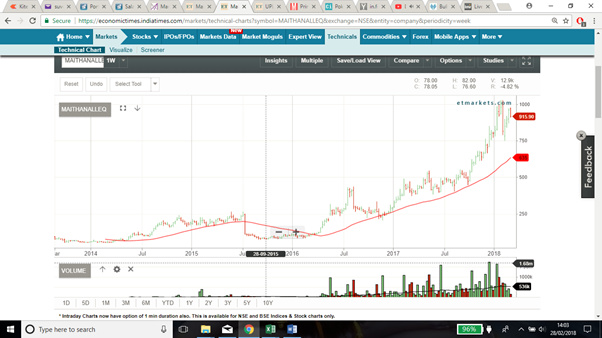
See above, on most of right side stock is moving up i.e. making newer highs and higher lows. Thrice it has touched 40WMA (equivalent of 200DMA) and bounced back. A strong trend indeed. Why 200 DMA? It’s a reflection of yearly trading averages. Why yearly is important? It’s a key decision-making time period i.e. financials, budget, taxation etc.
- It’s fantastic that there is an uptrend. But is it too late? Are we late to the party? What is strength of trend? Can we rely on it? Many people use many variables to ensure trend is early and trend strength. I am regular user of Stage analysis (Keynes economical pattern) and Base count (Bill O Neil statistical repetition pattern) and multiple moving averages (fractals to use larger crowd groups using divergence as tool).
Stage analysis- Keynes said economics or human, everyone goes through stages. So, a stock consolidates (stage 1), move up (stage 2), forms a top (stage 3) and goes downward (stage 4). It keeps repeating all the time (1-4).
Base count- Bill O Neil dissected 100 years of upward movement (Stage 2) and saw every stock forms between 3 to 6 bases before topping out. In fact part of Jewels project, we could get more or same number in India. Cyclical companies are the ones which shows inconsistent behaviour in bases but minimum 3 which you can count. Now if you buy a stock base 4 or 5 you know late to the party.
Fractals- fractals is a shape of geometry (either curve, figure etc) which can be presented visually or even virtually. Scientists realised humans while using brain has the ability connect different and inter dependent abstracts to form a whole visual picture. Here there are individual moving averages, what you do is clubbed them into groups (traders and investors) and see how they behave. The behaviour can be interpretation through visual chart. You can determine without using fractals. Say CMP (Current Market Price)>50DMA>150>200DMA as simple arithmetic. Fractals is a useful tool for enabling right brain thinking.
So, above example, whether trend is strong? See for yourself:
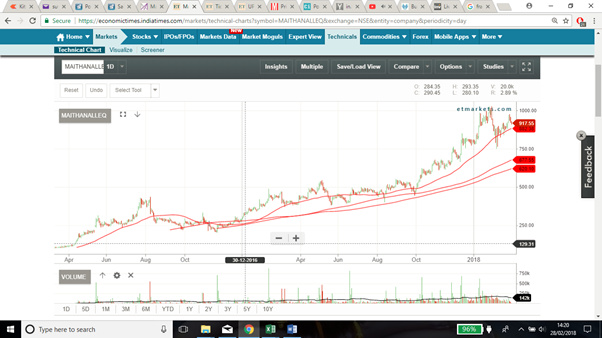
Look how beautifully and seamlessly the DMA lines are moving together. Let’s see what fractal says:
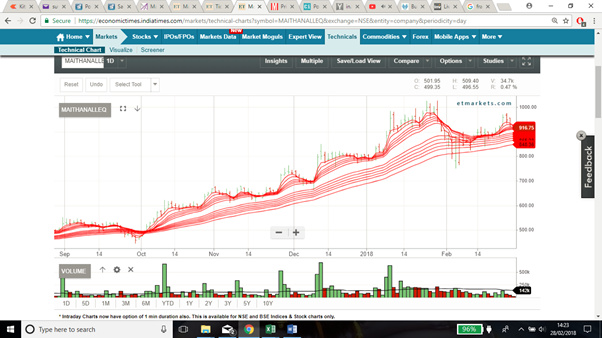
Five things you can make out:
Traders (short moving averages)- the lines (top six lines) moving consistently with gap between them for most of time. What does this mean? When traders pay higher price, lines will separate (as moving averages goes up) and when they agree to common price it will contract. See the contraction towards end. But still traders couldn’t dent or move through investors (long term moving averages) despite a general correction market.
Investors: well separated and expanding, they believe in story. They continue to buy whether market corrects or not.
Rebound: Few times when trader contracts (agree to a price) immediately they differed and started paying a high price. The lines rebounded up wards.
Volatility- four or five times traders has contracted and expanded in one year. There has been hardly five swings without cutting investor perception. This is a definitely a low volatility stock.
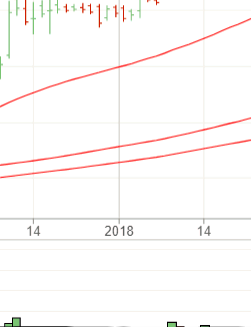
Trend strength- look at the gap between traders and investors. Fairly consistent and widening except towards end, but you can see again gap is opening up. Very good trend strength.
Fractals require bit of research and practice, I would suggest you create your own fractal.
- Now we know trend is strong. This means if we enter our probability of winning is increased nothing more. But there is no guarantee that you will make money, what is the precision timing to enter a stock. Again, different patterns and fractals. I use a breakout from constructive base pattern beyond a pivot point.
Constructive base pattern- I discussed in earlier posts, any healthy economics which involves both influential and retail buyers will expand and contract without loosing its base. One or two shakeouts is ok, not complete breakdown. See those green lines and red lines. How price is contracting, look at volume below for contraction.
Pivot point- this is the most confusing and precision point. Jesse Livermore called this as line of least of resistance. I use this (still infant): if a stock breaks above a zone where there are no trapped buyers. Meaning a point where there are no old buyers who are sitting on loss and crying to become desperate and get out. If there are they will not let the price goes to a new high.
I know I could not have explained everything so easily. Actually, I opened a thread for all this, updated till money management. Not able to prioritise further.
In a nut shell we can understand:
- Patterns arise while assessing trend strength, direction or character.
- Buying point patterns are different from point 1. These are more precise, patterns are normally avoided.
- Fractals help in co-relating multiple data and visual thinking towards a story building, otherwise called right brain thinking.
Happy to help you further, you can connect any way you want. I saw somewhere you mentioned you are grappling some of concepts. Multiple fractal you are using at so early stage, it will harden your wiring and liberate you much faster. It’s a question of time. Trust me I still talk and meet much experienced people whose wiring is so hard, untenable to circumstantial changes. That mean a disaster is waiting somewhere (not necessarily financial disaster).
Good wishes and best of luck