@Capsule91
I have tried to analyze the trends of Aluminium Futures. This is a long term view.
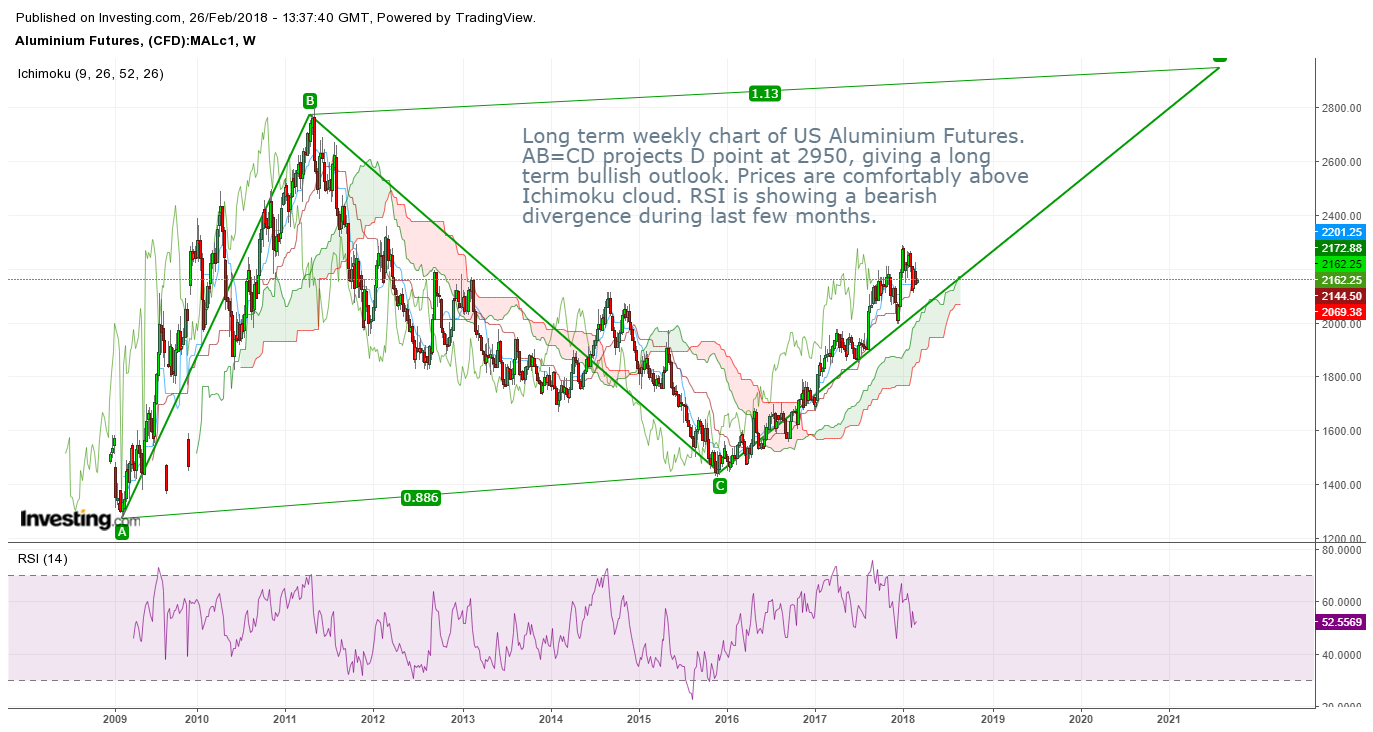
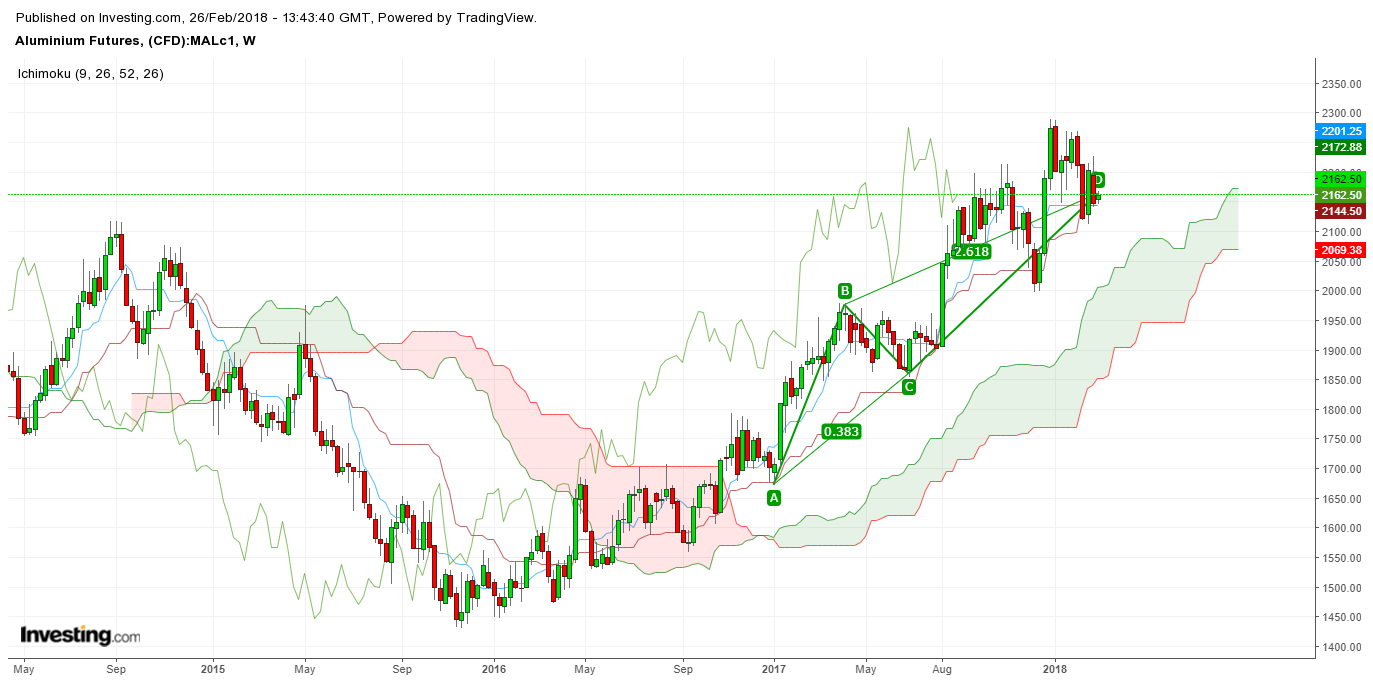
And this is my view of the weekly chart. A strong Bearish AB=CD pattern is complete. The most important point is that the retracement is sharp at 0.382, which is characterized by an extreme price action that we are seeing in the chart and the prices moved from 1860 at C to a high of nearly 2300.
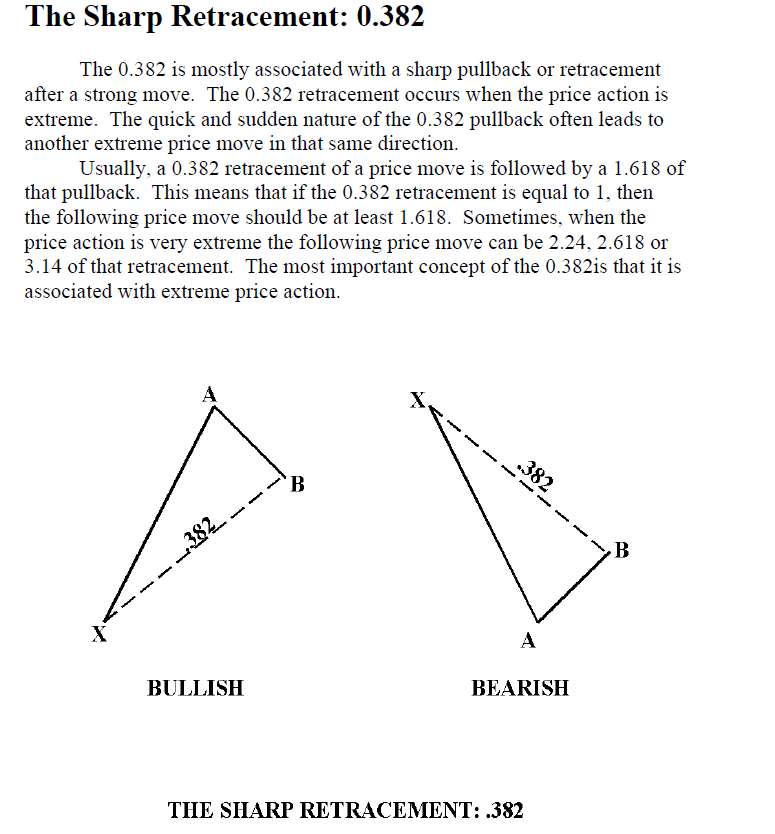
This is what Carney says about sharp 0.382 retracement
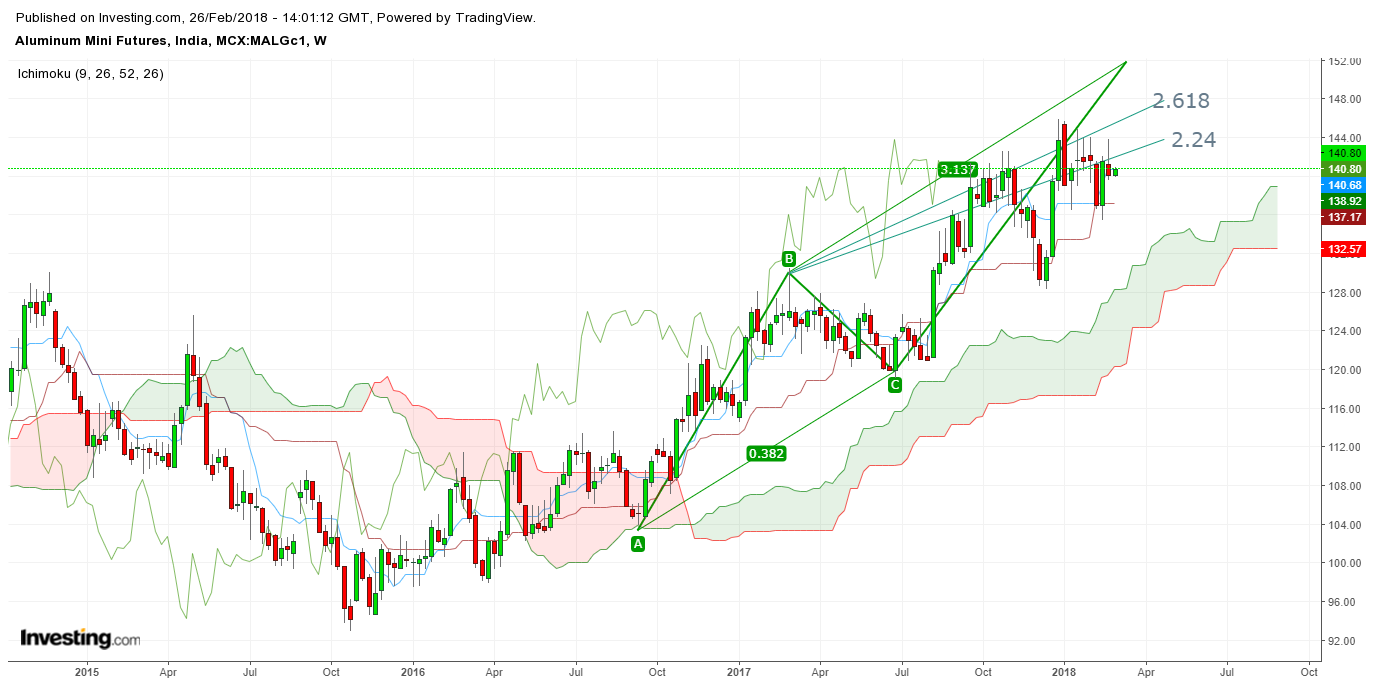
The prices are above the cloud, and to me the situations seems bullish.
This is how MCX aluminium futures closely resemble US aluminium futures. After a sharp 0.382 retracement, the D point projection can be at 2.4, 2.612, or even at 3.14. Here also the prices are comfortably above the cloud.