When you compare current quarter sales with sales for the same quarter last year you are accounting for seasonal variation in sales (like a seasonal drop in sales in Sept compared to June quarter for Avanti) but you are also taking a data point (denominator) that is one year old and use that for measuring a quarterly result.
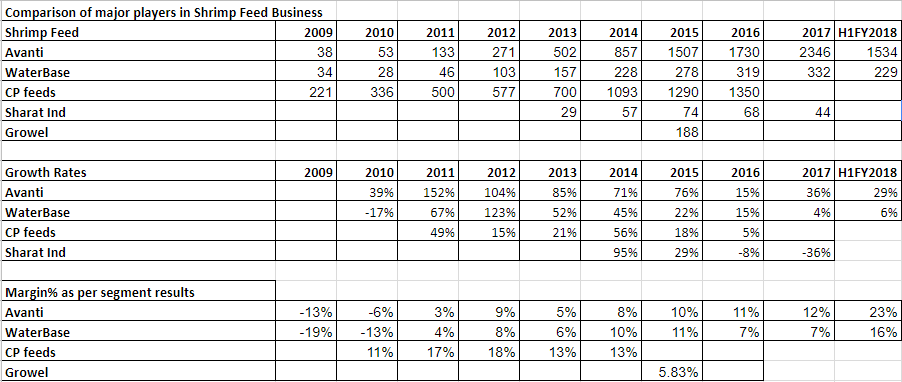
e.g. in case of Avanti, y-o-y growth in sales in Sept 2017 quarter reflects changes to capacity, distribution network, prices, number of farmers taking up (or giving up) shrimp farming etc over the course of the year (from Oct 2016 to Sept 2017) and not just over the course of the quarter. Only about 1/4th of the changes would have happened in the most recent quarter. Y-o-Y number only reflect this 1/4th change (other 3/4 will reflect in next 3 quarters) along with 1/4 of the changes in 3 preceding quarters (Dec, Mar and June).
Measuring q-o-q change in reported sales will fully reflect change in quarterly sales but we will not know how much of that change is due to above mentioned factors and how much is due to seasonality. Hence measuring q-o-q changes in seasonally adjusted series is the widely used technique in statistics.
A q-o-q change in seasonally adjusted data will spot a trend as much as 2 quarter before it shows up (partially) in y-o-y number. That’s an edge that will be useful when company is trading at such high valuation.
Here are few more articles that explain seasonal adjustment.