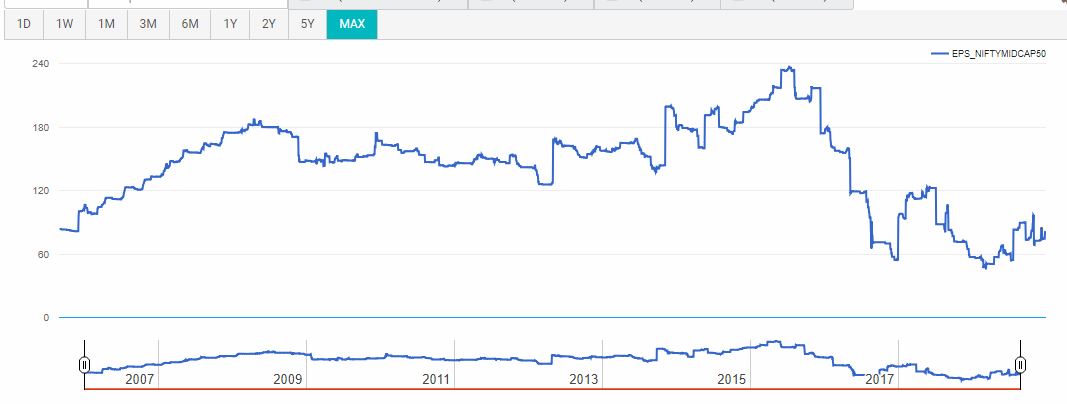
Can you please update the latest chart on EPS growth of smallcap and midcap( for 2017 and 2018)? NSE website is showing preposterous PEs and hence absurd EPS . Consolidated and standalone should not be very much different for smallcaps. Even if the difference is 10%, the chart must not be so absurd. Can u please explain why it is so?