
Hi Amit, this is a nice write-up about Aimtron and one that has helped me a lot in understanding a newly listed SME. A quick question - why would you not compare them with Kaynes instead of Moschip? Is it because of their current product portfolio being more PCB and IDS than Box Build?
1 Like
Kaynes has upgraded business segments of OSAT. Aimtron has only expressed itsaspiration to go in that direction which is multiple years ahead.
Unit economics for Solar companies.
Data is approximate post reading cell manufacturing, module mfg, and EPC companies.
Solar Cell mfg- Rev 1.1 Cr/MW, PAT margin 21%
Solar Module mfg- Rev 2.3 Cr/MW, PAT margin 13%
Solar EPC- Rev 4.4 Cr/MW, PAT margin 15%
1 Like
Waaree Energies
INDIAN SOLAR POWER MARKET
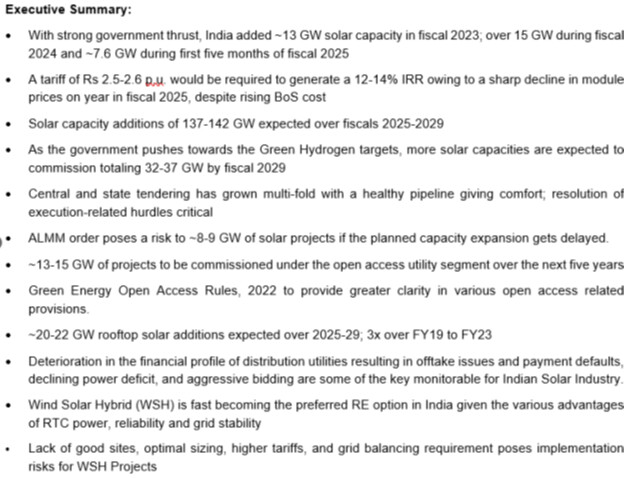
Review of solar energy capacity additions in India
Review of solar energy capacity additions in India
a) About 5,000 trillion kWh per year of energy is incident over the land area.
b) Most parts receiving 4kWh to 7 kWh per square meter per day.
c) The National Institute of Energy estimated the country’s solar potential at 748 GW, assuming solar PV modules cover 3% of the geographical surface.
d) India has 300 days of sunshine each year, with daily peak electricity use being in the evenings and a seasonal peak in the summer.
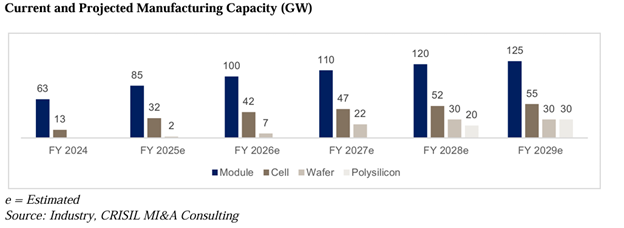
e) Currently, 80% to 85% of the solar modules need be imported as domestic capacity is inadequate to meet demand. India does not have a manufacturing base for polysilicon ingots and wafer; hence, players import these components, incurring high cost.
Waaree business position:
A manufacturer of solar PV modules in India.
- Aggregate installed capacity of 12 GW and utilized capacity of 43.37%, as of and for the year ended March 31, 2024
- Aggregate installed capacity of 12 GW and utilized capacity of 45.01%, as of and for the three months ended June 30, 2024 (on an un-annualized basis).
Solar energy products consisting of the following PV modules:
(i) Multi-crystalline modules
(ii) Monocrystalline modules
(iii) Top-Con modules, comprising flexible modules, which includes bifacial modules (Mono PERC) (framed and unframed)
(iv) Building integrated photo voltaic (BIPV) modules
Operate one factory each, located at Surat, Tumb, Nandigram and Chikhli in Gujarat, India and the IndoSolar Facility, in Noida, Uttar Pradesh.
Total spread over area is 143.01 acres for having 12 GW capacity.
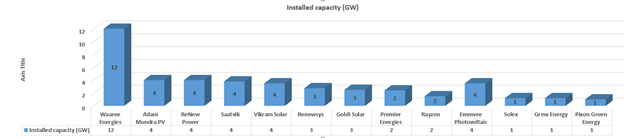
Key domestic solar module manufacturers with capacity
IPO offer size:
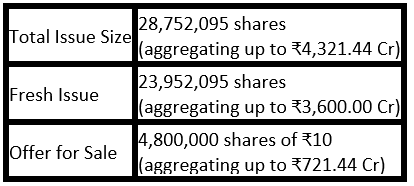
|a)|Rs. 27,75 Cr will be used to part finance the cost of establishing the 6GW of Ingot Wafer, Solar Cell and Solar PV Module manufacturing facility in Odisha, India.|
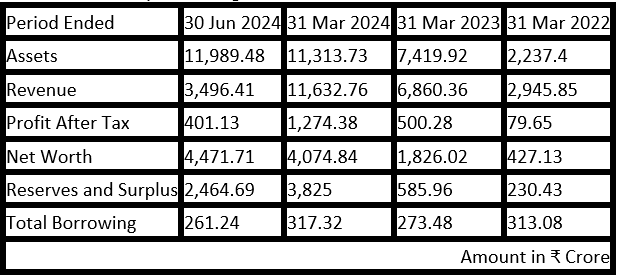
|b)|Waaree Energies Limited’s revenue increased by 70% and profit after tax (PAT) rose by 155% between the financial year ending with March 31, 2024 and March 31, 2023.
|c)|There are no outstanding litigations involving our Group Companies, which may have a material impact on our Company, in accordance with the Materiality Policy.
|d)|Rs. 2033.5 Cr is the estimated amount of contracts remaining to be executed on capital account (net of advance) of the group.|
|e)|Combined Installed capacity is 12 GW but Effective installed capacity is only 3.1 GW and out of this the utilization is only 45% at 1.4 GW production. |
|f)|Cost of Material consumed is in range of 95% to 80% of total expense in Q1 FY25 this is at 60%|
Internal Risk Factors
- Business is dependent on certain key customers and the loss of any of these customers or loss of revenue from sales to any key customers could have a material adverse effect on our business, financial condition, results of operations and cash flows.
- Customer agreements include terms relating to liquidated damages and we have paid liquidated damages and other related claims in Fiscal 2023 and Fiscal 2024 and the three months ended June 30, 2023 and June 30, 2024. In the event waaree is unable to reduce such liquidated damages and other related claims their business, financial condition, results of operations and cash flows may be adversely impacted.
- Export sales make operations subject to risks and uncertainties of various international markets, in particular the United States. Further, revenue from operations is significantly dependent on export sales and there is no assurance that they may be able to continue our export sales going forward.
- Chikhli has 9.66 GW of Mfg base alone.
- Decline in the price of solar PV module prices may have an adverse impact on our business, results of operations and cash flows.
- Transportation freight, duty & handling charges is 3.32% of Revenue from Operations in Q1 FY25.
- The Exports sales in Q1 FY25 has reduced by 45%.
- Other risks in RHP
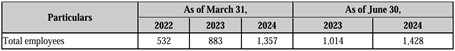
Number of employees in Company:
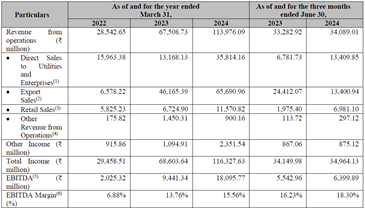
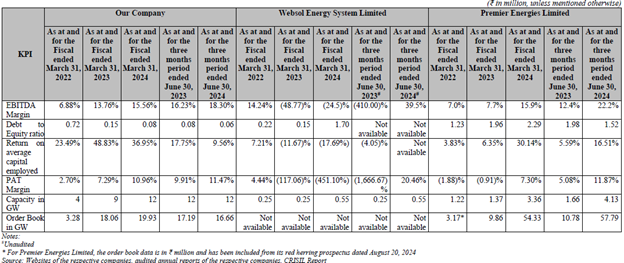
Key performance indicators (“KPIs”) for Waaree Energies:
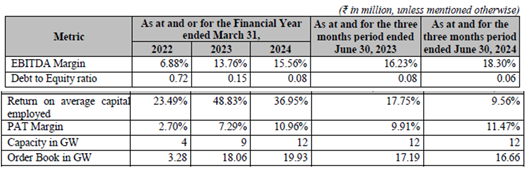
Comparison of KPIs with other listed industry peers:
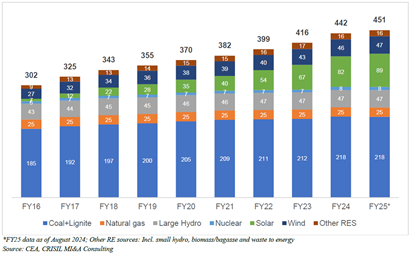
Fuel-wise installed capacity in past 10 years (GW)
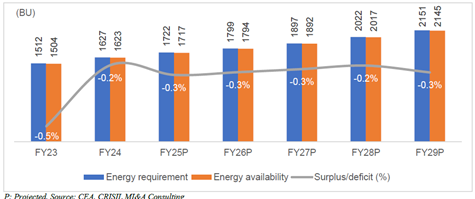
Energy demand outlook (Fiscals 2023-2029)
Peak demand outlook (Fiscals 2021 to 2029)
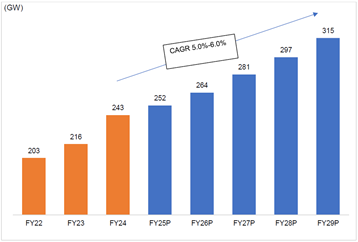
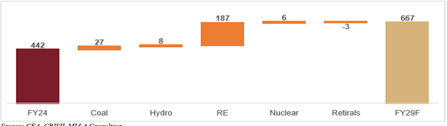
All India installed capacity addition by Fiscal 2029 (in GW)
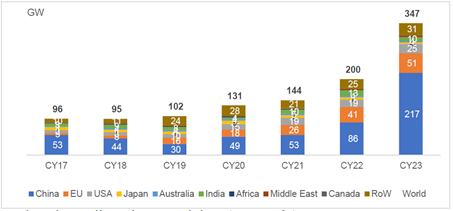
Annual solar capacity additions in major economies
IRA to boost demand for solar value chain in US
The US Inflation Reduction Act has allocated approximately US$ 400 billion for clean energy. It is expected that it will lead to critical implications for climate change, trade, security, and foreign policy. The tax credits provide financial incentives to both domestic solar demand and supply.
For solar modules the credits are expected to include:
Solar Cells – 4 cents per WDC capacity
Solar wafers – $12 per square meter
Solar grade polysilicon – $3 per kilogram
Polymeric backsheet- 40 cents per square meter
Solar modules – 7 cents per WDC capacity
China Plus One strategy
Decline in the prices of Modules
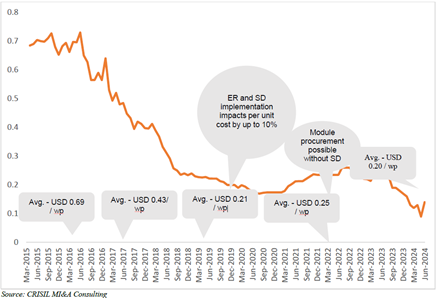
|a)|Module prices started to fall in 2023 owing to the ramp-up in the production of upstream components.
|b)|Prices of modules fell to $0.15-0.20 per watt-peak in April-November 2023 from $0.23 per watt-peak in January 2023. |
|c)|This has eased some pressure on capital costs in Fiscal 2024. Global solar module prices have reached a historic low, standing at just $0.09 per watt-peak in June 2024, which is expected to stimulate growth in solar power capacity. |
|d)|Prices are expected to remain stable over the medium term due to supply glut and relatively weak demand internationally. |
|e)|In line with this trend domestic prices too fell to $0.14 per watt peak maintaining a steady premium over landed cost of imported modules. |
|f)|MNRE has reinstated the applicability of Approved List of Module Manufacturers (“ALMM”). |
|g)|ALMM enlisted manufacturers can supply cells and modules to government and government-assisted projects. Projects under open access and rooftop solar by private parties are also brought into the ambit of ALMM. |
|h)|All the fall in prices across the value chain is expected to be arrested in Fiscal 2025.|
Review of project economics and leveled tariffs for solar PV power plants in India
|a)|5 Acre of land is required to install 1 MW of solar park.
|b)|Equipment cost of ₹ 38 million to ₹ 42 million per MW (including DC side overloading at 40%) for a project based on domestic make modules. – Note: the labour cost and other accessories are extra.|
|c)|If the tariff of solar power is Rs. 2.6 P.U then the IRR on investment is 12-14%.|
Waaree Energies business Forecasting
| All Data in Rs Cr otherwise stated | FY25 | FY26 | FY27 | FY28 | FY29 |
|---|---|---|---|---|---|
| Solar Module in MW (business growth at 20% Y0Y) | 5600 | 6720 | 8064 | 9676.8 | 11612.16 |
| Revenue (@ Rs. 2.435 Cr per MW) | 13636 | 16363.2 | 19635.84 | 23563 | 28275.6 |
| PAT @10% | 1364 | 1636 | 1964 | 2356 | 2828 |
| No of Shares post listing | 28.73 | 28.73 | 28.73 | 28.73 | 28.73 |
| EPS in Rs | 47 | 57 | 68 | 82 | 98 |
| PE @ 50 | 2373 | 2848 | 3417 | 4101 | 4921 |
IPO offer price of Rs. 1503 per share is value for money.
Disc: Invested
4 Likes
Any further update on it
Phenomenal result by Saakshi! Surprised we still don’t have a dedicated topic for it in the forum.
A view and hope
- INR has weakened to record lows (~90 per USD), pressured by sustained FII outflows and tariff uncertainty; RBI interventions are focused on reducing volatility, not defending a level. [ceicdata.com],[thehindubu…ssline.com],[hindustantimes.com]
- FIIs/FPI have been net sellers through 2025, with outflows in the ₹1.4–1.98 lakh crore range depending on the cut‑off date; domestic flows have absorbed much of the selling while indices neared/all hit fresh highs. [cnbctv18.com],[economicti…atimes.com],[timesnownews.com], [business-s…andard.com]
- PMI momentum softened in November (Manufacturing 56.6), reflecting tariff drag and cooling export orders, while Services remained robust (59.8). [business-s…andard.com], [business-s…andard.com]
- GST “2.0” rate rationalisation has moderated near‑term tax growth (Nov gross ₹1.70 lakh crore, +0.7% YoY) but aims to lift consumption; import IGST resilient (+10.2% YoY). [economicti…atimes.com],[moneycontrol.com]
- Nifty/Sensex have flirted with/printed new all‑time highs despite the weak rupee, pointing to narrow, large‑cap leadership and strong domestic buying.[economicti…atimes.com],[moneycontrol.com]
- RBI policy path: 100 bps of cuts already in 2025 to 5.50% repo; markets debated further easing around Dec 5 given low inflation vs strong GDP (8.2% YoY in Q2 FY26).[rbi.org.in], [thehindubu…ssline.com]
What may bring FIIs back?
- A turn in the US dollar cycle / Fed easing: Emerging market inflows historically resume when the USD weakens and US real yields fall. Watch for continued USD softness and Fed cuts—both have been supportive of EM flows in 2025.[morganstanley.com], [schroders.com]
- Rupee stabilization (orderly, not necessarily stronger): A move away from extremes (e.g., retreat from ~90/USD), narrower INR volatility bands, and rebuilding FX reserves tend to improve foreign risk appetite. [ceicdata.com]
- Policy clarity on tariffs/trade deals: Any positive India–US trade progress (tariffs lowered or phased) can flip risk sentiment and catalyze near‑term FPI inflows. Markets have been explicitly watching this.[theweek.in], [business-s…andard.com]
- Earnings breadth improving: FIIs prefer visible, broad‑based EPS upcycles rather than narrow, index‑heavy surges. Look for upgrades across banks, industrials, consumer and export linkages rather than just a few heavyweights.[nsearchive…eindia.com],[aneriguidelines.com]
- Valuation reset and leadership by quality large caps: FIIs typically re‑enter liquid, shareholder‑friendly names after a valuation cool‑off; note that large caps have stayed rich while mid/small caps look stretched vs history. [fortuneindia.com]
- Stable domestic macro with pro‑growth reforms: GST rationalization, lower effective tax burdens and a predictable RBI easing cycle (if inflation stays benign) collectivelysupport the case for foreign re‑allocation to India. [economicti…atimes.com],[cnbc.com]
- Bond yields settling with liquidity support: A 10‑year G‑Sec drifting toward 6.40–6.50% with Open Market Operations / liquidity signals is typically seen as constructive for equities and EM carry trades.[thehindubu…ssline.com]
- Sector rotation evidence from FPI data: Monitor NSDL/SEBI fortnightly sectoral holdings for a flip from persistent outflows to net buying across financials, telecom, capital goods and energy.[fpi.nsdl.co.in], [sebi.gov.in]
Which sectors do FIIs usually buy first in a return phase?
Phase 1: Liquidity + visibility (large caps, domestic cyclicals)
- Financials (private banks, diversified lenders & insurers): High liquidity, clean asset quality, and leverage to falling rates. FIIs often rebuild positions here first.[business-s…andard.com],[nsearchive…eindia.com]
- Telecom: 2025 has already seen stealth FII rotation into telecom on tariff visibility and monetization (Jio/Airtel narrative). Expect continued interest given pricing power and FCF improvements. [economicti…atimes.com]
- Capital goods/industrials: Beneficiaries of capex cycles and order books; international investors like the operating leverage and visibility when growth broadens. [samco.in]
- Oil & gas / energy (integrated players, gas utilities): Cash flows, downstream monetization, and policy clarity tend to draw foreign flow early in an upcycle. [samco.in]
Phase 2: Quality consumption & exporters (when tariffs clarity improves)
- Consumer staples & discretionary: As GST‑led consumption stabilizes and margins normalize, FIIs re‑engage in brand leaders. (Note: staples saw outflows in certain fortnights; a turn would be an important signal.) [economicti…atimes.com], [samco.in]
- IT services: Typically lags the first leg; flows improve when global tech spending visibility rises and USD cycle turns decisively weaker.[schroders.com], [aneriguidelines.com]
- Specialty chemicals & manufacturing adjacencies: Beneficiaries of China+1 and export recovery; foreign flows are selective but sticky when margins stabilize. [samco.in]
“Which companies may move first?”
FIIs don’t move uniformly, but the playbook is consistent: high‑liquidity, index‑heavy financials, energy & telecom get priority, followed by select industrial & consumer leaders. Think of names with: (a) index inclusion & derivatives liquidity, (b) governance/repeatable FCF, (c) pricing power, (d) low refinancing risk. Recent coverage and flows highlight telecom leaders and private banks as early beneficiaries, while integrated energy remains perennially FII‑friendly.[economicti…atimes.com], [business-s…andard.com]
What happens to Mid‑caps and Small‑caps when FIIs return?
- Near term: Relative underperformance vs large caps is common in the first leg of FII return. Foreign money typically rebuilds in liquid large caps before moving down the cap curve. This is already visible in valuation gaps: mid/small caps trade at steep premiums to long‑term averages—leaving them vulnerable if leadership shifts back to large caps. [fortuneindia.com]
- Subsequent phase: As earnings breadth improves and volatility eases, select mid caps with cash‑flow visibility, governance and clear capex/market‑share stories can seesecondary flows. Small caps, however, may lag longer and remain most sensitive to liquidity swings and any valuation or governance scares. [aneriguidelines.com]
- Risk note: If tariffs persist and INR remains weak, import‑intensive small caps can seemargin pressure, increasing dispersion within the segment. Look for net exporters or domestic cyclicals with pricing power.[business-s…andard.com]
Not a registered advisor. Above views are a try to understand the current situation and to prepare for the good coming days. Please add your inputs to this.
1 Like