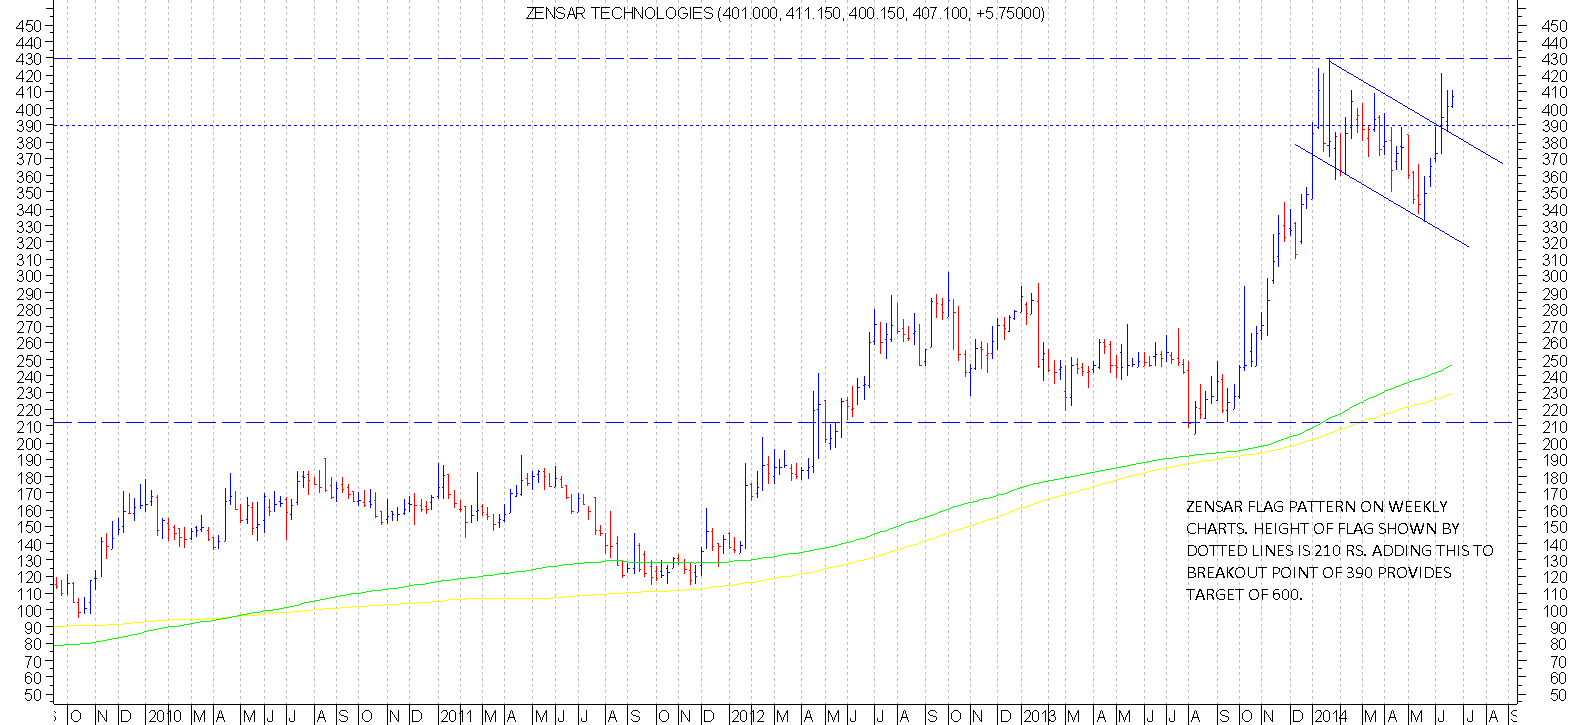
Zensar as is shown in the chart attached has broken out of a flag pattern and could provide targets of 600 from current levels of 400-410.
fundamentally it has reported eps of 54 per share for fy 14. div payout ratio has been low. Another slightly negative could be that the company belongs to the Goenka stable.
On positive front, it seems to have won new client deals recently and that could translate into good growth over next few quarters and years.
Sorry for coming back again to you again sirji. Just wanted to check with you just to play chocolate/ice cream/spirits long term story for India, with demographic etc, who are the best businesses hence stocks to own or track. I am struggling with this for last several years ever since Cadbury Indiais delisted. Nestle is the next on this ? On spirits after Diaggia United spirits _is@100_ PE, with high debt, low earnigs etc. Similarly researched Vadilal/kwality, but was not impressed with their rations/managements etc
So looking for some one like Page, who also has powerful brands, ROE etc,small and has a long way to go. Did you ever had a llok at these sectors to play on consumption and demography theme.
@ Santosh Sinha, Please refrain posting the same thing on different threads. If you have any queries directed to Hitesh, then post it on his portfolio thread. Posting everywhere is not going to help you. It will rather be a dis-credit and you may be dis-allowed to post on the forum. You have to earn your respect by contributing here on the forum.
Admin please take a note and issue warnings accordingly.
To be frank - I’ve always remained suspicious of technical calls. Your last call on RS Software worked fabulously (although after hitting the mentioned Stop-loss points); In retrospect Zensar also seems to be moving in the direction of your call.
I’m more of a quantitative guy, who likes to write programs to verify what patterns worked in the past. Do you think we could perhaps work together on formalizing/back-testing some of your insights? It might be a very profitable operation for the both of us and something might come out of it.
(1) Where do you source such opportunities? Do you receive alerts when a company breaks out of a flag pattern. I can help you there if you’d like something like that and don’t have one already. Did you actually track this Zensar tech or RS Software?
From what I understand the signals you take into account when you make a call are:
(1) A sector stocks flying high, but a few stocks have remained laggards, and you like the laggards.
(2) The laggards have some positives happening for them fundamentally.
(3) The price action breaks out a flag pattern (I don’t really know what that means).
Although, the question is directed towards Hitesh bhai, I would like to add few things here.
Hitesh bhai on an average dedicates two hours a day for stock research (other seniors like Donald, Ayush, Vinod and others do the same or even more) and this would most probably exclude time that he dedicates for reading books. Hitesh bhai (and even Ayush) has loads of knowledge about most of the companies and sector and it is his hard work and commitment which stands out. You can ask them about most of the companies and they would have some or the other knowledge about them.
Also, if one looks at the pattern of Hitesh bhai’s technical calls, they have always been on companies which are fundamentally strong, mostly debt free and are undervalued (you would never see him giving a technical calls on stocks like Suzlon, HCC etc). If I remember properly, Zensar has been on his radar for a long time.
Looking closer, it seems that the old revenue stream contract that was expiring this may was merely renewed. Also the size of the deal is 7M$ over 5 years, hence it is very small compared to the company’s revenue base.
Similar curiousity on how Hitesh recognises flag patterns came to me - Will wait his words on it.
Meanwhile I had tried systemising the tech calls by Tony - to a simple extent of tracking 25 DMA and 100 DMA for each stock on a google spreadsheet. The formula for getting the 100 DMA value is: =sum(arrayFormula((query(googleFinance(StockCode;“close”;workday(today;-100);today);"Select Col2 label Col2 ‘’ ";1))*row(indirect(“A1:A” & query(googleFinance(StockCode;“close”;workday(today;-100);today);"Select count(Col2) label count(Col2) ‘’ ";1)))))/sum(arrayFormula(row(indirect(“A1:A” & query(googleFinance(StockCode;“close”;workday(today;-100);today);"Select count(Col2) label count(Col2) ‘’ ";1))))).
Similarly for Flag Pattern recognition, I think we can use “slopes” of lines connecting prices of various times just by using google functions and try and see where the slope turns from positive to negative and again positive. Am suggesting googlefinance functions since I think someone like you can quickly do a validation of the logic for a range of stocks without even having to write code. Hope am making some sense and not talking just non sense.
For the choice of stocks and choice of length of slopes and time intervals for slope direction change you need to talk to Hitesh.
I dont use any screeners or any program to detect the patterns which I follow.
Flag pattern is basically a short term consolidation in stock price (without too much price damage–only time correction ) after a sharp run up. Essentially the stock price is taking a breather after its sharp run up. And this offers entry point for anyone following the stock price pattern closely.
If I see a pattern in a particular stock I make it a point to see the sector leaders and similarly placed companies in the sector.
Coming to zensar you can also spot similar patterns in HCL Tech, HGS, KPIT etc all in the software stocks basket.
I cant identify with the logic of laggards of a particular sector making such patterns.
The stock has underperformed NIFTY over 6mo and equaled NIFTY over a 3mo timeframe. I’ve been scouring the net to get any info about some negatives but don’t see any (yet). I’m contemplating increasing my position.
I think there is a promoter overhang on this stock and that’s why despite strong fundamentals it’s not performing upto the mark. Promoters are not perceived to be minority friendly by the market and very rightly so. In the strong bull run, It might be neglected though.
Zensar Technologies announced a marginal decline inconsolidated net profit for the quarter ended June 2014. During the quarter, the profit of the company declined 8.17% to Rs 559.60 million from Rs 609.40 million in the same quarter previous year.
Net sales for the quarter rose 14.70% to Rs 6,119.50 million, compared with Rs 5,335 million for the prior year period.
Earnings per share for the quarter stood at Rs 12.50, registering 8.83% decline over previous year period.
Hi hitesh
Nothingspectacularabout the result and although the downside is limited what according to you can be the potential trigger forre ratingor for thetechnicalsto play out ?
Not bad results as it seems looking at Net profit and Eps. Sales grew more than 11%.
There was 78Cr increase in employee benefit expenses compared to last year. 23Cr less in other income. For IT sector these are not really negatives. In coming quarters we can see more improvement in margins.