
It is following Elliot Wave principle of 3 Corrective Waves.
WTI crude oil hs given a very very bearish signal on weekly charts… if WTI closes this week with a long red candle, then it signals that the crude oil rally is over…as oil falls, it will drag down the global equity markets and NIFTY…
1 Like
What are prospects of sanghi industries in long term? They seem to have written 25 cr as exceptional loss in their AR. What it means?
Ramu
1 Like
When this thread was started about 20 months ago, I thought the relevance of this topic would wane shortly, but I was wrong 
3 Likes
Companies which are not dependent on EU and gets its major revenue from Indian market looks good to add in recent fall, like -
company
Sandesh
Bharat Rasayan
MRPL
Nesco
Borosil
FCEL
(Disc : Holding all, except MRPL under watch list)
1 Like
I am just 35% in stocks atm. Plan to use part of the rest 65% to buy some existing portfolio stocks and some new ones in this correction starting today-
Arman Fin. (largest part of portfolio at present)
Satin creditcare
Innox Wind (bought today for the first time)
Manappuram
Motilal Oswal
Ambika Cotton
IIFL
Jubilant Life
Icici bank
Oriental carbon
Shilpa Med
Cheers.
Need advice on Gold and FD. Some 50% of my money is in FD and 5% in goldbees. What to do with these? Should I be breaking the FD prematurely (I guess I would be) to deploy money in stocks?
Thanks
1 Like
My advice would be to always maintain some sort of asset allocation between Equity and Debt/FD. Going all in for Equity means you are dealing with a lot of uncertainty and volatility.
-
Decide on your asset allocation based on your goals - typically 60-40 (equity:debt) for longer term goals. If goals are much close 5-10 years or even closer debt component has to be much higher.
-
do frequent rebalancing of portfolio to maintain this allocation - this ensures when market goes up you take money out to maintain 60:40
-
for debt component you could look at Debt mutual funds as you would get indexation benefits on long term capital gains.
you could read more on freefincal.com - I found it a very good source for mutual funds and general gyan on personal finance
2 Likes
This got buried in other messages; missed replying earlier…
MCAP source: http://www.bseindia.com/markets/keystatics/Keystat_maktcap.aspx?expandable=0
- BSE highest MCAP = 106.42L cr (Aug 06, '15)
- BSE MCAP today = 106.33L cr (Jul 14, '16)
- BSE lowest MCAP (TTM) = 85.83L cr (Feb 29, '16)
GDP source: http://mospi.nic.in/Mospi_New/upload/nad_press_release_31may15.pdf (page 6)
- Not sure if the above is the best source
- GDP (for FY16) = 135.76L cr
- GDP (for FY15) = 124.88L cr
Per Economy of India - Wikipedia, nominal GDP of India is $2.4 trillion (does not match with the above).
can you please elaborate your rationale behind the nectar life sciences and fcel
thanks
@hitesh2710 bhai
Market is again going through Feb 16 type of phase, many stocks are really cheap, reminds me of 2011-13 period, those sitting on cash will be really loving it  , others can do lots pf PF switching to maximise gains, other can simply sit tight as this too shall pass
Cheers
1 Like
This is no where comparable to feb lows. Only few stocks which are presumed to be hit by DeMo have corrected deeply. The broader market made mild correction. Range bound market. This is an observation made looking at my portfolio.
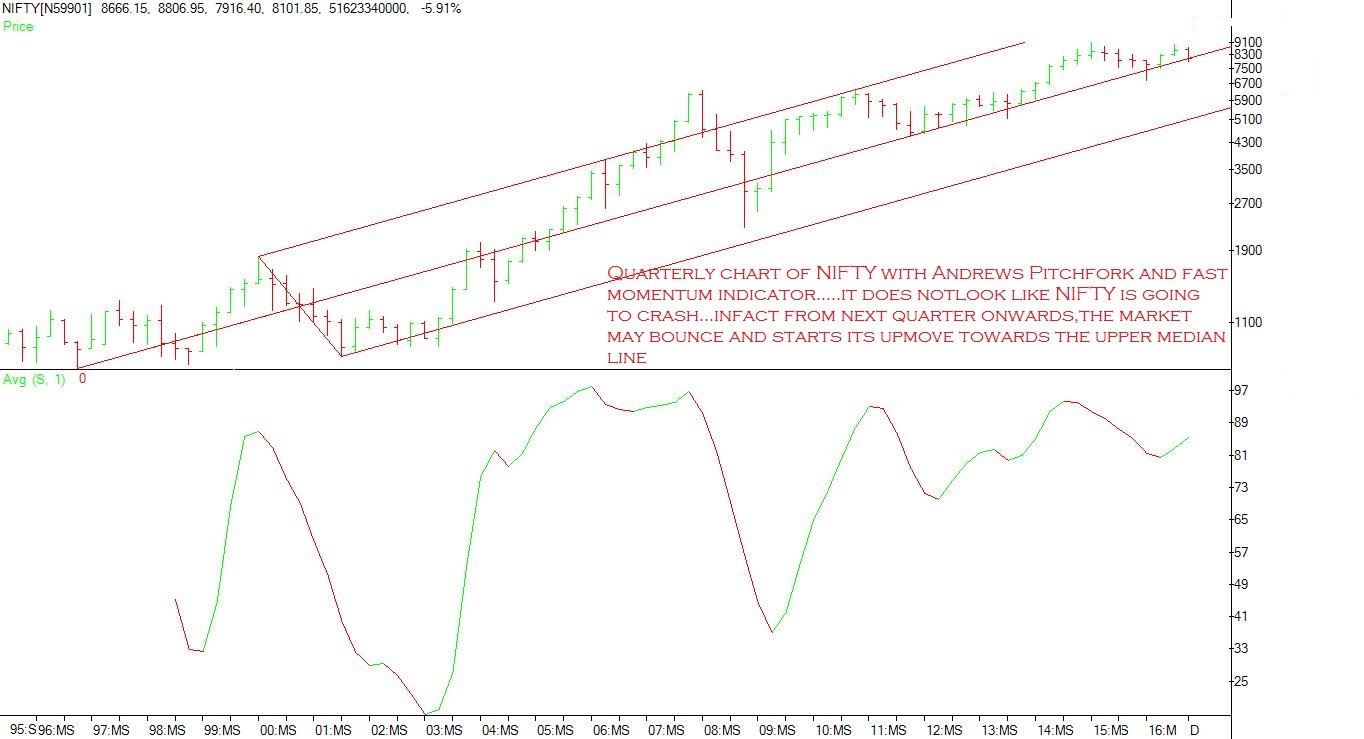
Pl download the above chart on your laptops and study it closely. It beautifully captures the underlying symmetry of Indian market.
The middle forkline on the chart presents the levels at which the market gets buying support…
The market did not fall to the lower channel line even in the 2008 bear market…Or sept 2013 panic…
There is no reason to believe that the economic situation now is so bad that market will fall to lower forkline @6000.
So if the buying support @ middle forkline continues… then even if the market falls, there will be a quick pull back to the middle forkline…
All these go on to show that we are now in a bull market correction…
And the most appropriate strategy in a bull market is to buy into the corrections and then adopt a buy and hold strategy.
The upper channel line on quarterly charts… that I have posted represents the top of the Namo 1 bull market…
It may happen either in 2017 or maybe 2018…
After this the market will start demanding performance from the Modi sarkar…And go into a long correction / consolidation.
This is important now… Because, the time to move hugely into cash is not now…But when the above topping out of Nifty takes place…
9 Likes
where is the chart.Unable to find any attachment
1 Like
Mehnaz
What is the level on upper side as per the chart?
Nifty reaches the upper fork line @13000 - 13500 levels…
1 Like
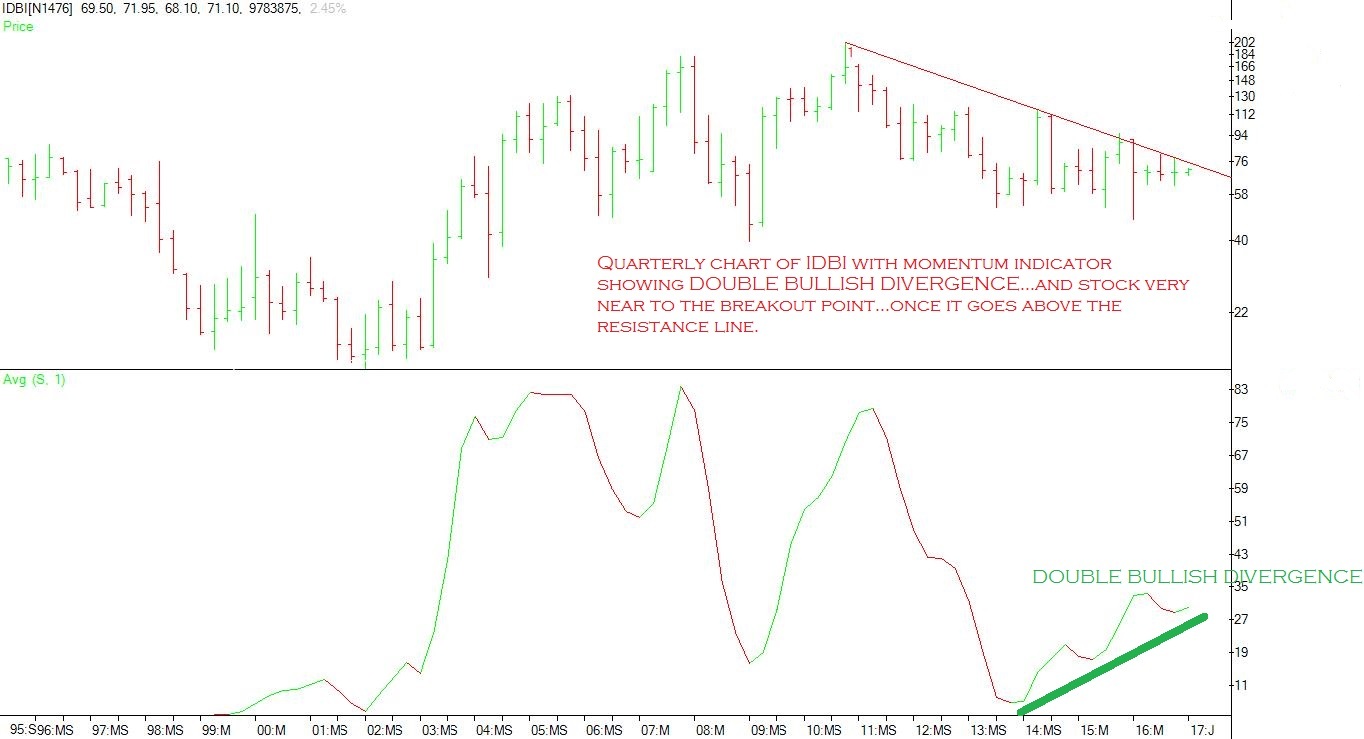
Fundamental analysis of banks is not possible for most individual investors…Hence here investors would do well to rely on the collective wisdom of the market as well as better informed big institutional investors through Technical Analysis.
Below is the chart of one such stock…IDBI.
It’s showing a very rare technical formation - DOUBLE BULLISH DIVERGENCE ON QUARTERLY CHARTS…A very good investment opportunity for long term investors and practitioners of slow investing…
Now offering good margin of safety… if bought above the resistance line…And using the said line as stop loss…
Investing at these levels, there is very little possibility of permanent loss of capital.
3 Likes
Incidentally, there are quite a few banks which are giving very strong bottom formation signals…Just when all the experts have turned bearish on banks.
I think, there may not be many retail investors / weak hands still invested in such beaten down sectors. Once the stock moves into strong hands and weak hands are driven off…Its just a matter of time before the rally starts.
3 Likes
Which othe rbanks you like on techniocals Mehnaz?
There are quite a few of the banks… where clear sings of bottom formation can be seen. Risk reward ratio hugely favours the buyers in these banks. Will post the charts of these banks /NBFC/financial institutions…
2 Likes