
Thanks to all participants for the energy and vigour brought to the deliberations!!
14 Likes
Thank you Donald, Ayush & others who organized this. It was an immersive session. Learnt a lot. Still need some time to sink in all the learning
2 Likes
Two big breakthrough WoW realisations from VP Annual Meet 2016, which “stunned” us students of the investment game into a few moments of “pregnant” cathartic Silence. I will share these with you in a moment, but first let’s step back a bit.
The 2016 Agenda, as above - just sort of dropped into my plate - one fine day, when I had another of those flash of an Eureka Moment. The “Expanding Our Horizons” Theme running through came about because I realised, most of the group had reached a certain level of competency; we were rarely committing mistakes of commission now but mostly the mistakes, were of Omission.
Mistakes of Omission, I realised happen more often than not, when we aren’t exposed to our “blind spots”. I realised the best way of expanding a competent team’s horizons is to badger them relentlessly with their blind sides. And I have a pretty developed theory on this now 
-
The diverse Investment Community can be neatly broken up into two broad categories- The (overly) Optimistic Investor and the (overly) Skeptical Investor (VP Team diversity of talent pool too can be be cleanly divided on these lines)
-
The (overly) Optimistic Investor needs to be “SHOCKED” out of his Optimism (more so when accompanied by success) Induced blindness by bludgeoning him RELENTLESSLY with a WHOLE DAY of RISKS ASSESSMENT/MANAGEMENT (which will bore him to death no doubt, but nevertheless leave him somewhat “aware” that he sure is MISSING something - when he sees a rather small bunch of guys (the skeptics he otherwise RESPECTS) battling it out so passionately on something that makes sense to him at a high-level, but he can never get his fingers around - usko yeh baat “chamkana” is like an impossible herculean task, and normally it is.
-
The (overly) Skeptical Investor needs to be also exposed to his blind side about his/her perennial inability to appreciate the excitement about a superior business by giving him something that he/she surely needs to MULL on by giving him something so TANGIBLE that he is forced to ACKNOWLEDGE, hey maybe, maybe there is something that I can finally get my fingers around.
I just knew we would reach somewhere if we sincerely gave this a shot, and in my own inimitable style over-rode a few (mild) objections raised to the Agenda above by saying “please TRUST ME, I KNOW what I am doing” (ha ha …implying they don’t know what needs to be done); telling them further “remember I have allowed you guys to tell me anything you want straight to my face, but you have also allowed me the final veto, if I feel I need to”.
So back to the Two big breakthrough WoW realisations from VP Annual Meet 2016, which “stunned” us students of the investment game into a few moments of “pregnant” cathartic Silence. It slowly but surely dawned on us that
-
None of us could assign a “Terminal Value” to our favourite businesses
(and the implications, of that) -
None of us had ever given enough thought of the havoc “Disruption” could wreak on our favourite businesses, and how ( its much nearer, or more real than we think it is)
Think none of us would have any hesitation in admitting that the above two breakthrough realisations for us could not have come about (nay, impossible) without the gentle, patient way we were nudged towards that by our two Gurus Vinay Parikh and Prof Sanjay Bakshi. If we gave 110%, they gave 200% and more 
The only Guru-Dakhina we can provide our Gurus for the love and affection and WISDOM they showered on us, is to carry this agenda forward, by owning these two as favourite “Projects” for next 6 months to illustrate more tangibly what we really learned. To get anywhere near enough to convey the enormity of this learnings would perhaps take us not less than 6 months - of hard sustained, dedicated work to bring these ALIVE.
Hoping meanwhile that some of the Participants would care to capture back their impressions here, that might give others a more clearer glimpse.
39 Likes
@Donald ,
If I understand correctly, terminal value of our favourite company seems to be related to exit multiples of a company, ie how many more times do we expect our company to grow in terms of EPS (or market cap) before we think it is the right time to exit.
In my understanding, this boils down to:
(P/E expansion ratio) * (EPS cagr) ^ (years elapsed between now and exit)
If we ignore equity dilution, I guess EPS cagr can be replaced with Profit cagr.
Now if we follow the above, it boils down to finding the right time to exit.
One possible case when I think it makes sense to exit is when the company has reached its Maximum operating margins. For example, if currently Alembic Pharma is at a (latent) Operating margins of around 22.5%, I would want to consider exiting when it starts touching 45% Operating margins because I think that 45-50% is kind of touching the Ceiling in the pharma business (although I might be wrong).
Now, how does one figure out if the operating margins is at all going to increase (if not decrease) from current level?
I do this by plotting Sales vs Operating Profit of last 3 years. For simplicity, I cumulate 3 quarters into a single data point which gives me 4 data points (as 3 years would have 36 months thus, 36/9 months = 4). This gives a plot of something this kind:
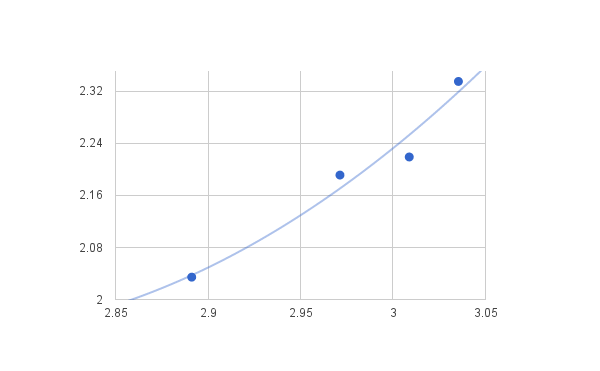
The X axis is the Logarithm of Sales value and Y axis is the Logarithm of Operating Profit. The line basically is a 2 degree polynomial fit to the 4 data points.
Now there is a lot of subjectivity here:
- How many previous years data should we use? Maybe we should have more data points?
- What should be the granularity of each data point? Should it be 3 quarter cumulated together or should it be yearly?
- Whether one should take Operating profit or Net profit or EPS?
Before we delve into these subjectivities, I want to go further with describing why I plotted previous years Sales and Profit to see whether the margins would increase or not. If I see the data following a curve trend like this:
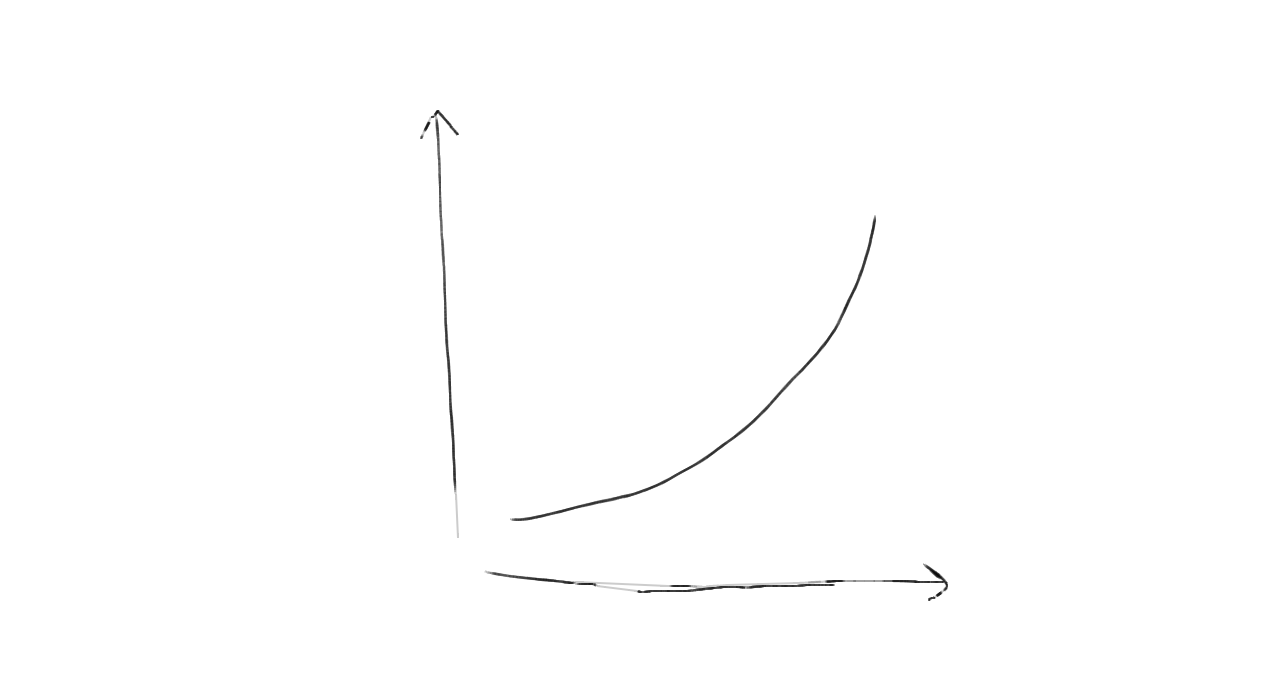
then what it means that the margins have been accelerating. Not increasing but accelerating margins. Once I confirm this pattern, I start digging into Earnings calls, annual reports of last 3 years as well as Valuepickr thread on that company to find out what is management doing. For example, in alembic case I figured out that the management has been gung-ho on investing in R&D to market products which have potentially higher and higher margins. And also for the future, they have set up their own marketing unit in US to avoid sharing profits with their marketing partners. This gives me confidence that this acceleration of Operating margins will continue for a while till it reaches its close to max possible margins.
Then I build a very conservative 2 degree regression model which captures this acceleration of margins. Then I throw in different Sales growth rate and number of years to this model to get the profit growth and margins as outputs. When I notice that maybe at 22-24% sales cagr for next 6-7 years, the margins will posibly get to 40-45%, I decide that maybe that would be the time to exit. Then I calculate the exit multiples for this company, considering an arbitrary hypothetical P/E ratio at exit point equal to profit cagr (so if profit cagr is 35%, then maybe 35 P/E)
PS:
One thing which I have been also working on is to model the Sales vs Operating margins of a sector. I am trying to tackle this by taking the historical annual results of Sector leaders (like Sun pharma in case of Pharma sector). Take a look for Sun pharma for last 22-23 years:

The Y axis is the Net profit margins and X axis is the Logarithm of the sales for Sun Pharma. My hypothesis after looking into this graph and roughly studying other companies is that the underlying curve is of the following trend:
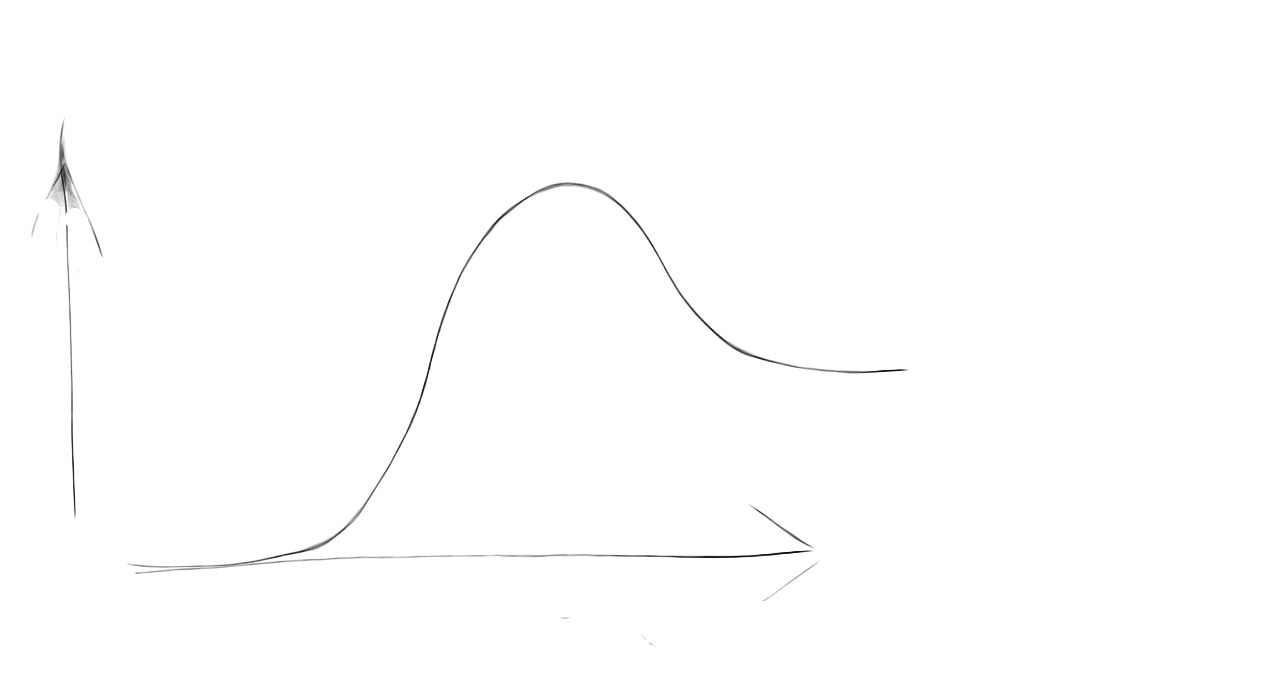
Where y axis is the margins and x axis is the sales. This curve basically says that in the beginning, the company starts with a low margin, the its margins accelerates and then starts decelerating until it reaches the maximum margins. Then there is a continued deceleration till it finally settles down to a saturated level. This probably happens in a whole life cycle of a company’s existence. (Maybe 30-40 years??)
PPS: Forgive me if all of this seemed gibberish. I come from a quant and science background, trying to understand the business from data modelling approach. There are many possible holes is this whole process and I would be more than willing to collaborate with anyone who likes Qualitative analysis of a company.
Disclaimer: I took alembic as a case study. I am also invested in it. I am not recommending anything out here.
4 Likes
Donald,
I missed this years session…
Please add me to your E-mail list for Next Session/Chintan Meet…
Thanks