I wanted to offload the last documentation last time, let me try this time:
Confession- I have holding in this stock, but timing of purchase are completely different. This document is a refresh of investment note of last time.
The risk management portion:
CBR 3: RISK MANAGEMENT
Basics of Business & moneymaking
A vehicle on road cannot move unless it has fitted with tyres irrespective of nature of vehicle be it personal use or commercial use.
TVS Shrichakra is involved in manufacturing in 2 and 3 wheelers tyres. 2 wheeler are used for personal convenience where as 3 wheelers are multi purpose. Some 3 wheelers used for ferrying people, some for goods. The flexibility of 3 wheelers for city usage and nuke and corner of streets is higher due to it small size. Small cities have a passenger demand using 3 wheelers.
TVS Shrichakra is part of century old TVS group. The group interest extends to manufacturing 2 wheeler and 3 wheeler, auto electronic equipment’s, enterprise solution for automotive, auto finance, auto distribution, auto brakes, turbo charges for engines. TVS have almost integrated all of automotive requirements when it comes 2 or 3 wheelers.
TVS Shrichakra’s main source of revenue is by selling tyres. Tyres are either sold to original equipment manufacturers who makes these vehicles or for after market use where tyres are replaced with new tyres. After market sales offer better margins due to dealer network and fragmented users. OEM offers low margin due to bargaining power of buyers as consolidated contracts. Tyres are one time sale but comes with 5 year warranty (six months for 3 wheelers) where manufacturing defect can be replaced. Other defects are taken on pro rate basis where inspection results are important.
The average life of 2 wheeler tyre is around 25000 km. Three wheeler around 8000 Km.
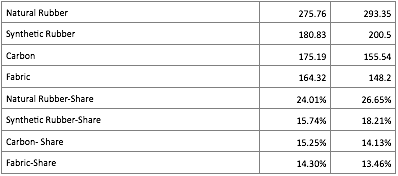
Major cost is raw material; a significant component goes for rubber followed by carbon black, chemicals and steel.
There are two types of tyres, bias tyre and radial tyre. Majority of the tyres manufactured for 2/3 wheelers is radial tyres. TVS Shri claims to have 2400 dealers and 300 depots.
Over view of tyre industries
39 tyre companies, 60 plants with a turnover of 48000 Cr. The total export for last year was 10200 Cr. 123 million tyres were produced.
Raw material cost is around 70%. Rubber constitutes 42% of raw material cost. 26000 Cr investment proposed during last year. The demand supply gaps are around 9.5% (demand is higher by 202485 MT).
The OEM segment is growing at 5% where as after market is growing by 15-16% CAGR. The after market tyres have high margin but requires brand building and distribution.
Tyre manufacturing process
Tyre manufacturing goes through five stages
Stage 1 is called compounding and mixing where raw materials are brought together and mixed at high temperature in a machine called massive mixer. The output from this stage is called cooled rubber slabs.
Stage 2 is called as component preparation. The rubber slabs goes through extrusion where heat and pressure applied to create tread and sidewall. Calendaring is where fabric and steel is introduced. Also bead is build.
Stage 3 is tire building where components are preshaped to proper positions.
Stage 4 is known as curing where a tyre attend final shape and tread pattern. Cured at high temperature , tires popped from molds.
Stage 5 is final stage where tire inspection is carried via machine for durability, strength etc.
Customer view of business
The customer finally is an end user. But first delivery takes place via vehicle manufacturers. Further replacements are done by end user themselves.
Customers are price conscious when it comes to 2 and 3 wheeler replacement. There is a sense of affiliation with the next door mechanic where each customer races. These mechanics dictate the brand and buy from dealers. The scene is slightly different in urban land. With integrated service centers, better customer awareness the fragmentation is less than rural world.
In the OEM world there are limited number of customers, for TVS Shri , associate company TVS Motors is also one of manufacturers. The after market world is fragmented and spread across.
Dealers do not influence the psychy of mechanics, though mechanics can influence end user.There is very little inter action with end user and Company. Tyre companies are launching promotional awareness, campaign to make them more familiar. Tyres are need to have products.
TVS Shrichakra Financials Overall View
The Balance Sheet
Key Balance Sheet items:
reserves
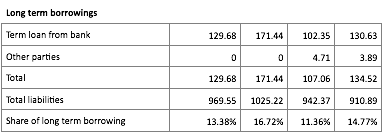
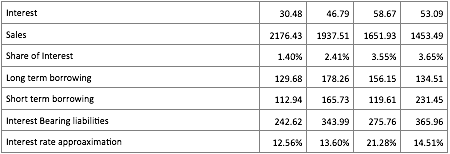
Long term borrowings
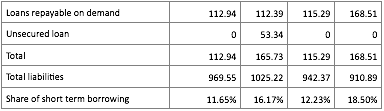
Short term borrowings
Trade Payables
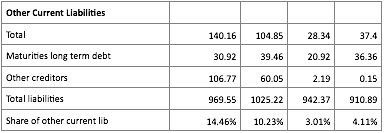
Other current liabilities
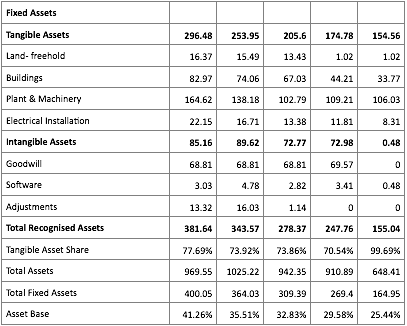
Fixed asset
Intangible assets
Inventories
Debtors
Trending of Key Balance Sheet Items
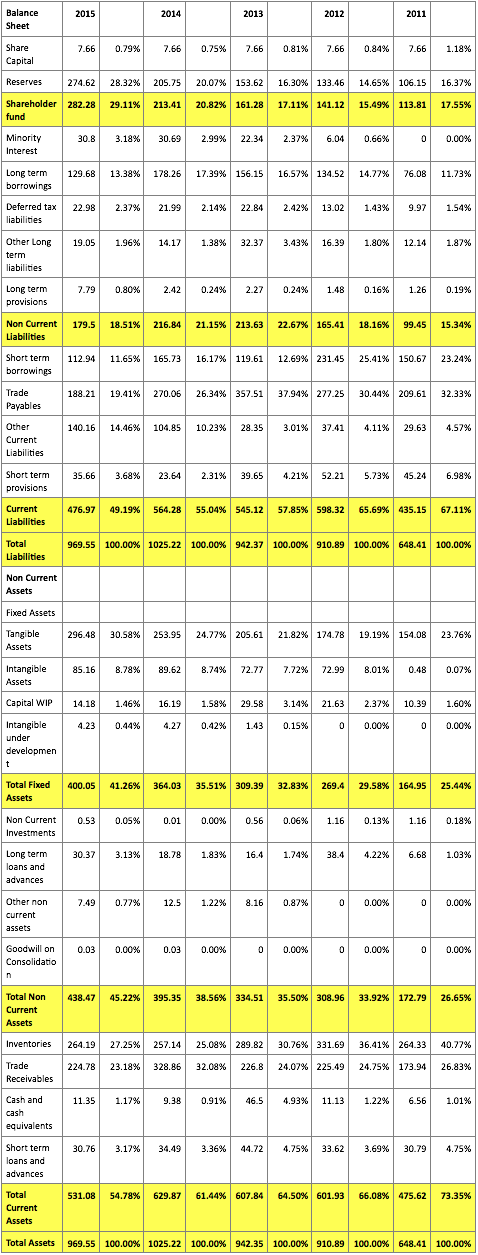
Shareholder fund has gone up from 17 to 29% during last five years. The decrease in current liabilities is supported by mild increase in non current liabilities and minority interest.
The decrease of current liability is supported by decreasing short term borrowings, reduced trade payables. However other current liabilities have shot up.
Within non current liabilities long term borrowings has been steady.
From asset side company has become more asset centric i.e. 25% to 41% of total asset in 5 years. This increase was supported by a equal decline in current assets.
The addition to fixed assets comes from tangible, and fresh new addition of intangible assets from 2012 onwards.
Sharp decline in inventory contributed to fall of current assets.
Key take away:
Owners are gaining ground in ownership where they have increased their stake from17% to 29%. This gain came with reduced current liabilities. The working capital management has contributed this rise (reduced inventory, short term borrowings and trade payables).
Long term borrowings has not changed much since 5 years, but new loans were added and old ones getting paid.
Tangible asset have been increased dramatically by 20 basis points. The rise gives much needed cushion for a manufacturing industry. Again this is primarily possible by stringent working capital management can be seen in both debtors and inventories.
The Profit and Loss Account
Key profit and loss account items:
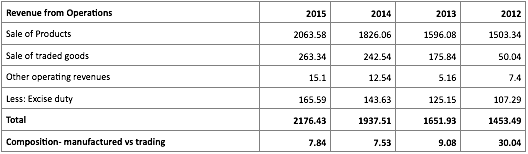
Revenue from operations
Cost of materials consumed
Purchase of traded goods
Employee Cost
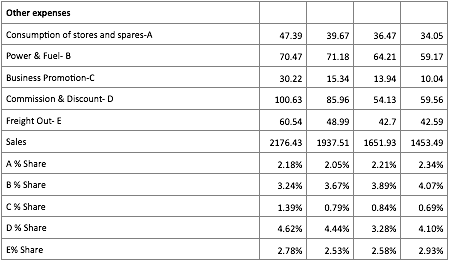
Other expenses
Finance costs
Depreciation
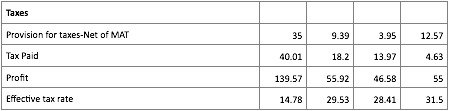
Taxes
Dividend
Exceptional item in 2015
Trending of PL Account
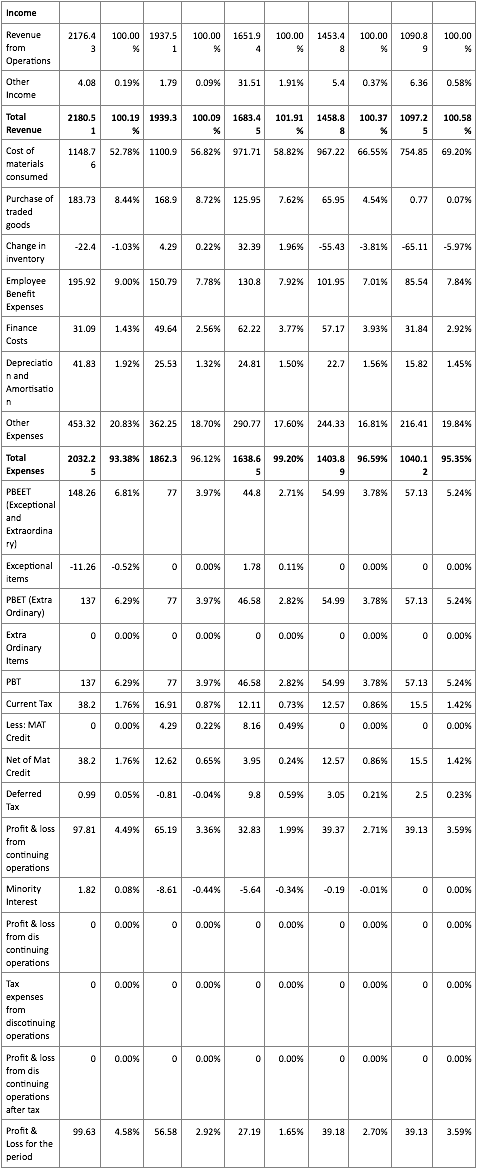
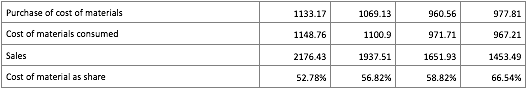
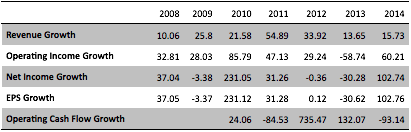
Revenue from operations dominates top line, indicates TVS Shri has spend all the money in capex requirement or other business reinvestments.
Profit before tax has started showing upward curve, primarily due to decreased cost of raw materials.
Trading goods introduced during 2015, we need to check this bring additional margin or a low margin business.
Exceptional item of 11 Cr during 2015.
Key take away:
We have to find out the decline in raw material cost. Was it the imports which reduced the bill or trading goods is replacing manufactured goods? If yes what is the impact of fixed costs born by plant.
The decline in raw material has not added to margin, but expenses otherwise has been steady. The inventory balance has created the additional 2-3 basis points for margin. It also indicates TVS Shri does not enjoy pricing power, the battle is managing the bottom line.
Significant item of balance sheet- Reserves
TVS Shri reserve includes 4 catgeories:
Capital reserve- exhausted and insignificant
Securities Premium Account- active account but insignificant amount
Surplus on amalgamation- small amount
Surplus or retained earnings- the accumulated profits
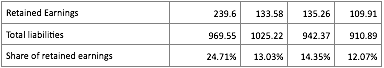
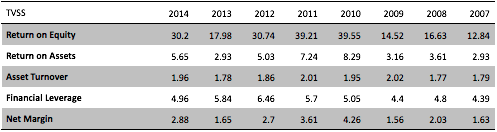
The owner earnings has been steadily rising which reduces outside exposure and increase the health of clean funding. Question is have this retained earnings delivered returns?
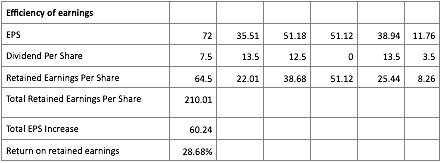
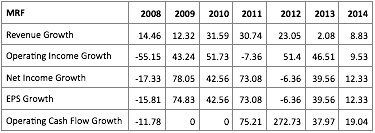
That’s stunning way of reinvesting earnings which has generated 28% return. This has catapulted the EPS 6 times in 6 years. Question would be is this sustainable going forward?
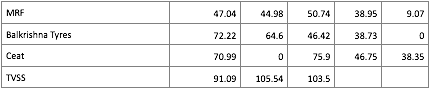
Significant item of balance sheet- Trade Receivables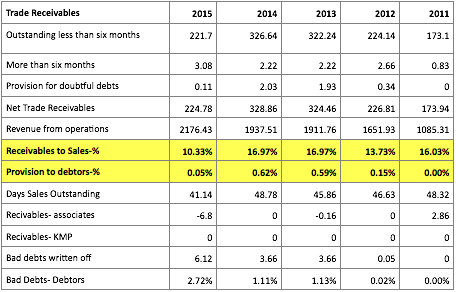
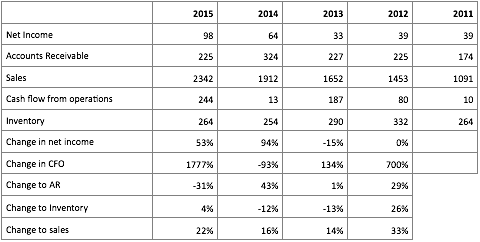
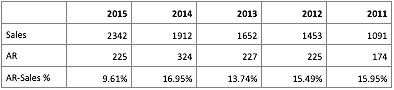
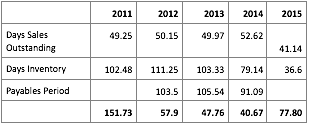
Receivables overall is going down in tandem with sales, last year shown some sharp up moves …we can see days sales outstanding down to 41 from levels of 46-48.
The transactions with associates are almost absent, I think TVS Motor is shown as non associate.
Bad debts have mildly increased, however over all debtors has nose dived to all time four year low.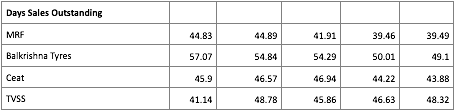
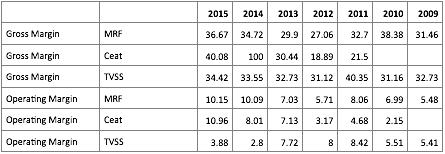
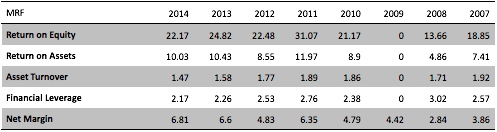
On a industry scale except Balkrishna all other 3 guys including MRF moves neck and neck though TVS Shri has made a stellar come back during 2015.
Significant item of balance sheet- Inventory
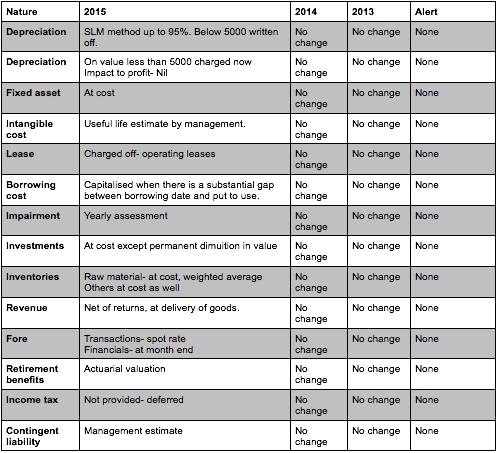
TVS Shrichakra inventory includes raw material, finished goods, trading goods and spares. Inventory valuation is done at cost with weighted average.
Nature of inventory- rubber, chemicals and carbon black. Rubber is key component which is a seasonal product, with so many competitors enjoys good liquidation value.
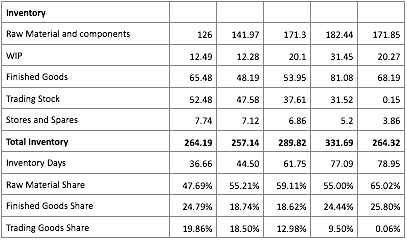
The inventory composition has seen major changes in last five years, raw material share has been going down from 65 to 47. The deficit is compensated by rising trading goods stock. Is this a temporary phenomenon? The rise in trading goods is rising steadily year after year.
Whether management moving to more trading model, if yes then what happens to fixed cost management?
Who supply these trading goods?
Inventory holding have gone down drastically from 79 to 37. 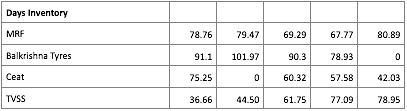
TVS Shri is an outstanding winner in inventory management. It almost managing less than half of its nearest competitors is doing. Is this temporary?
Pasting one by one, hope it will help.