
Just to add, in the last conf call Torrent had said that their real market share in Aripiprazole is 15% since some of their distributors do not report numbers. Would be interesting to know their numbers in Detrol and Nexium.
I am seriously impressed by Torrent’s ability to garner market share.
2 Likes
As per Bloomberg data, Torrent has market share of 12% in gDetrol and 1.3% in gNexium.
They have been able to capture good market share in Detrol post approval from USFDA.
4 Likes
Thanks alot @hitesh2710 and @ankitgupta
Nexium looks pretty low. Is this because the data is from close to the launch by torrent?
1 Like
yes nexium is only recently launched, approval was on 19 oct 2015 and will take some time to get established. innovator astra zeneca still has around 60% market share.
the benefit in nexium is that a potential strong competitor in form of dr reddys is temporarily out of the field.
needs to be seen how torrent exploits this opportunity.
1 Like
USDFA regulations hit prospects fo Sun and Dr Reddy’s
Interesting question here would be - what are the manufacturing practices/standards that are being questioned from USFDA? If so, why would the investors flock to the smaller companies? Why can they maintain better operational standards? Simply because of the size of the operations?
PS: This piece of news is generic to the Pharma Industry
1 Like
Medicare Drug Spending Dashboard
December 21
To view the Medicare Drug Spending Dashboard, visit: CMS Drug Spending Main | CMS
December 21, 2015
By Andy Slavitt, Acting CMS Administrator and Niall Brennan, CMS Chief Data Officer
Medicare Drug Spending Dashboard
Just over a month ago, HHS convened a forum that brought together consumers, providers, employers, manufacturers, health insurance companies, representatives from state and federal government, and other stakeholders to discuss ideas on how our country can meet the dual imperatives of encouraging drug development and innovation, while ensuring access and affordability. The conversation touched on many ideas to increase access to information, promote value, drive innovation, strengthen incentives and promote competition.
Today, CMS is releasing a new online dashboard to provide information on Medicare spending on prescription drugs, for both Part B (drugs administered in doctors’ offices and other outpatient settings) and Part D (drugs patients administer themselves) to provide additional information and increase transparency. Having this information available to the public in an accessible format should inform health care decisions, policy considerations and encourage collective problem solving around these important issues.
This interactive dashboard allows consumers, policy makers, academics, manufacturers, purchasers, consumers, and other stakeholders to see six lists, comprising 80 drugs — three lists for Medicare Part B and three for Medicare Part D, sorted by the:
Top 15 drugs by total annual cost,
Top 15 drugs by the highest spending per Medicare user, and
Top 10 drugs with the highest annual increase in cost in 2014.
The dashboard includes information on each prescription drug, including cost trend analysis, brand names, generics, and the name of the manufacturer, and provides easily searchable, detailed information and data. The 80 prescription drugs included in the dashboard represent 33 percent of all Part D spending and 71 percent of Part B drug spending in 2014, or $55 billion of the more than $143 billion in Medicare prescription drug spending in 2014. Prescription drug spending in Parts B and D was 14 percent of total Medicare spending in 2014, up from 11 percent in 2010 – just five years ago.
In today’s announcement, the topline findings include:
The diversity, growth, and impact of drug spending in the Medicare program – while the high-cost drugs include brand name Hepatitis C and cancer therapies, some generic drugs are seeing large price increases.
The trends of how drug spending change and shift over time – for the Medicare program, its beneficiaries, manufacturers and by condition.
Other insights include:
The five Medicare Part D drugs with highest total drug spending each accounted for more than $2 billion in spending in Part D in 2014 and more than $1 billion in Part D in 2013.
The highest increase in spending per unit in Part D was 500 percent and in Part B it was 78 percent.
The highest cost per user in Part D is Sovaldi at $94,056 and for Part B is Remodulin at $133,845 per user in 2014.
Our Larger Goal: Broader Data Availability
The Medicare dashboard, of course, is only part of the story. While it will help answer some questions, we acknowledge that there are other questions it does not answer:
The dashboard does not provide the net prices paid to manufacturers or the rebates to plans and prescription benefit managers. In the Part D program, we are not permitted to disclose the rebates paid by manufacturers to Part D plan sponsors. And for Part B, Medicare does not receive a rebate, but pays 106 percent of the estimated average sales price of each drug, which reflects the average prices paid by physician offices and hospital outpatient departments net of discounts and rebates.
The dashboard includes average cost sharing information, but does not show what any particular beneficiary will pay, as the latter would require information on formulary tiering, co-payments, and mail-order preferences from Part D pharmacy benefit managers (PBMs) and health plans. Likewise, in Part B providers can increase cost sharing of the drug, and information on those increases isn’t widely available.
The dashboard does not show spending for other payers like commercial purchasers, Medicaid, or other federal purchasers like the Veterans Administration or the Department of Defense.
Most importantly, the dashboard doesn’t provide information on the clinical or financial value of the drug. While the dashboard describes the therapeutic uses, these data do not capture the value these drugs can have on managing chronic disease or improving or extending quality of life for patients. For instance, the Hepatitis C drugs presented in this dashboard are an example of where spending has increased dramatically, but have brought about a major shift from the standard of care that previously existed for Hepatitis C patients.
We realize the dashboard doesn’t provide a complete picture, but still believe that, by sharing this information and allowing people to analyze the data, we can increase the knowledge around drug spending and support efforts that are evaluating whether public dollars are being spent most effectively. The drugs included in dashboard are likely to have an impact on spending and should spur public discussion of how these products are affecting the Medicare program.
We also seek to stimulate the release of additional data that will promote a more complete understanding of value and patient affordability. We believe that there is complementary data now available from other entities on rebates, clinical effectiveness, pharmacoeconomics, comparative effectiveness, safety, formulary placement and discounts on these drugs, including the Agency for Healthcare Research and Quality’s (AHRQ)EPC Evidence Based Reports. Our hope is that over time outside parties will release this type of information in order to broaden the understanding of these drugs.
CMS’s Commitment and Responsibility to Data Availability
Over the past several years, CMS has made it a priority to make more data available including, publishing extensive information on utilization and payments in the Medicare program. Starting in 2013, we published data on inpatient and outpatient hospital discharges by individual. We also started releasing payment and utilization data on the services and procedures provided to Medicare beneficiaries by physicians and other suppliers in 2014. Since then, we have also released similar information on the prescribing behaviors of physicians and other healthcare professionals as well as information on those who ordered durable medical equipment, prosthetics, orthotics and supplies items and services. Today’s release is part of that larger effort.
We are committed, as we always are when we publish data, to receiving input to make sure the data are accurate, fairly presented, constructive, and shown in a way that protect the identity of beneficiaries. Physicians, pharmacists, patients, manufacturers, researchers, and others are encouraged to provide us with feedback to inform our understanding of these data and make sure they are presented appropriately. If you have ideas on what other data would be useful for the federal government or the private sector to release that increases visibility into the economics of drug pricing and are relevant to better health decision-making, please email us at druglistinput@cms.hhs.gov.
Today, we take an important step forward in improving understanding and expanding the dialogue around the topic of prescription drug costs. We at CMS look forward to continuing this work in partnership with stakeholders to find ways to continue to improve the affordability and accessibility of life-saving prescription medications for beneficiaries in Medicare, Medicaid, and other health insurance programs.Medicare_Drug_Spending_Dashboard_Data_2015-12-21.xlsx (110.7 KB)
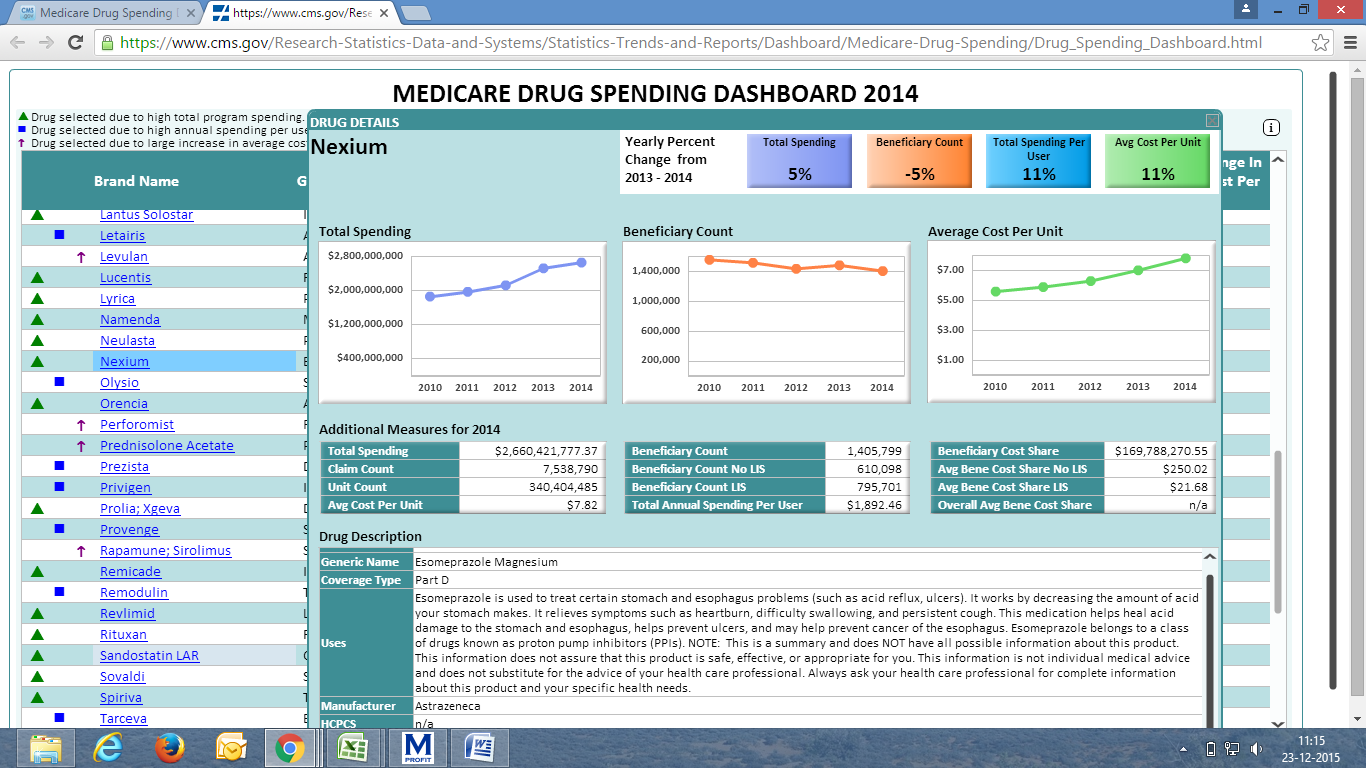
Nexium spending in 2014 is USD 2.66 Billion, change is 5% compared to 2013, Abilify is USD 2.53 billion and change is 20% compared to 2013

4 Likes
all this is useful but should it all be in Torrent (except the last one)…this is more generic pharma related update
Aurobindo Pharma has got tentative approval for Nexium. they still havent got the final approval.
Torrent got the approval in October but there market share is still below 5%.
will be interesting to watch the market share and pricing trends post the launch by Aurobindo.
2 Likes
Torrent get approval for gCelebrex (Celecoxib). The Link for approval:
http://www.accessdata.fda.gov/scripts/cder/drugsatfda/index.cfm?fuseaction=Search.Overview&DrugName=CELECOXIB
Celebrex had sales of 2.9 Billion USD before generic entry. It is the eight generic player to get approval for the molecule. Alembic has pretty less share of less than 1% for the molecule. Lets see how much market share is Torrent able to garner now.
5 Likes
Kotak came out with a reduce recco. downside 10%. Below is some info.
Post the windfall from Abilify and expected limited competition for Nexium, Torrent’s US sales will likely increase to ~US$385 mn in FY2016, near 10-fold increase from FY2012 US sales. However, competitive dynamics for Abilify are sharply deteriorating, with our checks suggesting over 90% price erosion post Apotex and Aurobindo’s launch earlier in the year. Nexium is widely expected to help offset the decline in Abilify, particularly given DRRD’s FDA issues, but our checks suggest that price erosion has now crossed 85%. With Sandoz and LPC still in the fray for approvals, we expect Nexium to be limited to a US$20-25 mn opportunity in FY2017, given our expectations of less than10% market share due to manufacturing hurdles associated with the product. With only 18 ANDAs pending approval in the US, the bulk of which are likely to be significantly competitive, we expect TRP to report muted growth until FY2018 as we expect Zyg portfolio and TRP’s own recent efforts to expand its pipeline to only contribute from FY2019/20 onwards.
We expect Torrent’s FY2016/17 growth to come under pressure, with cross currency headwinds (Brazilian Real) also adding to growth concerns. Torrent’s shares are currently trading at 25X and 22X FY2017/18 EPS respectively, at a modest 5% discount to front-line companies. This is despite the weak US pipeline, which will significantly curtail its FY2016-18 growth, as we expect benefits of Zyg acquisition and recent R&D investments only to play out from FY2019/20 onwards. We value TRP at 19X FY2018 EPS at a discount to front-line peers, and initiate with a REDUCE recommendation, 10% downside.
7 Likes
Dr. Reddys has relaunched Nexium as per the BSE announcement
while most of this is known, the quantification of this helps. I am in a hole for sure (having down averaged significantly) and I am wondering whether there is a silver bullet here. Obviously, they could use the extra cash in some productive way or other.
2 Likes
Top 10 Medicines of 2015
DECEMBER 31ST, 2015 HEALTH
The 10 best-selling brand-name drugs have generated more or less $ 100 billion for the giant pharmaceutical companies.
The gross sales from the following 10 drugs comprise 43% of the nearly $112.5 billion in total drug sales generated by the 100 best-selling drugs.
And the data just reflects half-a-year revenue of the companies, they generated in 2015. So one can safely assume the actual sale by the year end would double.
10. Lyrica (Pfizer) – $3.4 billion
This antiepileptic drug was first approved to treat patients with diabetic and postherpetic neuropathic pain. It has since been indicated as adjunctive therapy for adult epilepsy patients.
Lyrica is the sixth-most prescribed brand-name drug this year, with about 10.1 million prescriptions written.
9. Januvia (Merck) – $3.8 billion
In 2014, drug researchers analyzed insurance claims from more than 7000 patients with hospitalizations related to heart failure (HF) and determined that this diabetes drug increased the risk of HF hospitalizations by 84%. Last month, however, the largest study analyzing this relationship to date discredited this finding.
US providers have written 9.2 million prescriptions for Januvia this year, making it the eighth-most prescribed drug overall.
- Nexium (AstraZeneca) – $4.7 billion
This proton pump inhibitor is most often prescribed to treat acid reflux and heartburn.
In 2005, the FDA approved Nexium in injection form for patients who are unable to take pills.
It is also the third-most prescribed drug in the United States, with 13.2 million prescriptions written this year.
7. Advair Diskus (GlaxoSmithKline) – $4.8 billion
This breath-actuated inhaler delivers asthma medication automatically when the patient takes a slow, deep breath.
In 2004, the FDA granted Advair an additional indication to treat chronic obstructive pulmonary disease patients with chronic bronchitis.
It is the second-most prescribed drug in the United States, with 13.6 million prescriptions written so far this year.
- Sovaldi (Gilead Sciences) – $4.9 billion
This hepatitis C treatment secured a spot despite its lack of inclusion on any major formularies in 2015. It is also excluded from both Express Scripts’ and CVS Caremark’s just-released 2016 formularies.
Sovaldi’s appearance is also significant because the number of prescriptions written for it is much lower than the other drugs on this list—a likely consequence of the cost-benefit debate about hepatitis C drugs. Only 164,576 prescriptions have been written thus far in 2015.
5. Lantus Solostar (Sanofi-Aventis) – $5 billion
This pen containing long-acting insulin is touted as a means of supporting improved adherence and reduced insulin waste in patients with diabetes.
It is currently the fourth-most prescribed brand-name drug, with 11.2 million prescriptions written so far this year.
- Crestor (AstraZeneca) – $6.1 billion
This cholesterol drug was approved in 2007 as an adjunct to diet to slow the progression of atherosclerosis in patients with elevated cholesterol.
So far, Crestor is the top prescribed brand-name drug for this year, with 21 million prescriptions written.
In June 2015, the FDA recommended approval for Amgen’s potential Crestor rival, Repatha.
- Enbrel (Amgen) – $6.1 billion
According to the data, 1.7 million prescriptions have been written for this rheumatoid arthritis drug so far in 2015.
2. Abilify (Otsuka) – $7.2 billion
This antipsychotic drug demonstrated superior effectiveness over rival schizophrenia treatment Invega Sustenna in a head-to head study.
In the first half of 2015, 8.3 million total prescriptions were written for Abilify.
The FDA approved the first generic versions of Abilify to treat schizophrenia and bipolar disorder in April 2015.
- Humira (Abbott) – $8.6 billion
In September 2014, the FDA approved a new indication for this drug to treat pediatric patients aged 6 years and older with moderately to severely active Crohn’s disease who have not adequately responded to prior treatment.
Humira is also currently approved for the treatment of juvenile idiopathic psoriatic arthritis, ankylosing spondylitis, ulcerative colitis, and plaque psoriasis.
In the first half of 2015, 2.2 million total prescriptions were written for Humira.
2 Likes
Most critical thing for USA faced company is the FDA status. If all the 5 plants are FDA inspected and certified in 2015, can we assume that there won’t be any FDA surprises for an year or two??
Thanks
Disclosure: 15 % of my Portfolio
I think there is always a USFDA incpection before any drug gets an ANDA approval. So there may still be inspections for Torrent in 2016.
Dr reddys relaunches nexium with blue color
http://www.pharmafile.com/news/502176/dr-reddy-s-relaunches-generic-nexium-blue-after-astrazeneca-lawsuit
Any thoughts when in 2016 Crestor (Rosuvastatin Calcium) will go off patent in U.S.?
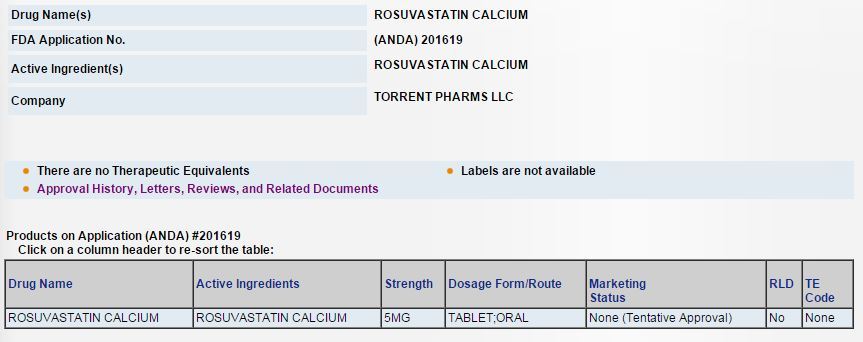
- Torrent has tentative approval.
- Market size (U.S.): ~$6.4Bn (pre-generic).
Source (market size): http://blog.dicksondata.com/2015/12/drugs-losing-patent-protection/
Torrent management’s view on this attractive opportunity -
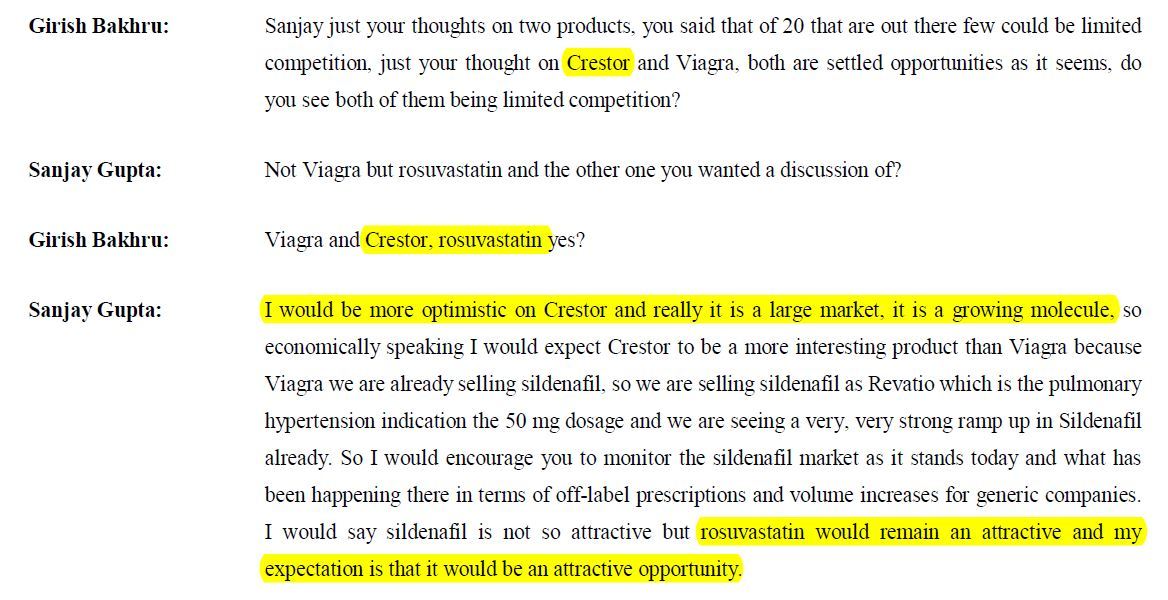
Source: http://www.torrentpharma.com/download/financials/gen_info/Transcript-Q2-FY-16.pdf
2 Likes
Patent expiry of rosuvastatin is July 2016. Actavis has settled to launch in May 2016 so they would have a sort of limited competition for a couple of months. A total of 9 players have tentative approvals. (details from a spark capital report)
Innovator is astrazeneca. Size of molecule is big so even with 9 players things could be interesting for torrent provided they get final approval to launch the drug as early as possible after patent expiry.
It would be interesting to find out during next concall how the base business in the US is doing for torrent pharma. I think in the immediate future abilify, detrol and nexium should be the molecules which should be key monitorables. Most of the juice is out of abilify but it would be interesting what kind of price erosion and market share torrent has in that molecule after the initial limited competition period.
9 Likes
Dear boarders and senior members, pardon me for my dumb question but I needed to clarify this. Is ANDA approval required for API’s or for finished dosages? For API’s, is the filing of drug master file (DMF) with US FDA sufficient for commercial use of that particular API. I am asking this because I wanted to know why do predominant API manufacturers file for ANDA?
Hitesh Sir and other members, can you comment on this. Thank you