Here is my daily performance chart for the last 3 months taken from q.zerodha.com. It shows the risk reward ratio quite nicely.

1 Like
its nice to see someone discussing technicals here. Hopefully the noone would raise an objection to this wonderful discussion. I had a few questions: 1. on what basis are you saying 7546 is a critical point as far as closing is concerned? Actually as per my understanding a move above 7610 is required for the upmove to gather steam. 2. i guess the swing high of friday is 7569 so move about that is what you meant right?
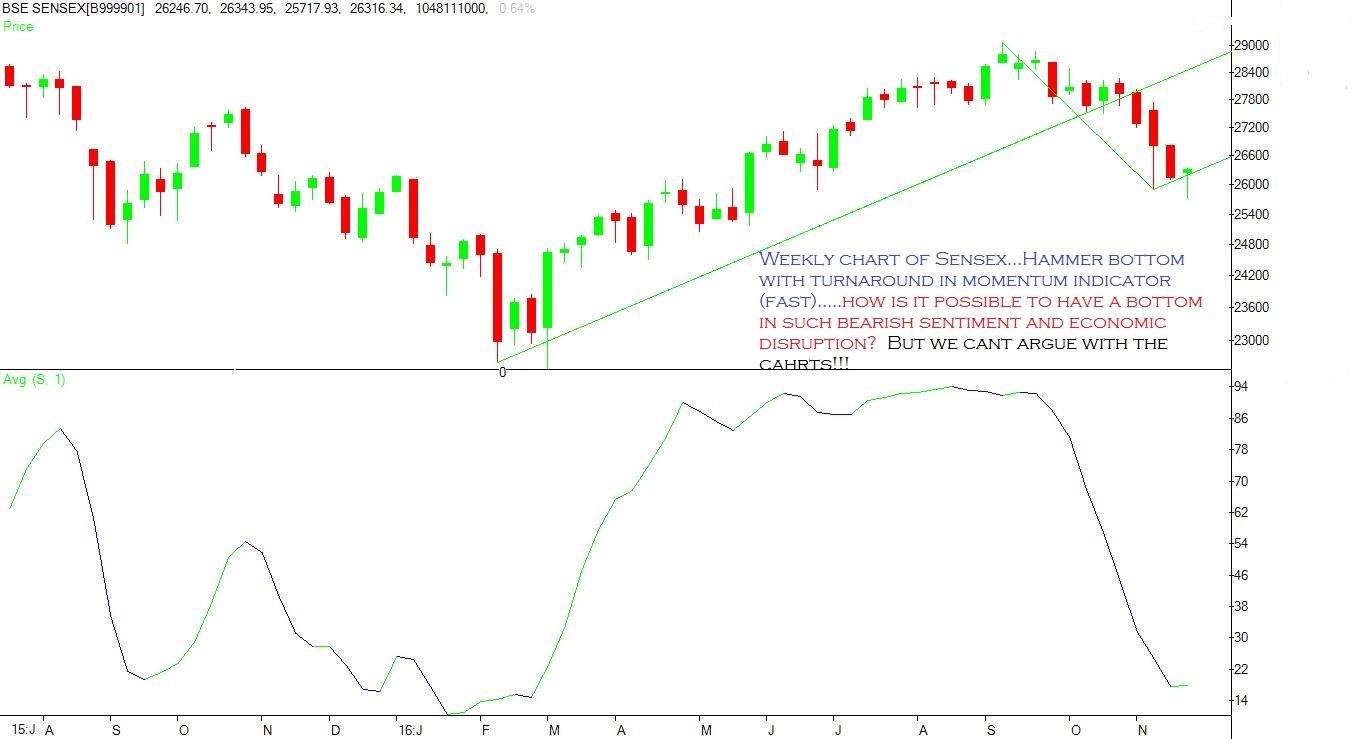
I hope what you are saying is right regarding bottom, though only thing to watch out is that its the thirteen month of correction and the lows are made around by this time and unfortunately long term MACD (quarterly )has given a sell signal on 31st march which is normally bad, so a pessimistic view is that one should be watchful this month. BUT, let’s discuss the good things now. The severe downtrend trendline from last week of oct was broken on its way up when a couple of weeks back we got a weekly closing above 7540. This should now give support on its downside at 7430 and that also happens to be near the 50 DMA and last time’s correction low. This makes 7400 very strong support along with make or break support. So clearly, right now i have no idea what could be the next move and therefore, interested in doing the analysis. till 7400 is not broken we are surely in an uptrend with bottom in place.
Also, sethufan, you were talking about your trading system. What kind of system is that? Can you share?
P.S: I am no expert in technical analysis and still in learning phase, so i could be horribly wrong with my analysis. Just trying to discuss with people to shore up my knowledge 
Recently someone said to me that “value investing has become a cult”.
Some of the comments posted above give this comment credibility.
@sharmaudi has found out that a disciplined trader can make decent money. And if he is profitable doing day trading, I cannot understand why anyone should try to detract him. There are many successful traders in the market. And there are failed investors too. Doesn’t mean it is not possible to profit from either methods.
What I would like is to get insights into how successful traders are doing it. Requesting @sharmaudi and other successful traders to keep posting and sharing.
P.S.
I mostly practice value investing (or at least attempt to), but I’ll like to keep an open mind.
After my post, Nifty has returned me 300 points. Do you think it is possible in day trading. Only thing one should know when to carry forward.
Just see your chart how the trading is skewed. But for 11-2-16, your return is not good. And, the number of loss making trades exceed profit making trades. This kind of trading style is beneficial to the broker and the GOVT and not for us. Because, it increases one’s strain on a daily basis.
Which one is better - the answer everybody knows. One trade good number of points is always better than multiple trades. This is what Jesse said long ago. HOLD and sit tight.
Swing trading allows you to capture big moves and I am not arguing with you on that front. Under the right market conditions it will always give you more profit than a day trading strategy. But I am not really after catching the highest move. Instead, I want to make sure that my losses don’t exceed 20-25 points per trade. In swing trading a bad overnight move will wipe of 3-5 times my planned loss. That is not acceptable to me.
As day trading allows me more leverage I can always increase my position size if I want to take more risk. I dont care about profits as much as I do about losses.
Not trying to compete with anyone here. Just wanted to share something that has given me good returns consistently.
4 Likes
I have a simple question… what happens when fundamentals stop working. In bull markets (tops) and in bear markets (bottoms), markets are just sentiment driven. In such a situation, what are investors to do?
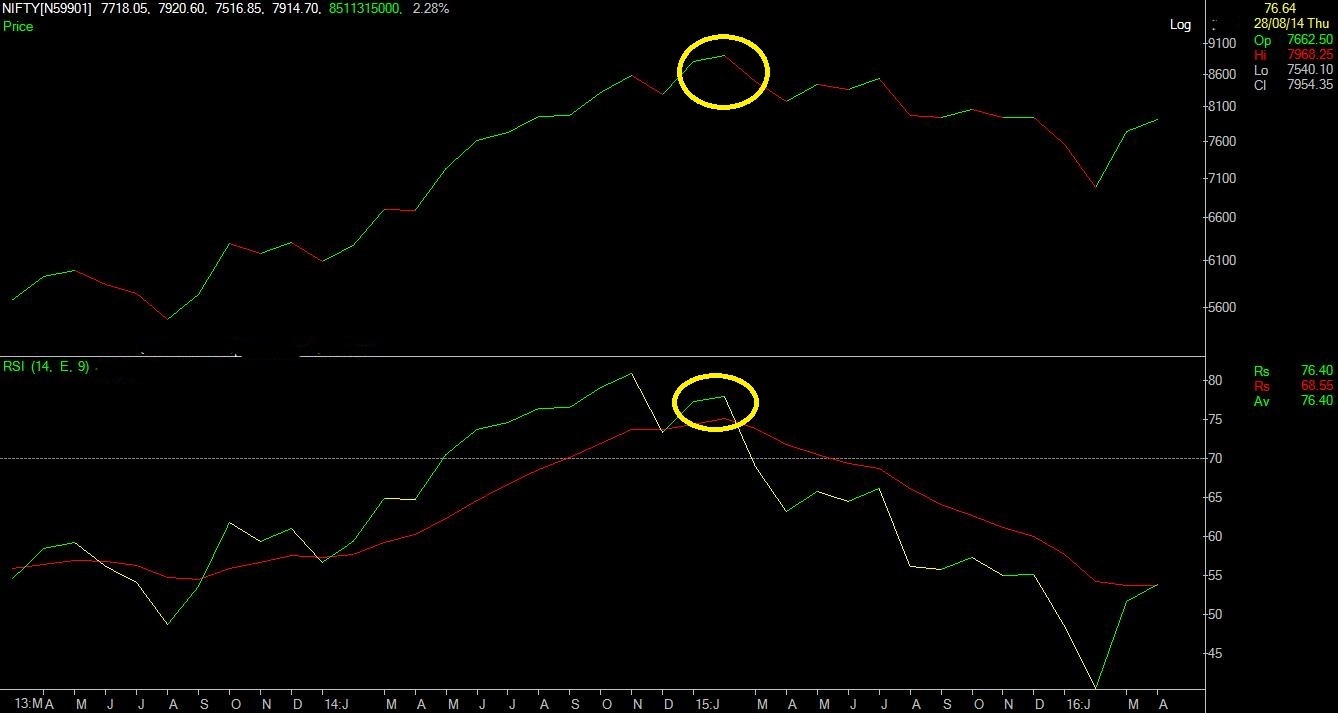
The December 2007 top and feb 2009 market bottom were very clearly identified by Technical analysis… there was RSI divergence on monthly charts. Similarly, the market top in Feb 2015 too was identifiable on monthly charts.
I you look at my posting on valuepickr under the thread …what you are buying in this market correction… i was screaming in feb 2016(with charts) that we are in just a bull market correction and it is not going to be a bear market. Thank God, i continued to stay invested in feb 2016.
In sept 2015 in my post on valuepickr forum on sugar cycles, i have pinpointed with charts the bottom of sugar cycle and bottom in sugar stocks such as Balrampur @40…
Again in march 2016, i have predicted a target of 26$ for WTI crude oil on valuepickr forum and my family members in US invested in double leveraged oil etf at that level and are now in good profits.
Using Technical analysis, it has been possible for me to pinpoint the cycle bottom of sugar, oil and nifty. I could also identify the tops.
I feel that technical analysis should primarily be used for identification of tops and bottoms. And the journey from bottom to top and vice versa is driven by fundamentals or by sentiment (who care about that)
Using technical analysis, if we are able to invest at the very bottom (somewhere near it) and somehow exit near the top… then its purpise is served.
3 Likes
Even those who do not believe in Technical analysis, would agree that at the bottom and the top of any market / stock… it is all techical.
When WTI crude was @28 dollars, the fundamental analysts of Goldman sachs were discussing a price level of sub 20 dollars. When sugar was at 10-11 cents, the fundamental analysists were predicting a continued sugar glut.
At the same time, at market bottoms (as in feb 2009 or sept 2013) along with market, a number of individual stocks too gave a bottom formation signal. Those who used fundamental analysis at these points to buy fundamentally good stocks at technically good prices had 10x / 15x returns. Those who bought fundamentally weak stocks at technically good prices had only limited gains.
Thus by buying at technically good (bottom) prices everybody made money. Those who bought using technicals and fundamentals made multibagger returns. Those who used just technicals (or fundamentals) had modest gains.
3 Likes
As they say a picture is worth more than a thousand words. I would have put up some charts where the formation of top / distribution is sooo apparent tjat it would convert even the staunchest critic of technical analysis.
But doing so would be against the spirit of this discussion which is academic in nature. Its like Benjamin Graham (father of value investing) who sort of believed that meeting the management somehow amounted to cheating.
1 Like
please feel free to substantiate your claim by charts. I am sure noone would object it. infact it would make your point more potent. Thanks.
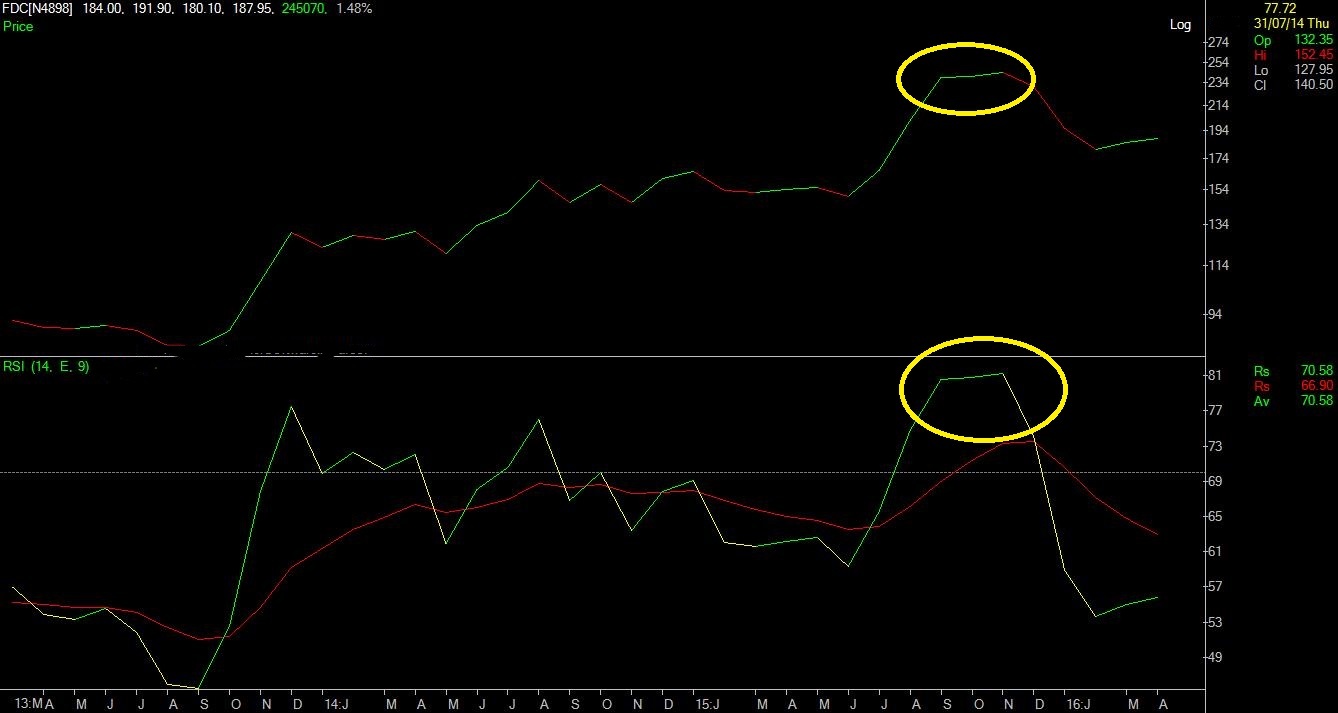
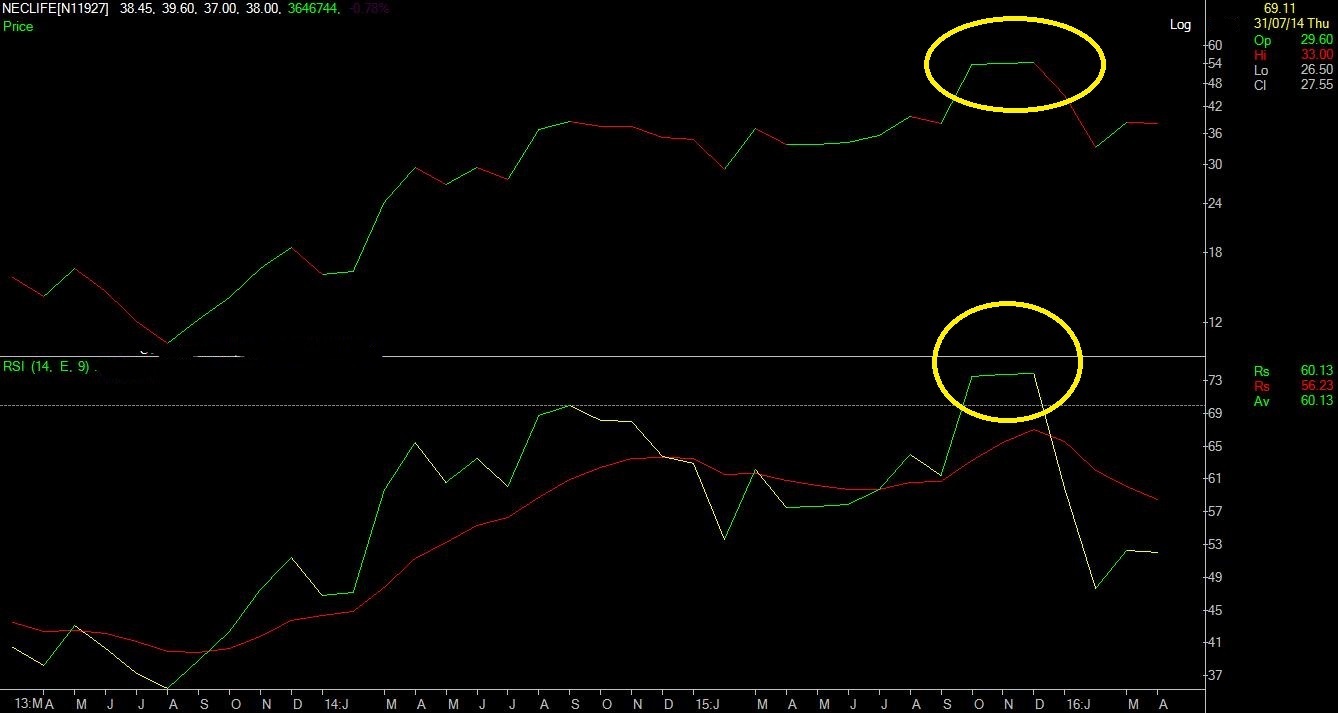
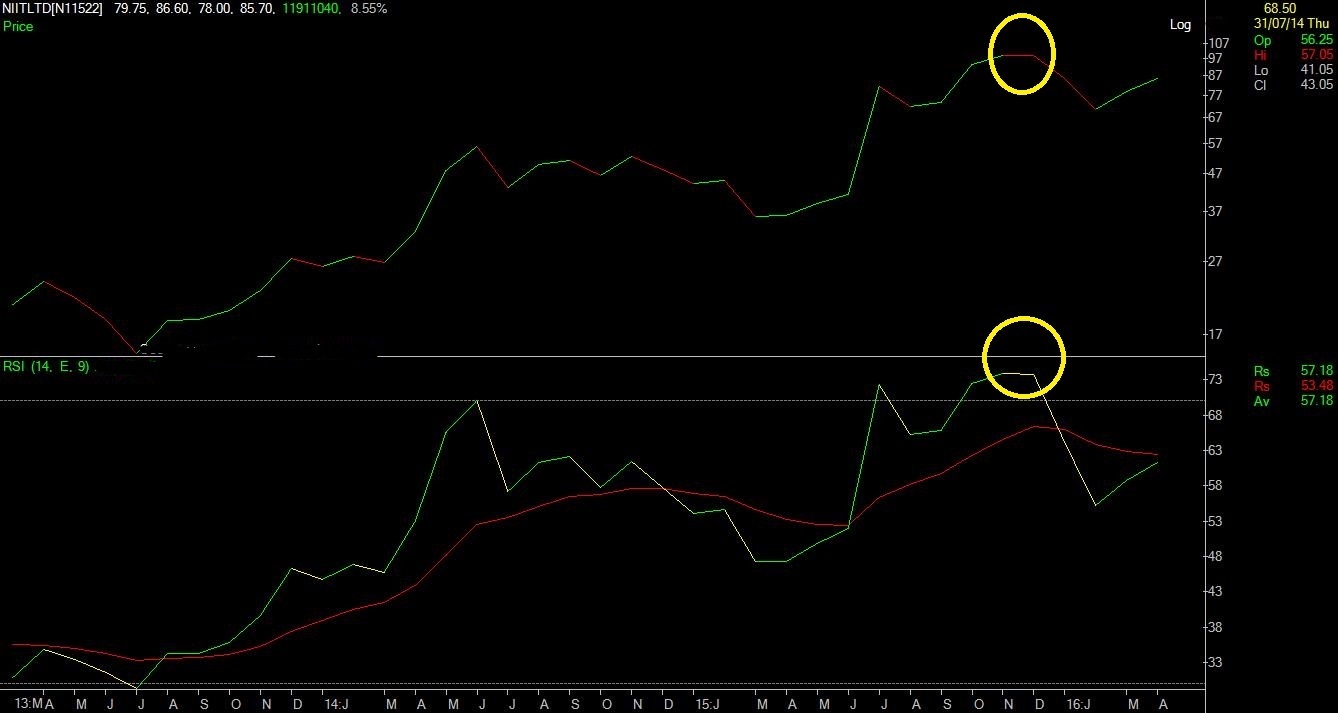
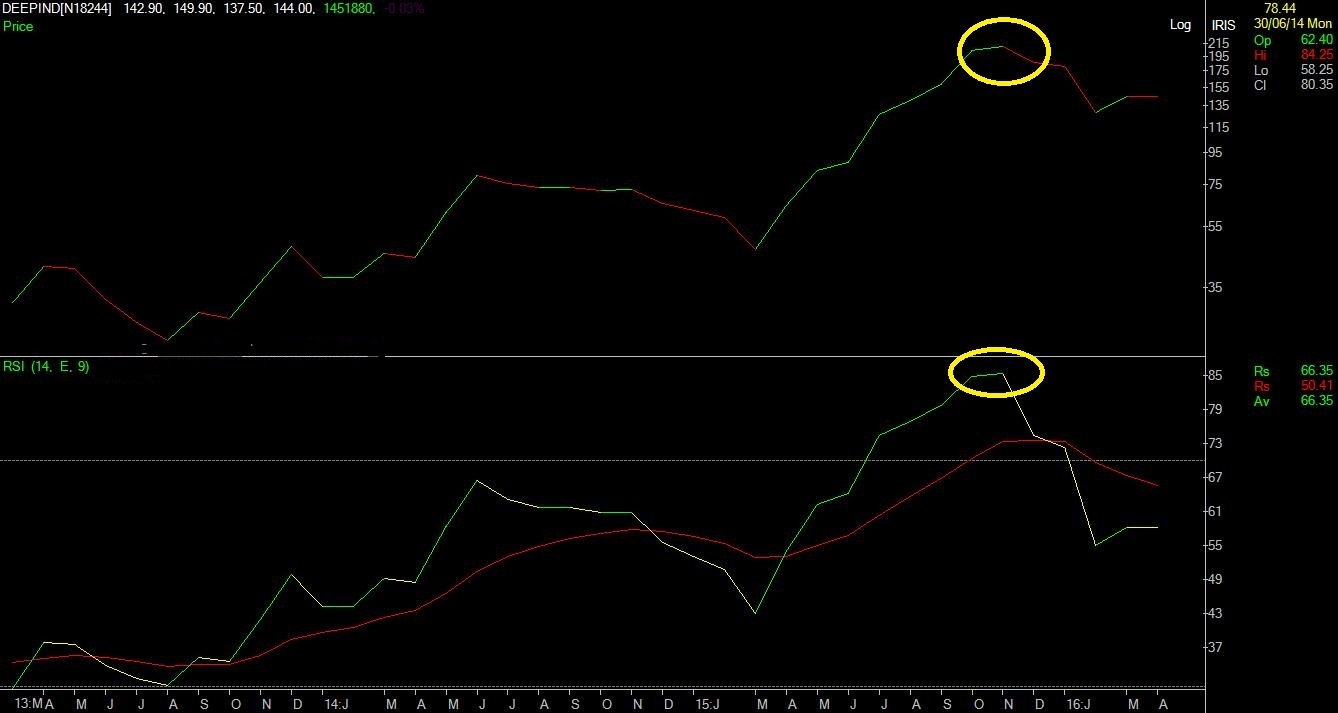
Although i could not find anything written about this in books on technical analysis… i have come across a very bearish signal.
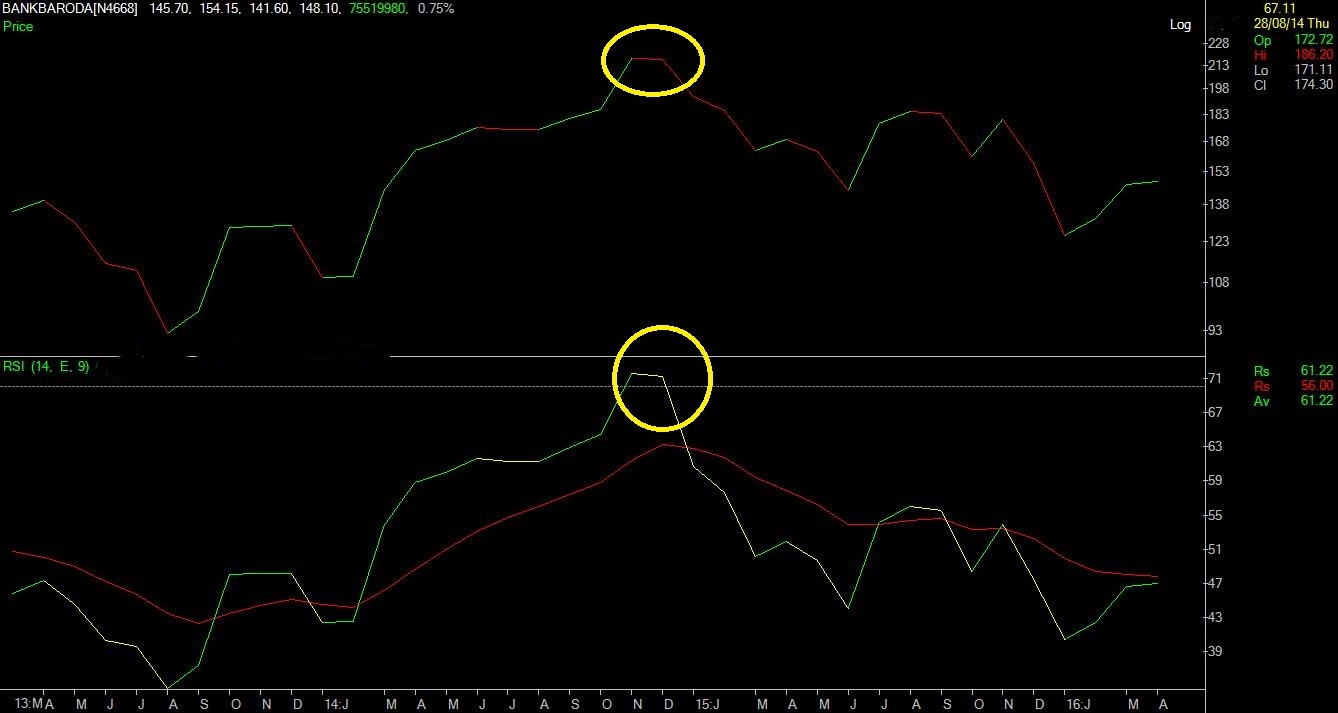
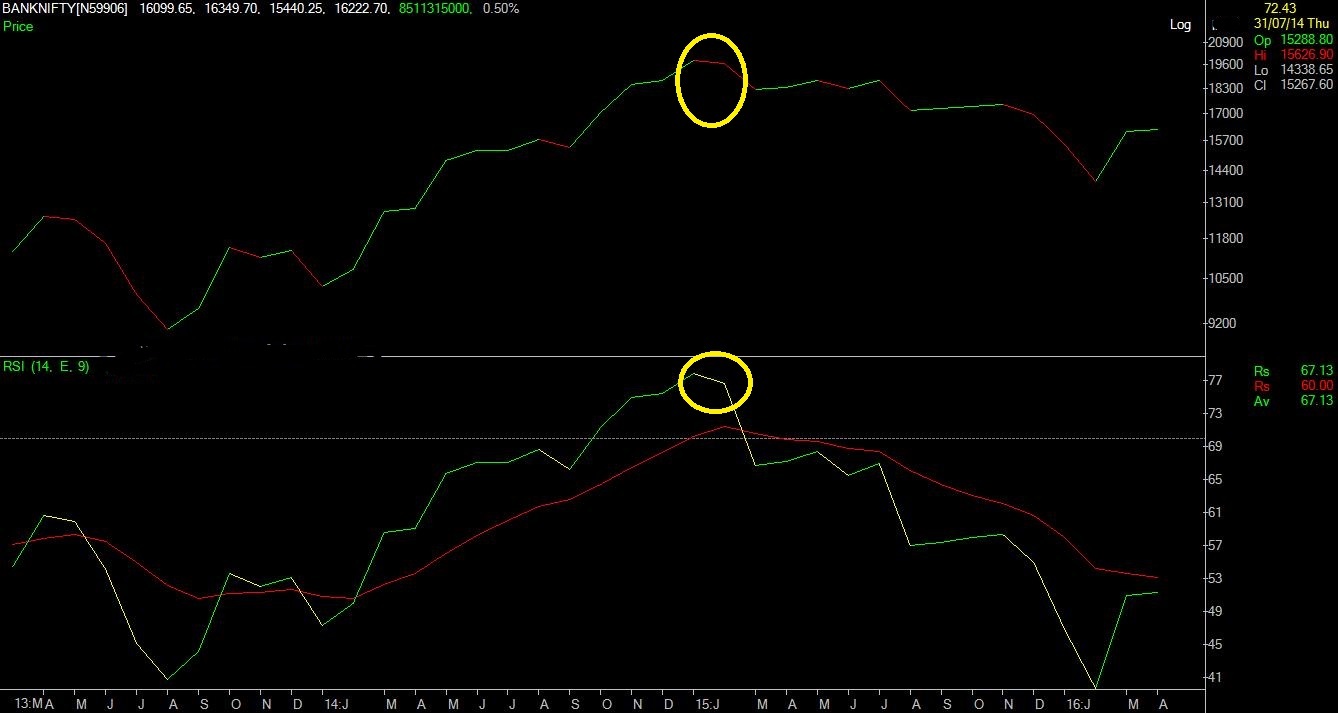
On monthly charts, when the RSI indicator is showing overbought levrls with reading above 70 AND the priceline becomes nearly flat… it indicates loss of buying support at the top or loss of upside momentum or massive distribution. When such a thing dors happen, we can safely assume that the stock is due for a fall for next few months.
2 Likes
I realize that to rely on a sigle technical signal would be a mistake and professional technical analysts take their cues from multiple signals… but still it does prove that technical analysis is NOT without any merits.
1 Like
Mehanz,
Kudos to your fantastic technical and fundamental analysis and the contribution towards this forum.
I am looking to start with technical analysis. It would be helpful if you could share some books name, blogs, etc. to learn the technical understanding of stocks.
Isn’t this some form of confirmation bias? There must be instances where the combination you have mentioned has played out but the price has not declined.
I am not against tech analysis. What people need to realize is that in TA one is actually measuring or tracking what is happening in a market as opposed to what is happening with the underlying business. Nothing wrong in that. Bit the time horizons and mindsets required are very diff from that of fundamental analysis.
I think that is where the trap lies. If one is aware of what tool to use when then both FA and TA can be used profitably.
Pl refer to the charts i have posted in the discussion thread on Nifty p/e @24…this very pattern is now playing out in S&P 500 and causing the US markets to go into correction mode…
For three months, S&P500 closed around the same level…this indicates absolute loss of positive momentum at the top…at the begining of Oct, the inly thing left for the US markrt was to look for an excuse to go down…and as i had written, the US market poses a threat to NIFTY rally…
I have been avid reader of this forum. It has made me go back to reading books, getting my basics right and it is converting me into an investor. That is the magic of this forum. Create more investors, Make then study on their own, identify the companies to invest in and enjoy the growth of the company with your own growth. Everyone can chip in and share their knowledge, management discussions, their own industry expertise, concall transcripts, pros and cons.
I do not see all that happening in technical analysis discussions on any of the forums. In technical analysis, an expert will say this is going to happen, Follow me and I will guide you. Everyday some script is going to show buy or sell signal so it is constant chit chat. In TA analysis, for each script there will be buy or sell signal in 2-3 months so TA is better for trading than investing. My suggestion will be to have separate section for TA where experts can guide the novice investors on how to do TA, which softwares to use, books to read and make them capable of doing it on their own. Then it will be similar to how this forum has made many confused common people into smart investors.
You are right. And interestingly a lot of the real stalwart investors like Howard Marks or institutions like Societe Generale among others have been saying that the US market is overvalued and is likely to have a double digit crash.
My only issue is that over valued market can stay over valued for quite some time…that’s what happens in a liquidity driven rally…the real arbiter of how long the market stays up…is the market itself.
We can only see whether, while going up…is the upside momentum weakening or it remains strong…If the upside momentum weakens and the market rise stalls…THEN AND ONLY THEN…we can expect the market to fall…
frankly speaking…how does an ordinary individual investor like us determine …when the market is over valued…and then over bought and then ripe for correction…except through some form of Technical analysis. At the market level, there are too many variables for us to even comprehend their impact…just not possible at all…so we let the collective wisdom of the market as a whole decide on that…and try to read markets decision through Tech analysis…
2 Likes
The stalwarts are saying that US market may have a double digit crash…but I am saying that lets wait till the RSI indicator on monthly charts falls to the vicinity of 40 level…and then we shall try to find out if there is bottom formation…Those who have followed such an approach in NIFTY FEB 2016 fall, have benefitted immensely…
3 Likes