
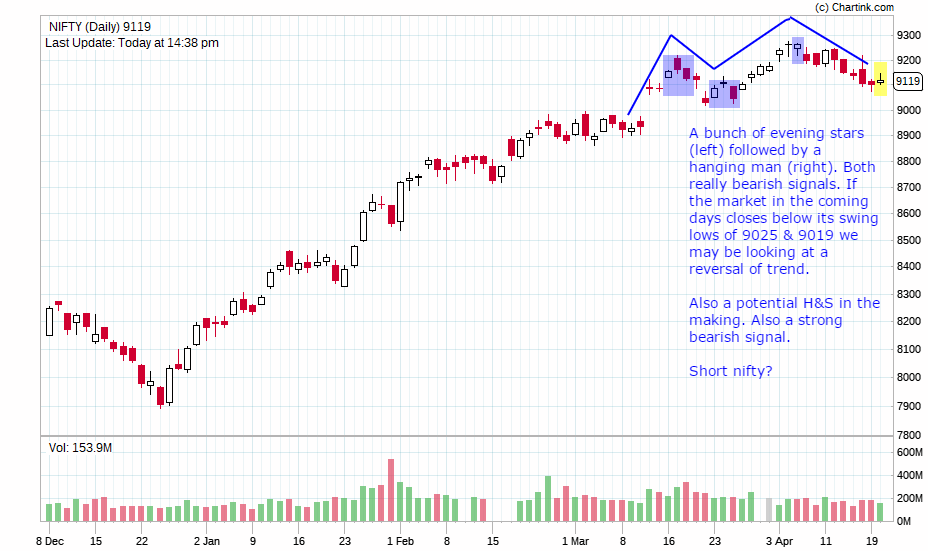
The Nifty candlestick daily chart shows a bunch of evening stars, a hanging man and a possible H&S, right at the top of an uptrend. All bearish pointers. A possible short opportunity provided it closes below its previous swing lows. On a related note - I think that the market has lost its mojo and seems likely to be heading for a drop. Views invited!
1 Like
I would be a bit cautious until the DIIs exhaust all the #mutualfundssahihai money  . This has been a liquidity led rally, so that is the main thing to watch out for. I believe the sideways movement will continue through April between 9070 and 9200. If banks, autos and metals post a good Q4, there is a good chance that there won’t be a correction beyond 9070. If the earnings seem weak, maybe shorting Nifty might make sense. Shorting in a sideways market is risky. Just my two cents.
3 Likes
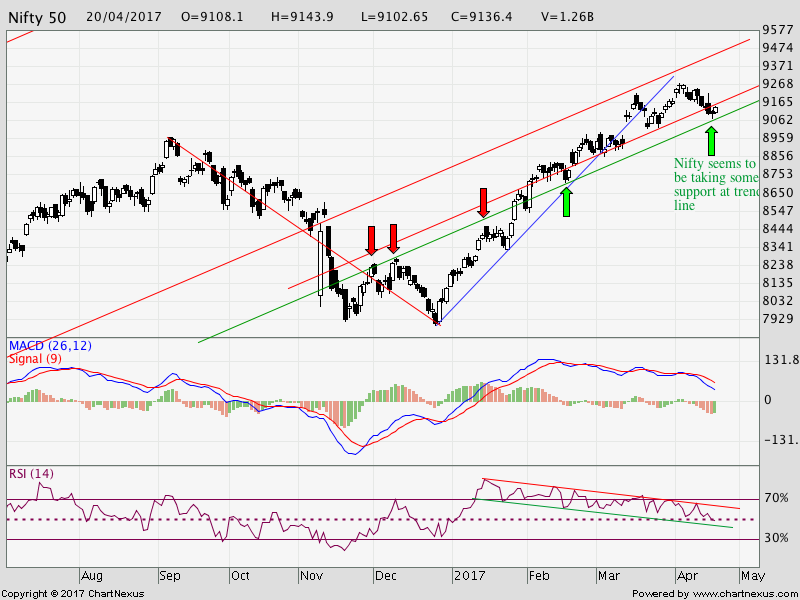
Though I don’t understand candlestick patterns much, I rely on trend lines , MACD and RSI combinations. So far Nifty seems to be taking support at trend line and I would agree with previous comment that in April downfall seems limited, atleast till April month F&O expiry. Though RSI trend is concerning for medium term (till reversal) .
PFB my analysis, looking forward to your comments as I am still novice and learning the art of TA (for investing not trading ![]() )
)
2 Likes
Well we are all learning! A head and shoulder if it gets formed should present an interesting setup. I would obviously wait for any breaks below the neckline. The head and shoulder that formed seems to have failed in allsec so waiting for breaks is very important. Alternatively a failed head and shoulder signals the return of bullishness. A raging bull should knock aside any puny obstacles that stand in its way. Allsec is a case in point. Darr ke aaghe jeet hain!
I would look for any bearish candles and patterns for confirmation like more hanging men, dark clouds or evening stars. But the main pattern is the H&S which has yet to unfold. So its still early to draw any factual conclusions.
However my gut feel tells me that the glass floor has cracked a little on the broad index. A few more bumps and it may well shatter completely.
1 Like
@bheeshma A very valid technical view @phreakv6 an equally valid fundamental view
Combining both messages, we have an answer that the rally is losing steam, and market is looking for triggers like Q4 earnings growth for the momentum to continue. Till then the movement can be sideways. However, in the worst case scenario, if the earnings are not as per expectations, then H&S has a high probability. Thanks @bheeshma for giving a heads up.
Dear Zoro and Bheeshma
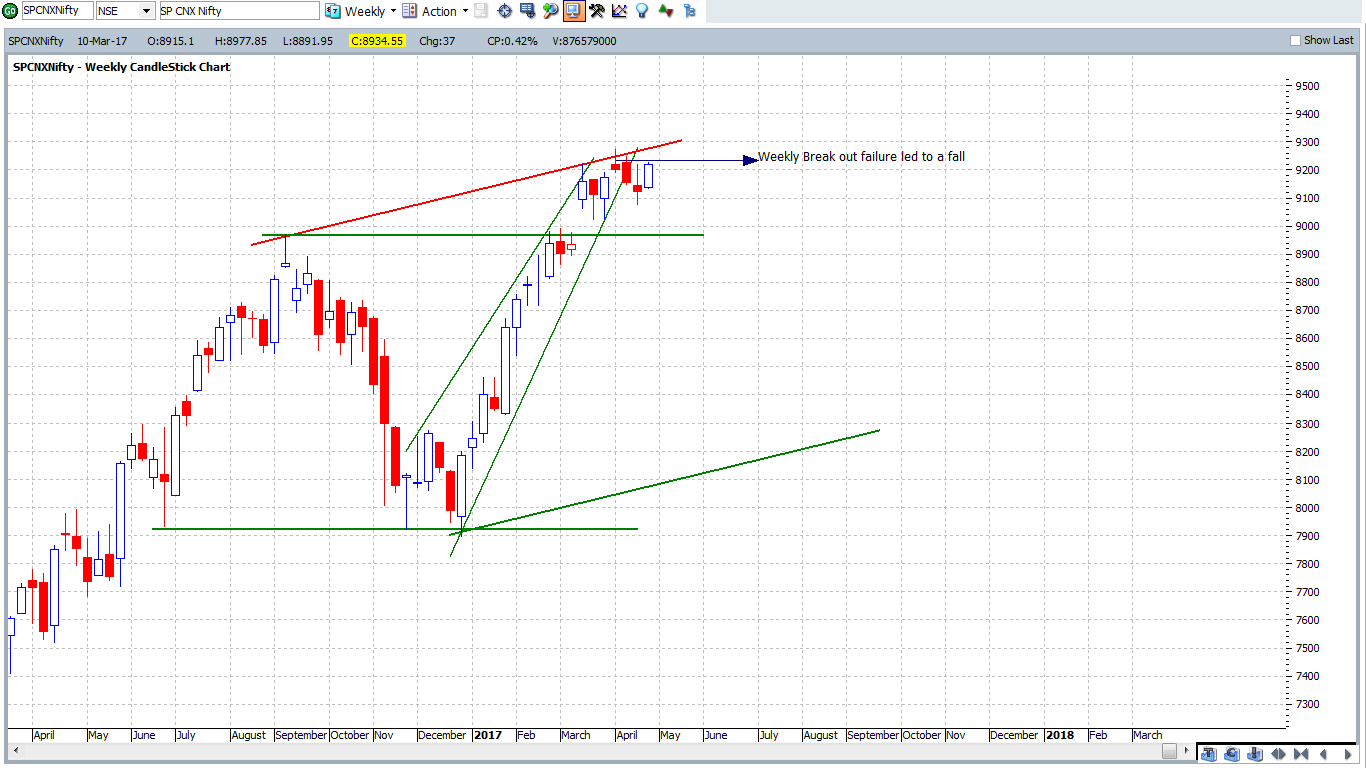
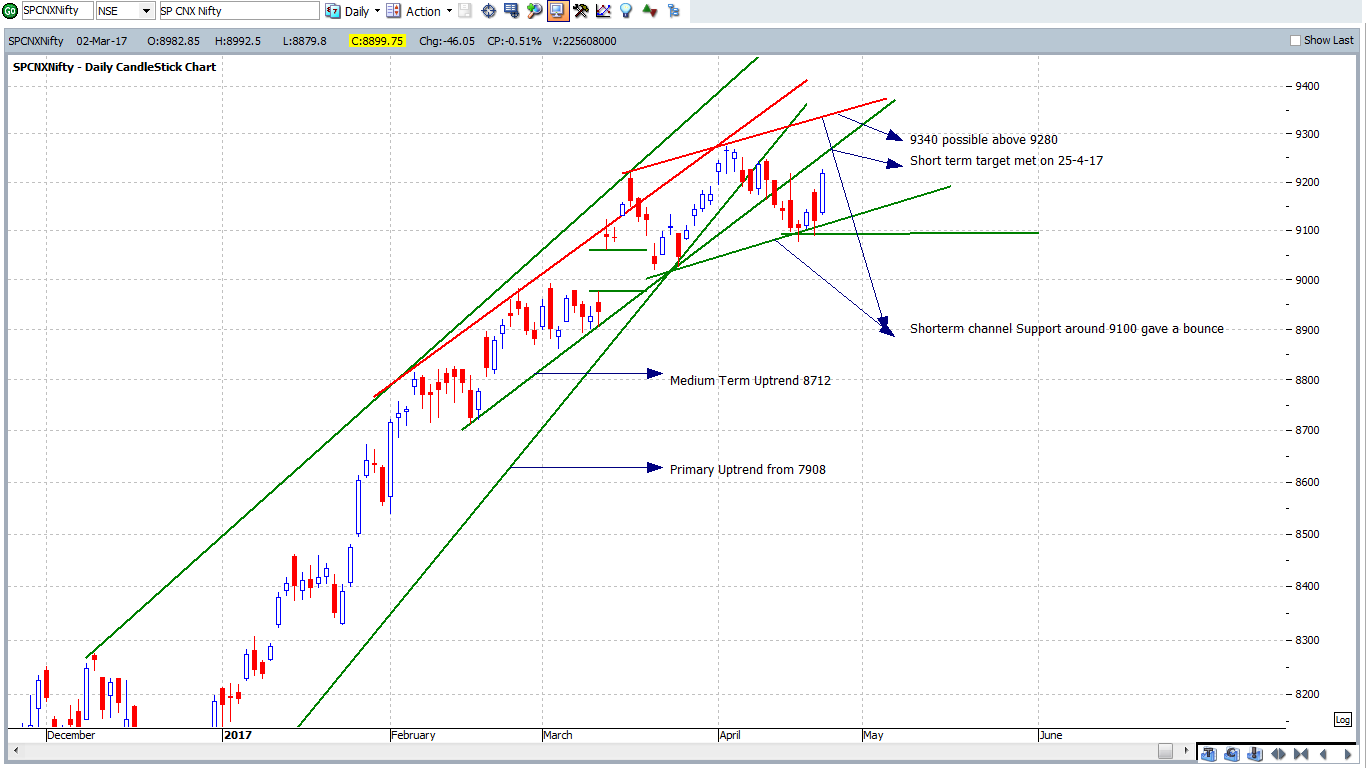
I have attached 2 charts on Nifty - daily and weekly. I have given the comments also in the chart itself. I love charting and I focus only on price. I dont use any single indicaor. I trade heavily on Index and stocks ( apart from a Long Term Investor). I love Technical Analysis and if handled properly it can give you very good returns. But it takes a Long time to develop that expertise. Simple - Always Trade with the Primary Trend ( LT, MT and ST).
1 Like
Nifty has hit its lifetime high in style with a gap up. The evening stars, hanging men and H&S seem to have surrendered for the time being without any protest. Raging bull on the loose.
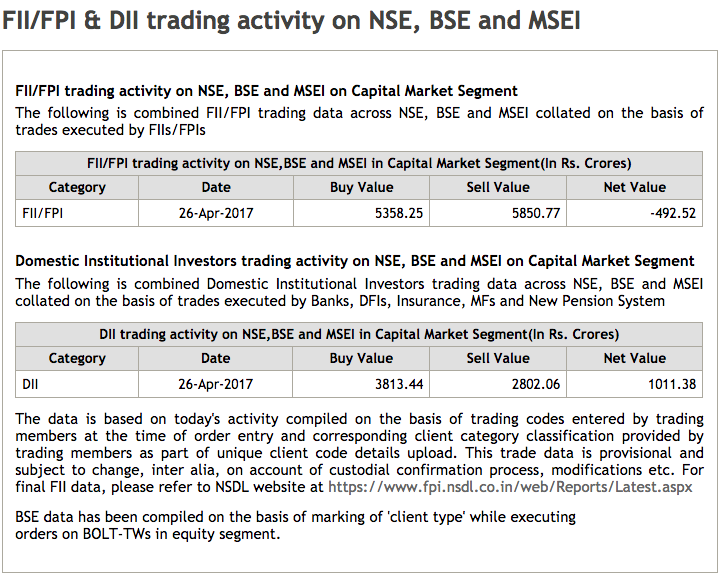
DII liquidity is strong. No longer are we at the complete mercy of FIIs as can be seen how DII buying kept the market afloat through continuous FII selling. I am pretty certain today’s rally again was driven by DIIs. Data yet to be out so have to wait.
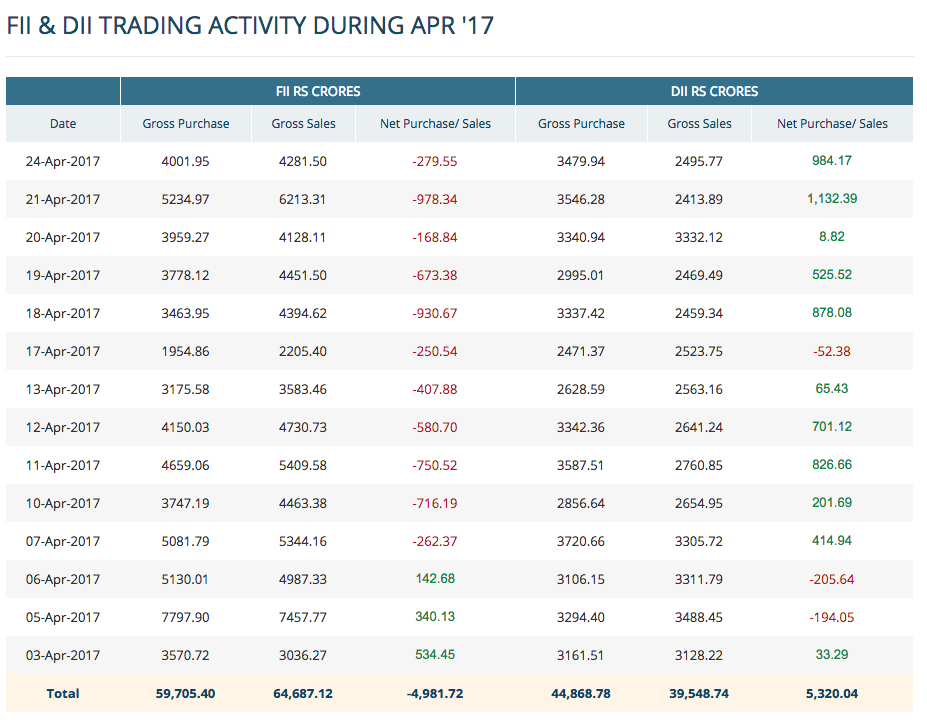
UPDATE: Third consecutive day the DIIs have flexed their muscle with around Rs.1000 Cr net purchases. This is what I was alluding to in my previous post five days back. ![]()
Update:

1 Like
I read with interest the various posts alluding to bearish candle patterns, trendlines, failed breakouts, liquidity etc.
One of the basic rules of TA is that the TREND IS SUPREME. What emerges out of this basic rule is that bearish signals tend to fail when the trend is up (and bullish signals work much less in bearish times). The stronger the trend, the more the likelihood of signal failure. This is what is happening currently to all the bearish signals on the charts since the Dec 26 low and the rise thereafter. The rise is so strong that it is pushing aside everything else. Bheeshma you have rightly admitted that the bearish patterns (btw, the evening star identifications are incorrect) have been brushed aside!
But the strength of the trend itself would have been sufficient to tell us that those and any other signals are more likely to fail. Until the trend changes.
One must eschew the tendency to look for reversals when in a strong trend. For one, it creates a mind set that prevents one from participating aggressively in the direction of the trend. When trends get stretched, they become quite dynamic and it is not worth missing out on that portion at all out of fear that reversals may occur! It is a lot easier to flow with the trend. Eventually, one of the last trades will end in a loss. But fearing a reversal, if we miss out on five other trades, our loss of gains is even larger! Many people have been shorting from 9K levels in anticipation of a fall but market shows no interest. Eventually it will fall, no doubt. But if we move many hundred points before that happens, have we not dis-serviced ourselves with our own analysis?
No criticism meant towards anyone but just trying to put things into perspective on TA usage here.
14 Likes
Thank you @ckn for your inputs! As always you bring out the finer points in TA with clarity that can come only with your experience. I am all ears to hear your views and guidance.
About the evening star could you share with us the nuances?
Best
Bheeshma
1 Like
More than the ‘appearance’ of a pattern, it is the underlying conditions in which they occur that needs to be looked at.
Evening stars are topping patterns where the bearishness steps in surreptitiously in candle 2 and then slams it to the bulls in candle 3. For this, candle 1 has to be a strongly bullish one and ideally, it has to be a series of bullish candles, preferably long bodied ones, that create an unalloyed bullish environment. Then candle 2 is a continuation seemingly, but loses steam swiftly, as evidenced by the gap (bet C1 and C2) and the small body. Candle 3 then is a long body bearish affair that turns the tables on the bulls who are long at high prices.
In your two examples highlighted, the first was devoid of a strong bullish candle and the second was devoid of a gap and was itself larger body than the preceding one. The second example was a more apt one, meeting some requirements except that it was off the highs. Patterns must appear where they are supposed to appear. Else their efficacy and indeed, validity, is questionable.
Cheers.
8 Likes
FII selling has been abrupt and against the trend in the last few days and DII buying has always resurrected the trend just as quickly.
Soon as I saw this, I knew what the final net DII and FII numbers would look like for the day. And that’s precisely how they looked (same story last several days towards expiry).
Mutual Fund SIPs have reached 4000 Crore per month since December. All you need to do is check if DIIs have deployed said amount. If not, you know they have a build up and have no idea where to put it.
1 Like
@ckn excellent post sir. Enjoyed reading. In fact I read it twice just so that I did not miss out important details.
I have one request. You should post more often. Also sir, you need not be apologetic about criticizing. I am here to learn and I am miles away from where I need to be and we need guidance from experienced practitioners like yourself.
Thank you for your inputs once again
Sincerely
Bheeshma
3 Likes
The Measured Move
The measured move is an old concept in investor psychology that keeps cropping up time & again esp on broad market averages. Like all concepts in investing esp those pertaining to technical analysis it has its share of people who dismiss it - chief amongst them obviously purists fundamental analysts who consider technical analysis of little value. To be sure they are likely to be right - as this field is filled with very few genuinely good practitioners who can profit from trends in investor psychology and they don’t write or talk much. However the measured move is one area that can be used for risk management for a fundamental investor.
The measured move is a reasonably large price swing that has been interrupted roughly at the midway mark by a fairly sharp correction ( could be a rally or a reaction) or sideways movement. This “interruption” cuts the move into two halves of roughly equal length.
An example from NIFTY would make this clearer
Nifty hit a low of 2252.72 in Oct 2008 & hit a high of 6338.50 in Nov 2010 then,
it corrected by ~29% to hit a low of 4531.15 in Dec 2011.
According to the measured move theory the subsequent move ( after the low of Dec 2011 ) should be measured at 6338.50 - 2252.72 = 4085.75 points
In March 2015 - the nifty hit a high of 9119.20 a move of 4588.05 points (9119.20 - 4531.15) before it corrected by 25% to hit a low of 6825.80 in Feb 2016.
From this low of 6825 it rose to hit a high of 8968.75 in Sep 2016 and promptly corrected to hit a low of 7893.80 in Dec 2016. According to the measured move theory the next move should be 2142.95 points from this intermediate low of 7893.80 of Dec’2016.
The NIFTY has since then completed almost 85% of this projected move and is in close vicinity of the levels at which it is supposed to correct in a meaningful manner according to the measured move point of view.
Whether this theory holds any water only time will tell of course. But hey if it does, it would be an interesting tool to have to control for portfolio risk management
Best
Bheeshma
Views/Criticisms invited
4 Likes
ckn sir,
As bheeshma mentioned, experienced technical experts like you should post more often especially when you find something pertinent to point out.
Two of your above posts have been eye openers. I have read books on TA but when someone like you points out the intricacies to look out for it always adds to our knowledge.
regards
hitesh.
5 Likes
Can anyone please guide regarding the technical analysis:
How do u get the technical analysis charts
Is there any app or software
Thanks
They are freely available on many websites like chartink and economic times
A cup n handle on the NIFTY. The length of the handle is short indicating strength. One can project the length of the possible move using standard cup n handle rules.

@ckn sir, if possible could you share your views on anything interesting you may have found…
Best
Bheeshma

A heart stopping fall on the nifty. However, at precisely the 61.8% fib level, the nifty has started rebounding and gaining strength again.

@ckn sir, if you could share your views on the broad market it would indeed be a treat ![]()
2 Likes