What Data Source you are using to power screener.in ?
Is there any free or cheap data source available to get all three financial statements ?
What Data Source you are using to power screener.in ?
Is there any free or cheap data source available to get all three financial statements ?
Dr. Vijay Malik wrote a excellent article about How to Use Screener.in “Export to Excel” Tool.
Thanks in advance 
You can certainly create custom filters which are very complex. Thats the main differentiator in screener
There is an export to excel function. Here you can upload your customized sheet and download for any company you want
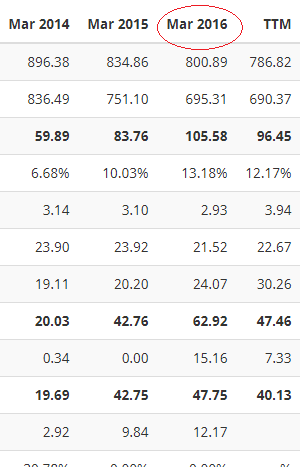
Guys, any idea when will Annual results be updated for all stocks? Many stocks still have March 2016 as latest.
[Screenshot as on July 4, 2017 for Aym Syntex]
I was wondering the same question.
Further, for some stocks, example Pricol Ltd, the past year data are not available. Hope they will update it soon.
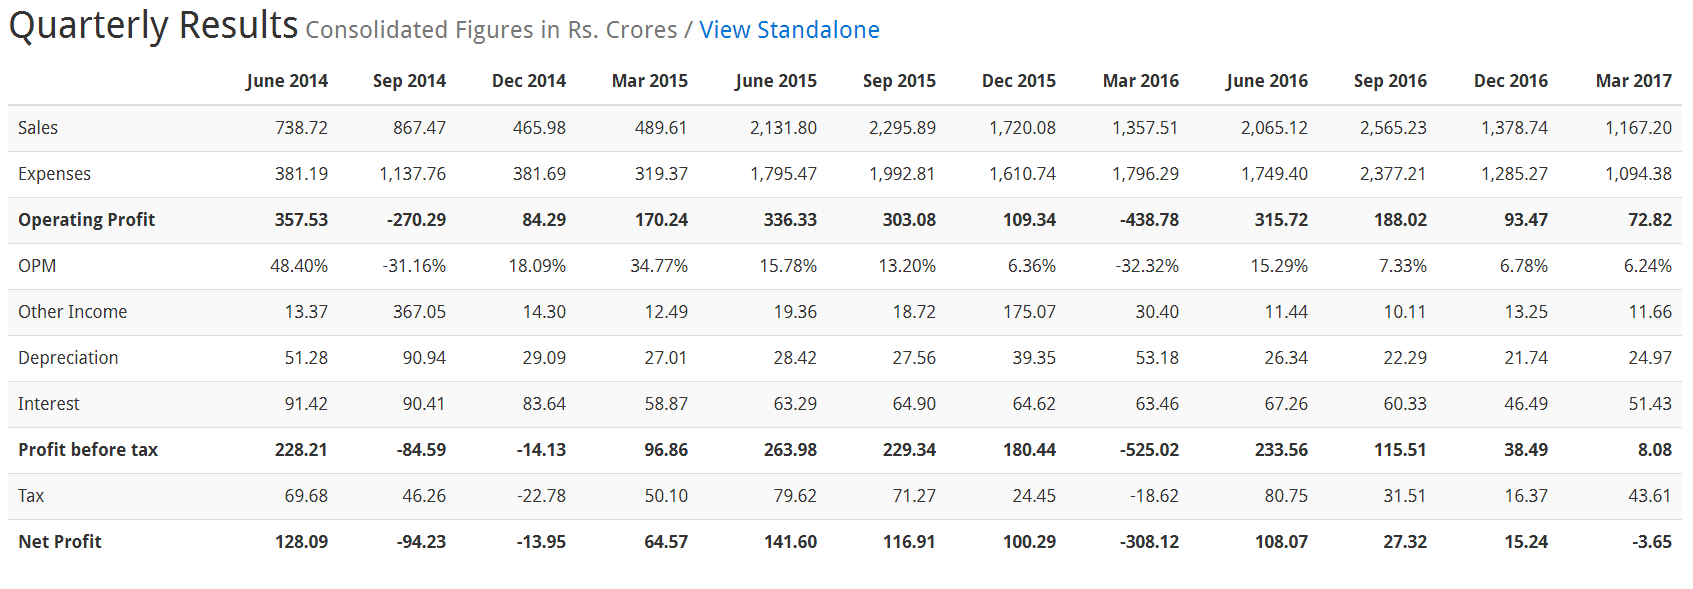
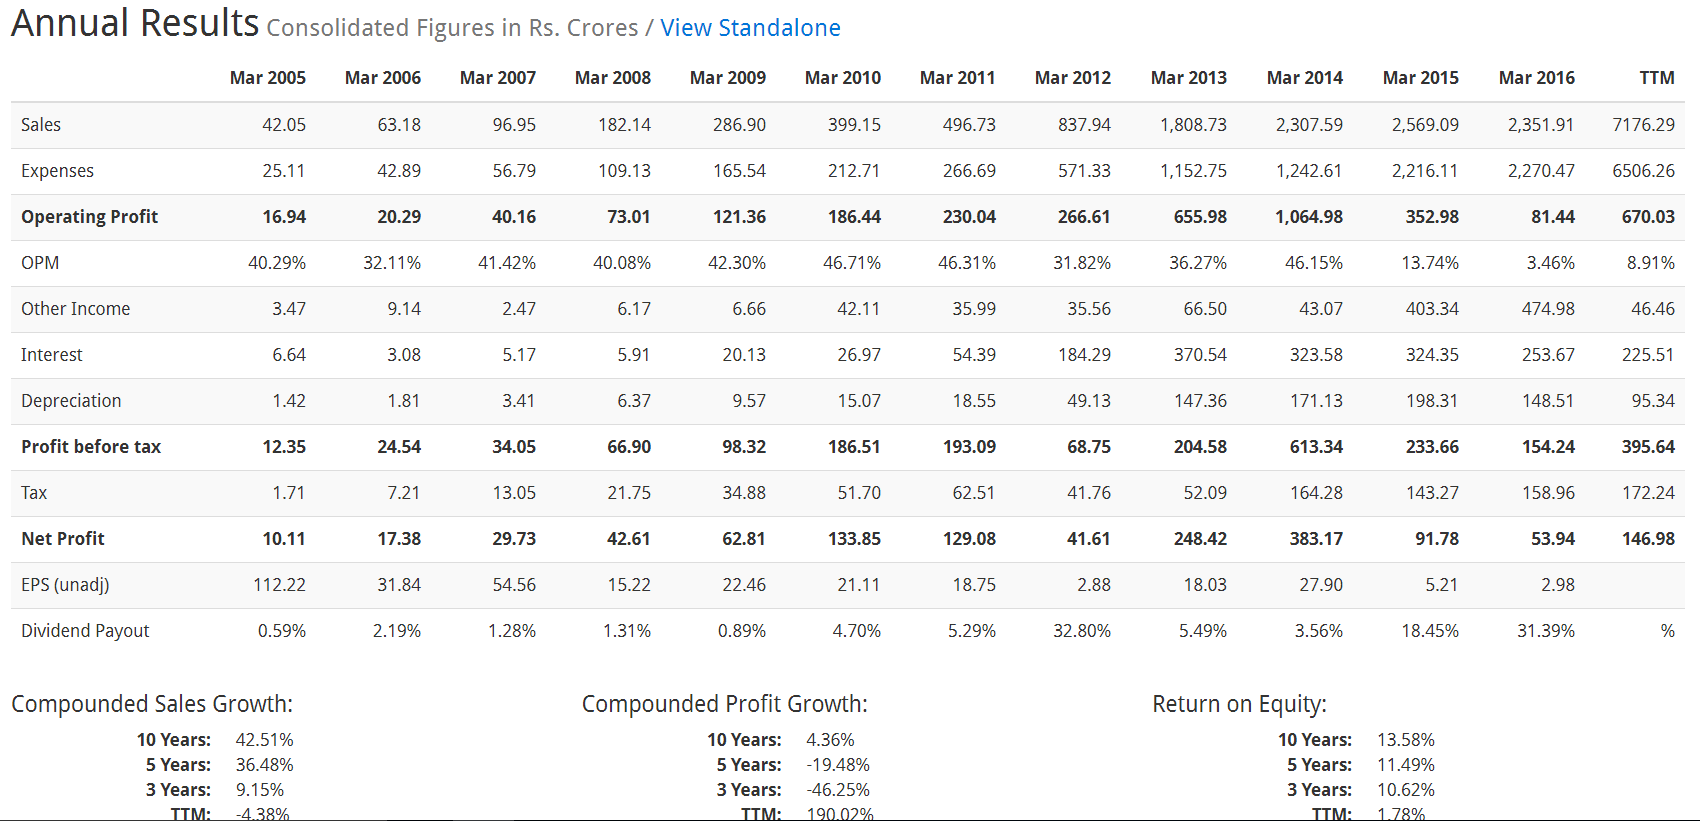
P&L figures are updated for FY17 but are just being shown as TTM figures. After declaration of Mar17 quarter results TTM represents FY17 only. Though balance sheet figures have still not been updated. I guess the reason for the same is that since annual report has not been released and screener’s data source must be picking it up from annual report thus those figures are not updated. I analyse P&L figures using screener and manually download earning pdf from exchange website for balance sheet figures.
There is some error on the Cox and Kings page. Cox & Kings Ltd financial results and price chart - Screener
The annual results show the revenue for FY 16 as INR 2351.91 Crores whereas if you total the quarterly revenue for all the four quarters of FY16 in the section above you get a total of Rs 7505 crores. Please check what is the problem and rectify if the same if occuring in other companies as well.
Hi there, I am new to investing fraternity and want to know the way to find companies which can fund its growth from its own cash. Can i be able to do this on screener on a broder sense or is this a company to company basis. Welcoming your thoughts and your ways to doing this.
Dear all,
I have been using screener.in and find it is an excellent tool to screen and analyse companies. However, I intend to incorporate both technical and fundamental screens I.e. dividend yield, price to earnings, beta and 52 week price change. screener.in has dividend yield and pe currently. Kindly help me whether I can incorporate beta and 52 week price change also either in screener.in or any other indian stock market screener. Both Google finance and Yahoo finance have all the 4 criteria but do not cover Indian indexes like BSE500 and NSE500.
any help in this regard would be greatly appreciated, thanks
Can the piotroski score calculation be also displayed? For Nilkamal screener is showing Piotroski score as 3 and if you calculate the same in this tool https://freefincal.com/piotroski-score-stock-analysis/ the same is turning out to be 7. A calculation screen from screener would help to identify whether the calculation is correct or where is it going wrong.
Thank you for this excellent tool.
Today my email notification told
Yes Bank result added
Satin Creditcare result added
Ujjivan Fin.Ser. result added
Can result added be differentiated as “annual results added” and “quarterly results added”? That will help those who look forward to specific information
Is it possible to get “customer advances” as a result for the screens?
@pratyushmittal sir, in one the VP Chintan Baithak 2017 updates read about your presentation on screener scripts and filters. Could you please start a thread for your PPT as well. Would be looking forward to that.
Dear Pratyush/ Donald…The exported XL does not show FY Cash Flow and Balance sheet nos, though the audited results are out and it is shown in the screener web page. For example - take the case of intrasoft technologies. The FY17 nos for P&L, BS and Cash flow are available in the web page. But in the XL export, the FY17 P&L is shown in TTM, but the Cash flow and BS still shows only till FY16. Is there any issue in this or i am doing something wrong in the XL export. I will be happy even if anyone else clarifies…Thanks…
I was using the default Magic formula screen which has the following query.
Return on invested capital > 25 and
Earnings yield > 15 and
Book value > 0 AND
Market Capitalization > 15
and I got “6 Results Found: Showing Page 1 of 1”
I had a saved query which has Graham number added to it which says
Return on invested capital > 25 and
Earnings yield > 15 and
Book value > 0 AND
Market Capitalization > 15 AND
PB X PE < 100
and if I execute it I would get "58 Results Found: Showing Page 1 of 2"
I expect this set should be a sub-set of first query, thus less than or equal to results in query 1.
Now if I add same “PB X PE < 100” to the query section when I go through magic formula screen, then I do get a different results which is conforming to first set of query.
What I am dong wrong or anything amiss at the site for my previously saved/newly executing query? Why should it give different results for same query
You might re-run it again as looks fine when I ran both your queries
The problem persists for me.
I run exact same query in two window and i get two results (only the path to reach the querying page changes). The only difference I see is “latest=true” in URL and what way it influences the results, I am unable to understand.
Query
Return on invested capital > 25 and
Earnings yield > 15 and
Book value > 0 AND
Market Capitalization > 15
Results - 56 companies
results 5 companies
In the second url you have > &latest=true which is causing the difference. I am not sure what it means though.