
which number did you call on? IR team? Where did you find the number from?
The IR contract is no longer valid, although they have not updated this on website.
Call on their corporate office number - Tel : +91-22-2283 4116 / 4032 2786 (http://www.sarlafibers.com/sarla-performance-fibers-limited-india.html?reloaded=true), they will transfer your call to Mr. Naik for any shareholder information/query.
2 Likes
@borapratik03 When is the concall?
Please find some questions from my side
- Why there is a drop in sales in this quarter when mgmt has said there will be 4% increase YoY in sales from Indian plant and production from US plant will also increase
- Segmentwise and areawise figures required(US and India)
- What is the max capacity of Nylon 66 the company is eyeing
Hi -
Any one with updates post the conference call? Why was the top line growth slower but better bottom line performance. Also what are the current utilization of the various plants?
Navneet
Disclosure: Invested at about 4% of the portfolio
Hi All, wrote to management for following set of queries. Management reply is as mentioned below -
-
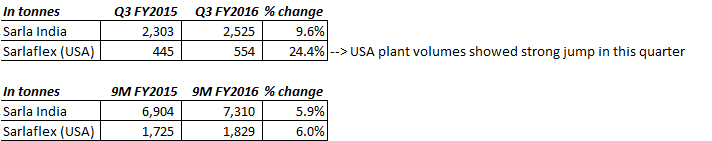
What were the volumes from India ops. and USA ops. (Sarlaflex) for –
a. Q3 FY2016 and Q3 FY2015
b. 9 month period ending December 2015 and December 2014?
Reply
-
Why is tax outgo so low for this quarter? Is it because of higher provisioning made in earlier quarters? What can be reasonable tax rate in upcoming quarters?
Reply: We have committed an Investment in the Wind Turbine of Rs 39 crs. till the March end. On this will get the Depreciation @40% , due to this our Provision for tax is minimal in this quarter. -
Is sharp fall in crude price transpiring to fall in prices of our end product - polyester and nylon yarn? Is this the reason for drop in sales? (Dec 2015 sales = Rs. 73.8 crs. while Sept. 2015 sales = Rs. 81.6 crs.)
Reply: No. Fall in crude prices doesn’t affect our selling price much. This fall in sales on account of trading sales which are reflected in results also. In Results you can see that in Dec 2015 Purchase of stock in trade is Rs. 33.35 lacs. while in Sept 2015 it is Rs. 1025.69 lacs
6 Likes
Sorry to detract from the topic, how do you contact the management to get a response?
I simply mail the compliance officer ID but have never received a response despite providing all depository details, shareholding, etc. I also do not ask for information that may be sensitive in nature. Do let me now if you have a different strategy.
I called on their corporate office number to understand if mgmt. is planning for concall. They were no definitive timelines although they first mentioned it to be scheduled within a week. Later, I wrote an email to company for query replies, if possible. I got the email id from textile conference concluded few months back in Mumbai.
Thanks for the update. This is useful. Can you please elaborate on the last point you mentioned. I am not sure I understand how does that translate to lower sales. Also why investment in wind turbines? Is it more to do with tax or is it more of a bet to get sustained energy (and clean energy) supply. Any information?
Thanks,
Navneet
My quick take on point 2 -
Typically, Rs. 39 crore investment in wind turbine = 1.25 MW power generation. 1MW = 8.76 million units. With power load factor (PLF) of 20%, it will generate 2.2 million units (=20% multiply 1.25 multiply 8.76) at cost of Rs. 30 paise per unit.
In absence of this turbine, cost per unit = Rs. 2.5 per unit. So cost saved per unit = Rs. 2.2/-
Assuming, all the power generate is used then P&L impact = +Rs. 48 lakh. (=Rs. 2.2* 2.2 million units generated). Other benefit is on tax outgo due to higher depreciation charge on wind turbine.
Explanation for point 3 -
Company did trading of Rs. 10 cr. in Sept. 2015 quarter. Which means company purchased (and did not manufacture) stock worth Rs. 10 cr. and sold at similar levels in same quarter so sales of Rs. 82 cr. in Sept. 2015 = manufacturing sales of Rs. 72 crs. + trading goods sales of Rs. 10 cr. This trading was absent/negligible in Dec 2015 quarter as stock in trade was Rs. 33 lacs only. So entire Dec 2015 sales came from pure play manufacturing with no trading component. Hope this clarifies.
Thanks for the clarifications. I would like to understand their current utilization and expected future plan utilization. I had written to them but no response yet. Can you please let me know the email address on which you had written to get the reply?
Navneet
@borapratik03 Thanks for the inputs Pratik. But I have one query. If manufacturing sales was 72 Cr in Sep 15 qtr then it has dropped to 59Cr in Dec qtr. Why was the reason behind the same? Considering the 4% YoY growth in India Plant and US plant increasing sales these figures do not justify? What was managements reaction on the same?
I don’t understand what you are saying?
Consolidated sales for Sept. '15 is Rs. 81.59 cr. = manufacturing sales of Rs. 71.34 cr. + Trading sales of Rs. 10.25 cr.
Consolidated sales for Dec. '15 is Rs. 73.84 cr. = manufacturing sales of Rs. 73.51 cr. + Trading sales of Rs. 0.33 cr.
Standalone sales for Sept. '15 is Rs. 64.65 cr. = manufacturing sales of Rs. 59.04 cr. + Trading sales of Rs. 5.6 cr.
Standalone sales for Dec. '15 is Rs. 59.97 cr. = manufacturing sales of Rs. 59.36 cr. + Trading sales of Rs. 0.61 cr.
Please see below reply to capacity utilization levels query -
The expected utilization levels of USA plant as estimated by management is as below (mentioned on Q1 concall) -
![]()
Actual capacity utilization levels for each quarter in FY2016 - (Installed capacity is 9000 TPA)
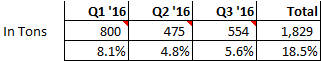
Note : Q1, Q3 and total 9 month levels were mentioned by mgmt. on Q1 concall and in mgmt. interaction. Q2 levels are derived from these inputs.
Takeaway -
- Clearly after Q1 FY2016, mgmt. lacked in maintaining ~8% q-o-q utilization levels.
- Will mgmt. meet its 35% utilization level guidance for FY2016 and 100% for FY2017? Mgmt. sounded quite optimistic on this till now, but numbers don’t support it.
3 Likes
@borapratik03 Hi Pratik, Thanks for the detailed work here. Wanted to understand couple of things from you:
- Any reason why the working capital is so intensive here? Is it the nature of the industry?
- If we look at asset turns and also the return metrics they have been steadily declining. Any reason why is that the case? One reason that comes to mind is because of the capacity expansion that they have undertaken in US. Is that correct?
- What’s the sense, on ramping up the utilization here? As per your posts they will mostly fall short of the 35% utilization target that they set themselves by the end of FY16. What has been the reason for this? Further will this continue to be a drag on the return ratios?
1 Like
Hi, the delay in picking of utilization levels of expansion undertaken in US is the key reason for all the above. Mgmt. is of the view that training employees, getting the right quality product and getting prospective clients’ view on test samples has been delaying the process.
There is no regulatory approval or balancing equipment fitting which is delaying the pick up - so it is just a matter of time for utilization levels to pick up. However, I wonder why it is taking so long, especially, when they are starting with selling of commoditized yarn only in US
1 Like
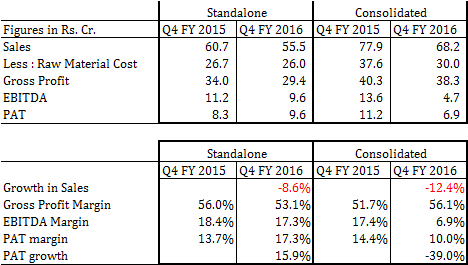
Q4 FY2016 seems to have been terrible for USA ops.
Lower raw material prices, led to lower Sales and healthy gross profit margin. Inability to scale up the USA ops. has impacted EBITDA margins at consolidated level.
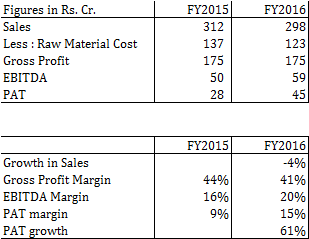
For whole year FY2016, results seem better.
Management has grossly missed out on below guidance -
- USA ops were estimated to make $12 mn revenue in FY2016. My calc. seems to suggest they have made $9 mn revenue only.
- Mgmt. guided for 35% utilization levels at USA ops. My calc. suggest they achieved only ~22% utilization level which is flattish on y-o-y basis. Lower utilization level at USA ops., led to non-distribution of cost and -vely impacted EBITDA margins.
It will be helpful to have concall.
1 Like
Agree Pratik. The US ops haven’t scaled up the way management has guided. Also, the Indian operations were affected this quarter with decline in sales and margins. Hopefully, the management conducts concall this quarter unlike last quarter.
1 Like
Any idea on the concall and reasons for decline in the EBITDA margins
Reached to Centrum Broking for concall. They will get back to me - I will follow up. On EBITDA margins, USA plant reported very poor sales, so other cost items (except for raw material cost) got distributed across lower sales and impacted EBITDA margins.
2 Likes