Dear Tony sir and all the forum members wishing a Happy and Prosperous New Year 2015
**rk
**
Dear Tony sir and all the forum members wishing a Happy and Prosperous New Year 2015
**rk
**
@onlycastel, @SD101201: Reviving an old thread from slumber for some knowledge.
I am going through Thomas Dorsey book and wanted to go through the old charts shared in this forum which dates to 4-5 years.
Can anyone tell how can I view those charts now ? The same hyperlinks of chartink is giving the current charts.
My gut feeling is that bookish knowledge of Dorsey when combined with the charts posted here can provide great knowledge which we can validate since the event has already happened.
Hi @onlycastel Tony .I try to learn the Methods Could you please help me as these links and charts are no more visible .Where can find the relevent examplory charts apart from the Book your shared .Thanks …
blockquote, div.yahoo_quoted { margin-left: 0 !important; border-left:1px #715FFA solid !important; padding-left:1ex !important; background-color:white !important; } You will not get the old charts. However, if you need help on any specific issue, I will certainly help you.
Tony
saurabhricha
April 29 |
@onlycastel, @SD101201: Reviving an old thread from slumber for some knowledge.
I am going through Thomas Dorsey book and wanted to go through the old charts shared in this forum which dates to 4-5 years.
Can anyone tell how can I view those charts now ? The same hyperlinks of chartink is giving the current charts.
My gut feeling is that bookish knowledge of Dorsey when combined with the charts posted here can provide great knowledge which we can validate since the event has already happened.
Visit Topic or reply to this email to respond.
To unsubscribe from these emails, click here.
@onlycastel @mallikarjun could you please send me the books on technical analysis rkajla74 _at_the_rate_gmail_com
regards
For Point and Figure I use chartink. The link is here:
Mps Point and Figure Charts, Stock Research NSE BSE
Mps Point and Figure Charts, Stock Research NSE BSE
Mps Intraday chart, Stock Analysis EOD Charts, Mps Live Chart
yourraj
April 30 |
Hi @onlycastel Tony .I try to learn the Methods Could you please help me as these links and charts are no more visible .Where can find the relevent examplory charts apart from the Book your shared .Thanks …
Visit Topic or reply to this email to respond.
In Reply To
onlycastel Tony Tony
March 3 |
Bullish Signs: We all hear a lot of technical analyst commenting that the stock has been making HIGHER TOPS AND HIGHER BOTTOMS. What does this really mean? Attached is a chart of Asian Paints which shows arrows in blue colour. The arrows in blue colour are consistently rising. These arrows show th…
Visit Topic or reply to this email to respond.
To unsubscribe from these emails, click here.
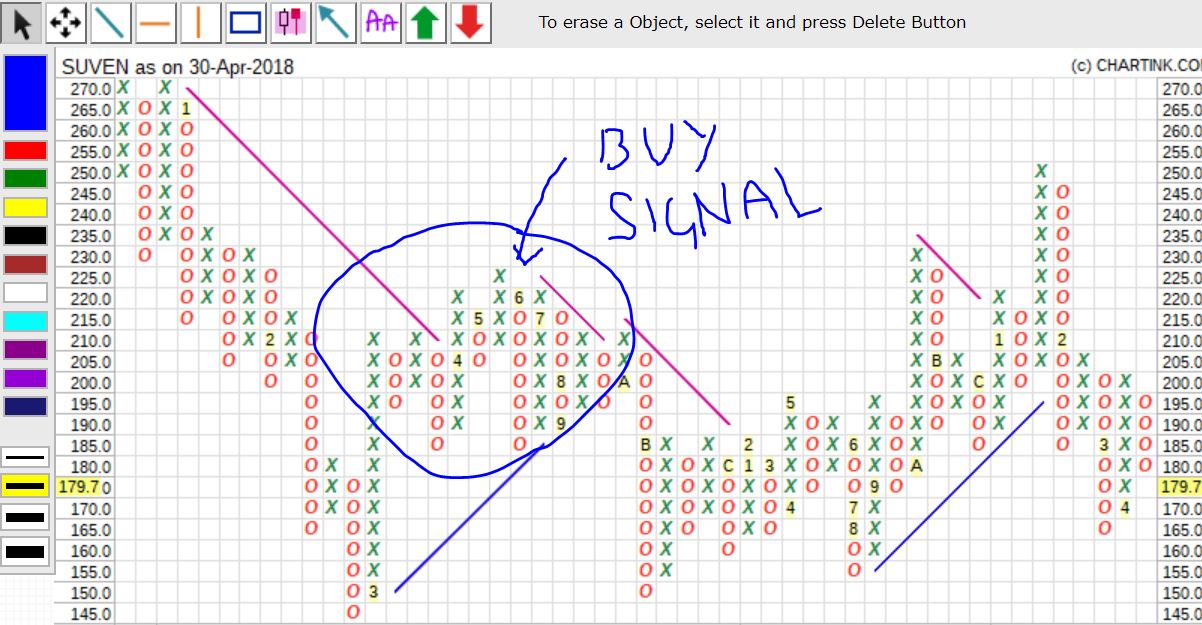
@onlycastel: Somewhere between 2016 and 2017, didn’t Suven had a bullish catapult formation ?
As per the screenshot, there was a strong buy signal.
According to the book:
“Let’s look at the bullish catapult in pieces to better understand what it is saying to us. The triple top is saying that the stock has a very high probability of rising in price, assuming the market is in a bullish mode. In fact, this type of pattern has a success probability of 87.5 percent in bull markets.”
The stock nosedived from around 225 to 150 levels after that without much change in the fundamentals.
Is it because of the entire pharma sector having not so good time in that year ?
The book also says this:
“The bullish catapult is a confidence builder. This is one pattern that you can be more aggressive with when the overall markets are in a bullish mode, the underlying sector is in a bullish mode, and the fundamentals are superior in the stock.”
You are right. One should also look at the sector performance which has a very big influence on the stock. (A recent example is Ajanta Pharma which has been in consolidation mode for a very long time because of weakness in the pharma sector.)The structure of the chart (Suven) is not good. After making a high of 270 the stock has been making lower tops and lower bottoms. On its way up it will meet a lot of resistance. It will consolidate side ways and when all selling of weak hands is over it will start moving up. Also the Bullish Support Line marked in Blue has been of very short lengths showing that the stock is not strong. A strong stock should look like this:Kei Industries Point and Figure Charts, Stock Research NSE BSE
See the bullish support line and see how the stock has been making higher tops and higher bottoms.
Kei Industries Point and Figure Charts, Stock Research NSE BSE
Kei Industries Intraday chart, Stock Analysis EOD Charts, Kei Industries Live Chart
saurabhricha
April 30 |
@onlycastel: Somewhere between 2016 and 2017, didn’t Suven had a bullish catapult formation ?
As per the screenshot, there was a strong buy signal.
According to the book:
“Let’s look at the bullish catapult in pieces to better understand what it is saying to us. The triple top is saying that the stock has a very high probability of rising in price, assuming the market is in a bullish mode. In fact, this type of pattern has a success probability of 87.5 percent in bull markets.”
The stock nosedived from around 225 to 150 levels after that without much change in the fundamentals.
Is it because of the entire pharma sector having not so good time in that year ?
The book also says this:
“The bullish catapult is a confidence builder. This is one pattern that you can be more aggressive with when the overall markets are in a bullish mode, the underlying sector is in a bullish mode, and the fundamentals are superior in the stock.”
Visit Topic or reply to this email to respond.
To unsubscribe from these emails, click here.
Thanks @onlycastel. Will keep updating this thread with more learnings and queries as I progress.
In your opinion, is PNF applicable for SME stocks where trading volume is very very low. Can we predict the movement in these stocks ?
The price of low volume stocks can be manipulated and hence charts can be of less help. Go for liquid stocks with good chart structures. Example see chart of KEI Industries. See the Bullish Support Line in blue how it is rising at a 45 degree angle and the price continues to be above this line. Higher tops and higher bottoms are stocks of great strength.
hi @onlycastel
This is preet karan.
I read your post on valuepickr forum and got a lot of insights regarding P&F charts.
I am extremely thankful for your contribution to the forum.
The problem was that the post was old and i could not access the chart you mentioned in your analysis.
i have tried to develop the bullish percent indicator (for bse 100) as per 29 jan 2019 in excel, its a request if you can look into it and give your feedback.
The total buy signal is 42.
please let me know if it is getting tallied to your numbers.
And if you can send me your template, i will be most delighted.
i also have query about your bullish percent methodology for sector analysis.
for example there are lots of stocks in BSE Auto sector, do you check all of them or just check the large capitalisationbse 100.xlsx (13.8 KB)
ones.
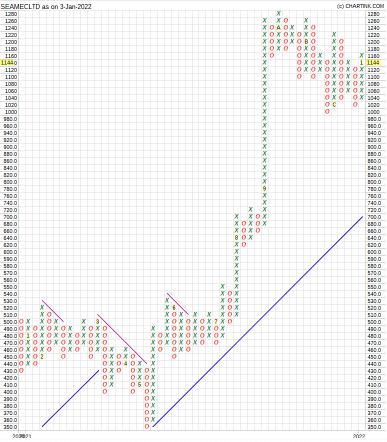
What do the current chart pattern for SEAMEC indicate…The volumes have been on an uptick last few days …Has it already formed a triple top?
 Consolidation over …breakout possible ahead of next week’s Board meeting
I was of the opinion that this thread was about Point and Figure charts … where is the P&F chart here?
 440 has acted as resistance in the previous 4 attempts
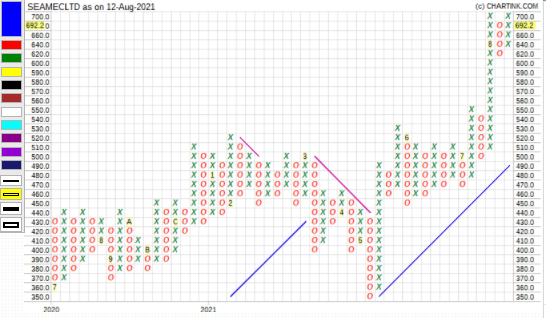
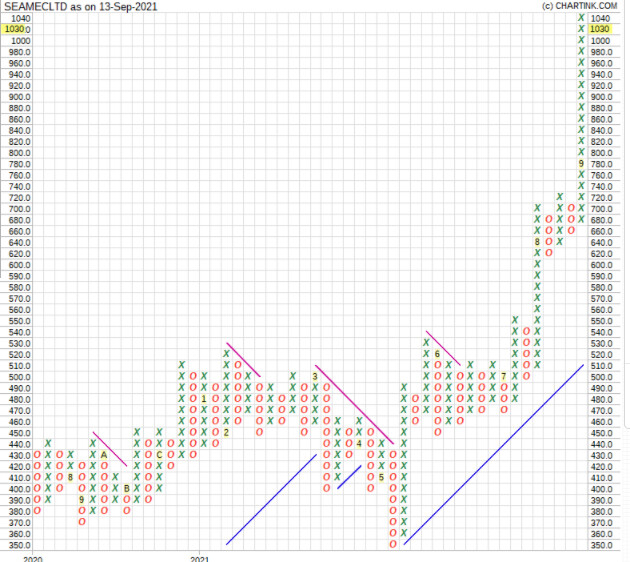
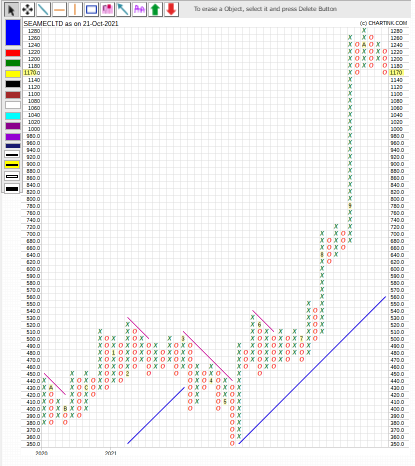 Pole and flag formation work in progress