Happened to read through E-MTN offer document by PNB Hsg. Found several nuggets of information which I found useful. For posterity and benefit of participants in this thread, I post it here. It is a long post, but definitely lighter than the 415 page document I browsed through.  Hope you find it useful. It is pure cut and paste job of interesting portion only.
++++++++
Our total loan portfolio grew at a CAGR of 51.36% from 168,193.17 million as of 31 March 2015 to 385,313.46 million as of 31 March 2017, and was 552,957.70 million as of 31 December 2017. Our outstanding deposits (net of maturities) grew at a CAGR of 42.80% from 48,974.26 million as of 31 March 2015 to 99,870.90 million as of 31 March 2017, and were 106,684.72 million as of 31 December 2017. Similarly, our revenue from operations grew at a CAGR of 48.31% from 17,767.26 million in Fiscal Year 2015 to 39,078.32 million in Fiscal Year 2017, and was 39,467.60 million in the nine months ended 31 December 2017. Our network has also expanded from 32 branches and 14 processing hubs as of 31 March 2014 to 80 branches and 21 processing hubs as of 31 December 2017.
++++++++
One of the measures through which we analyse our financial performance is net interest income, or NII, which represents our total interest income less total interest expense (including brokerage on deposits, but excluding loan origination costs). Our NII was 187.05% of our profit after tax in the nine months ended 31 December 2017.
++++++++
As of 31 December 2017, 29.63% and 70.37% of our loan portfolio were fixed and variable interest rate loans, respectively.
++++++++
As our loan portfolio has grown, our gross NPAs have also increased and were 2,304.51 million, 857.73 million, 598.08 million and 341.35 million as of 31 December 2017 and as of 31 March 2017, 2016 and 2015, respectively, but were 0.42%, 0.22%, 0.22% and 0.20%, respectively, as a percentage of our total loan portfolio as of those dates. One of the effects of our recent growth is that a significant portion of our loan portfolio is relatively new.
++++++++
As of 31 December 2017 and as of 31 March 2017, 2016 and 2015, our provisioning coverage ratio (i.e., reflects the ratio of provisions created for NPAs, standard assets and provisions for contingency to gross NPAs), was 175.11%, 303.38%, 295.34% and 295.17%, respectively, and our net NPAs, as a percentage of our total loan portfolio, were 0.33%, 0.15%, 0.14% and 0.07%, respectively.
++++++++
One of the effects of our recent growth is that a significant portion of our loan portfolio is relatively new. As of 31 December 2017, approximately 77.14% of our total loan portfolio had a tenure of less than 24 months since the first disbursement. We believe that the risk of delinquency in housing loans typically emerges 18 to 24 months from disbursement. As a result, there can be no assurance that there will not be a significant increase in the proportion of our loans that are classified as NPAs as our loan portfolio matures. Further, negative trends or financial difficulties could unexpectedly increase delinquency rates and we could also reach a point in the future where we may not be able to expand our portfolio at high growth rates without allowing the overall credit quality of our loans to deteriorate.
++++++++
The NHB Directions currently permit HFCs to borrow up to 16 times
their net owned funds (NOF). As of 31 December 2017, we had total borrowings of 507,509.95 million, or approximately 9.01 times our NOF (56,321.30 million).
++++++++
Furthermore, under the terms of the License Agreement, PNB will have the right to terminate the license if its shareholding in our Company falls below 30.00% of our outstanding equity share capital. There can be no assurance that PNB will not exercise its right to terminate the license under the terms of the License Agreement in the event its shareholding falls below 30.00%.
++++++++
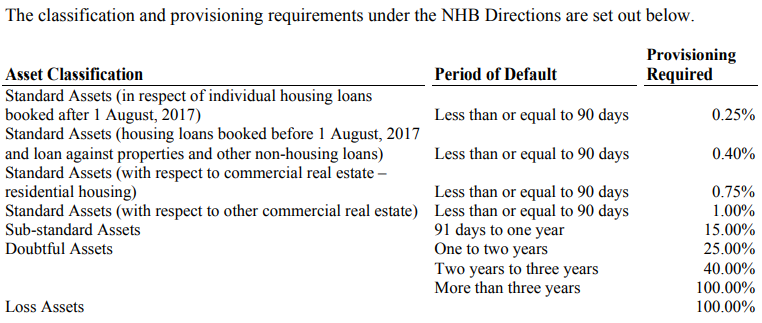
Similarly, pursuant to the NHB Directions, HFCs accepting deposits are currently required to comply with a statutory liquidity ratio (SLR), or a minimum percentage of their deposits that they are required to maintain in the form of approved investments, of 12.50%. Under these requirements, 6.50% of their deposits must be held in approved unencumbered securities and the additional 6.00% of their deposits may be held in either approved unencumbered securities or fixed deposits.
++++++++
Certain key measures taken by the RBI to assist in fulfilling the Government’s objectives include the reduction in risk weights applicable for affordable housing loans for the purpose of calculation of CRAR and allowing HFCs to raise long-term ECBs for on-lending towards affordable housing, which the RBI defines as housing loans with a size of up to 2.50 million.
++++++++
For instance, under the NHB Directions, we are only allowed to mobilise deposits up to five times of our NOF. As of 31 December 2017, our deposits amounted to 1.89 times our NOF (56,321.30 million). Further, we are not allowed to accept or renew any deposit which is repayable on demand or on notice, or which is for a tenure of less than one year or more than 10 years or which pays interest at a rate exceeding 12.50% per annum.
++++++++
The NHB provides refinance for certain qualifying loans at significantly reduced rates to certain qualifying HFCs pursuant to various rural and affordable housing schemes of the Government. In order to access NHB refinance, we are required to lend to certain select customers in the low and middle income segments in rural and urban parts of India. As of 31 December 2017, our outstanding refinancing from the NHB was 25,701.73 million. In the nine months ended 31 December 2017 and in Fiscal Years 2017, 2016 and 2015, we were disbursed 0.00 million, ₹10,000.00 million, ₹9,000.00 million and ₹10,100.00 million, respectively, under various refinancing schemes of the NHB.
++++++++
In the nine months ended 31 December 2017 and in Fiscal Years 2017, 2016 and 2015, we sourced 65.65%, 59.47%, 55.00% and 53.07%, respectively, of new loans from our in-house channels.
++++++++
We have made, and expect to continue to make, investments in personnel and our technology platform to allow us to expand our loan portfolio. In particular, we have invested 355.00 million in developing, acquiring and implementing our new integrated technology platform, “enterprise system solution” (ESS) as well as in recruiting and training our personnel, as well as in the related back-up systems. The new ESS platform was launched recently and is expected to be useful for improving our technology in areas such as lead management, loan origination, loan management, collections and collateral management, deposits, customer service and integrated accounting. One of the consequences of implementation of our ESS is that our loan originations process has become increasingly dependent on our ability to adopt technological changes, such as our ability to process applications over the internet, accept electronic signatures, provide process status updates instantly and provide other customer-expected conveniences.
++++++++
For the nine months ended 31 December 2017 and Fiscal Year 2017, 83.76% and 77.83%, respectively, of housing loans to salaried customers had a TAT of three days (the benchmark we use for salaried customers) and 80.47% and 72.04%, respectively, of housing loans to self-employed customers had a TAT of seven days.
++++++++
The operational efficiencies that we derive from our new operating model have also helped us reduce our *cost to income ratio, which was 22.43%, 25.15% and 30.87% in Fiscal Years 2017, 2016 and 2015, respectively. Our cost to income ratio was 18.32% in the nine months ended 31 December 2017, during which time we continued to expand our business through the opening of additional branches and expect to realise additional operational efficiencies as those businesses develop.
++++++++
We undertake rigorous credit appraisal and verification processes to manage the risks associated with selfemployed customers and only lend to self-employed customers that are able to provide formal proof of income. However, we are able to charge self-employed customers interest rates that are higher than what we offer to salaried customers, which means that we can realise relatively higher yields from these loans to the extent the additional risk can be managed.
++++++++
We believe that the quality of our credit underwriting, monitoring and collection processes is further evidenced by the outcome of the “PNB Housing Finance Ltd – Issuer Profile” sought from CRISIL Ratings, according to which the percentage of “gross NPAs (2 year lagged)” of our portfolio as of 31 March 2017 was 0.5%, compared to an industry average of 1.2%. (Source: CRISIL Ratings – PNB Housing Finance Ltd – Issuer Profile, February 2018.)
++++++++