It is a long paper. Here are some take always. Quoting:
First, Fama is mostly right in that a sharp price increase of an industry portfolio does not, on average, predict unusually low returns going forward. Average returns following a price run -up approximately match those of the broader market in the following two years, and are unremarkable in raw terms as well.
Second, although sharp price increases do not predict unusually low future returns, they do predict a heightened probability of a crash. If we define a crash as a 40% draw down occurring within a two-year period
The reasons for the difference in results between returns and crash probabilities are two-fold. First, as already noted, some industries just keep going up, and do not crash at all. Second, as importantly, bubble peaks are notoriously hard to tell, and prices often keep going up, at least for a while, before they crash, leading to good net returns for an investor who stays all the way through.
The average return between the first identification of the price run-up and the peak price is 30%, confirming the adage that it is difficult to bet against the bubble,
Most historical accounts of bubbles have a strong industry component.
Across the price run-ups that we study, an average of 61% of firms in the industry experience price increases of 100% or more during the run-up period.
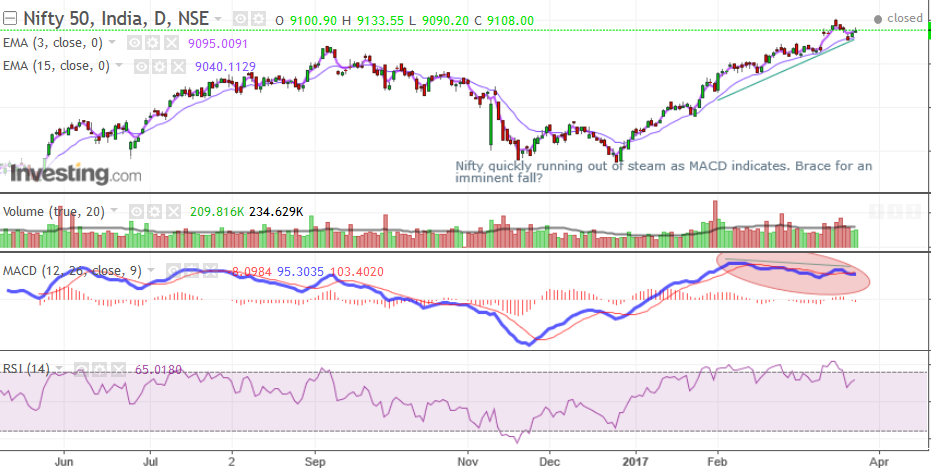
I just noticed in Nifty’s daily charts that the upward momentum is losing steam. As Nifty is making higher highs, MACD is making lower highs. Possible reversal on the cards?
Current nifty level is quite precariously poised. In the short term, we may have a correction in the city on weekly charts. It all depends upon how steeply it falls in the correction on weekly charts.
Next 1-3weeks are crucial for nifty…Will be watching the fall and then a pull back to a new high…The magnitude of both the fall and pullback will determine the subsequent direction.
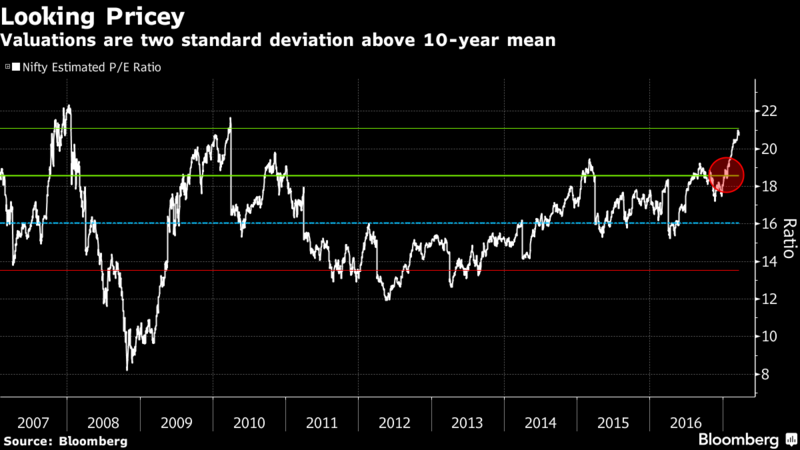
When the economy is not using the complete built-up capacity, valuation can tend to look to be in a bubble going only by P/E. This is where going by historic P/B (We are nowhere close to 2008 P/B) will help discern the difference of whether or not we are in a bubble. Currently it looks like we are on the cusp of a demand pickup which should justify the valuations. Time will tell.
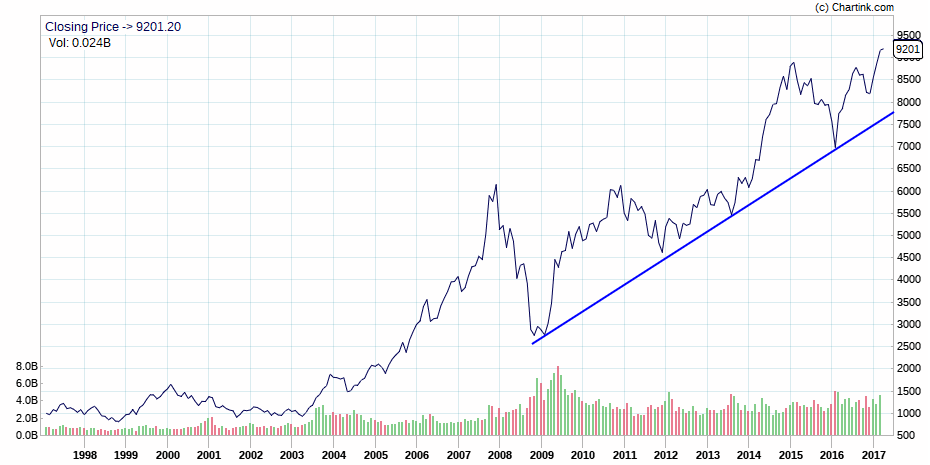
I did an analysis on the nifty historical PE,div yield,P/B data from nse. I took Book Value from P/B data.and EPS from PE data and calculated ROCE as EPS/BV. Then I took PE/ROCE. the calculated the Grahams no. ie PE multiplied by P/B. Then I added Grahams Number to PE/ROCE. This metric now gives the valuation based on Price to Book, Price to Earnings and ROCE combined. When this metric approaches a value of 300, the nifty can be treated as extremely overvalued. It occurred two times after 1999. Once in 2000… nifty had a long correction of 40% from 1700 to 950 in two - three years, then in 2008 nifty had a steep correction of 60% from 6300 to 2500 in one year time. Also when this metric falls below 125 range it is an allout buy…At present the value of this metric is 240 levels…I am relatively inexperienced in stock markets. I am not sure of this analysis. If any respected members in this forum guides me in this analysis i will be thankfullNIFTY50 PEPBDIV.xls (1.7 MB)
Well, Nifty 50 should not be the right index to judge, to start with. The index composition changes 2 times a year and that too, so much that it is actually meaningless to track PE of nifty 50. Rather, I would look at Nifty 500, PE, PB and Div. Y.
Though the main index (Nifty 50) has not fallen much but Midcap index has been falling since last few days.
Is it an early warning that a major correction is on its way and people have started dumping Mid and Smallcaps as during correction these are worst affected.
Nifty present PE as per NSE data is 24 odd levels which seems quite expensive especialy when the is no earnings growth. The earnings growth was subdued or even minus for the past 9 odd years after the global financial crisis of 2008. But we should approach things differently this time.
2003 nifty 50 EPS was just Rs 75/-. There was a stagnation for years before that when the earnings was not showing any growth, but even degrowth.Market was giving nifty a pessimistic valuation of 14 PE multiple at that time(2003).From 2003 onwards earnings growth began to happen.During 2003-2008 we witnessed an earnings improvement of 25% CAGR. At nifty peak 6300 in jan 2008 it was nearly 225.(25% CAGR). At peak in Jan 2008 market gave a valuation of 28 PE multiple taking nifty to 6300.
A dynamic economy like India cannot stay for years of stagnant growth like we are witnessing now. With a strong leadership and futuritic ways the govt is leading us can trigger the much awaited earnings growth. Earnings have started to increase.There is an 8% increase in earnings compared to last year. As per NSE data the present EPS of Nifty 50 is Rs395/-.Market is assigning an optimistic valuation of 24 PE multiple. If the earnings can compound at a rate of just 15% for next 5 years.(15% is conservative in a growth period, if growth is aggresive it may be 20%) nifty EPS will grow to Rs800/- within 5 yrs and at a historic peak valuation of 28 nifty will be 22500.If 20% CAGR can be maintained then EPS will be Rs98/- and nifty can be 27500. With the NPA cleaning of banks ballance sheets, and downtrend in interest cycles, and more demand leading to more capacity utilisation, earnings growth will surely happen. There is a lot of unutilised capacity for companies and it is evident from the poor return to Book Value. The unutilised capacities are lying as liablities to companies which are adding to their debt burden. Once demand picks up and these capacities are being utilised, together with lowering interest rates, there will be a huge change in the earnings of the companies.
So as the future is so optimistic, market is giving this kind of valuations. So I think even a 24 PE cannot be considered as expensive this time.
While I will be a very happy investor if whatever you say comes true but somewhere I am worried more about that next two years that include the 2 most important events specific to the Indian economy — one, GST rollout and its side-effects and two, general elections.
off course the rollout of GST and its side effects may act as headwinds for some time and that may delay the rally for sometime…But I think general election may not be a problem… those who missed the bus may get a good chance to accumulate good stocks…
In the past two decade, IT and Pharma brought the growth for NIFTY.
Indian consumption story has been a mirage in the past and will
continue into the feature.
I wonder which sectors will bring 30% growth for the next 5 to 10 years
going forward, so that we could bet on 15% earning growth for nifty.