
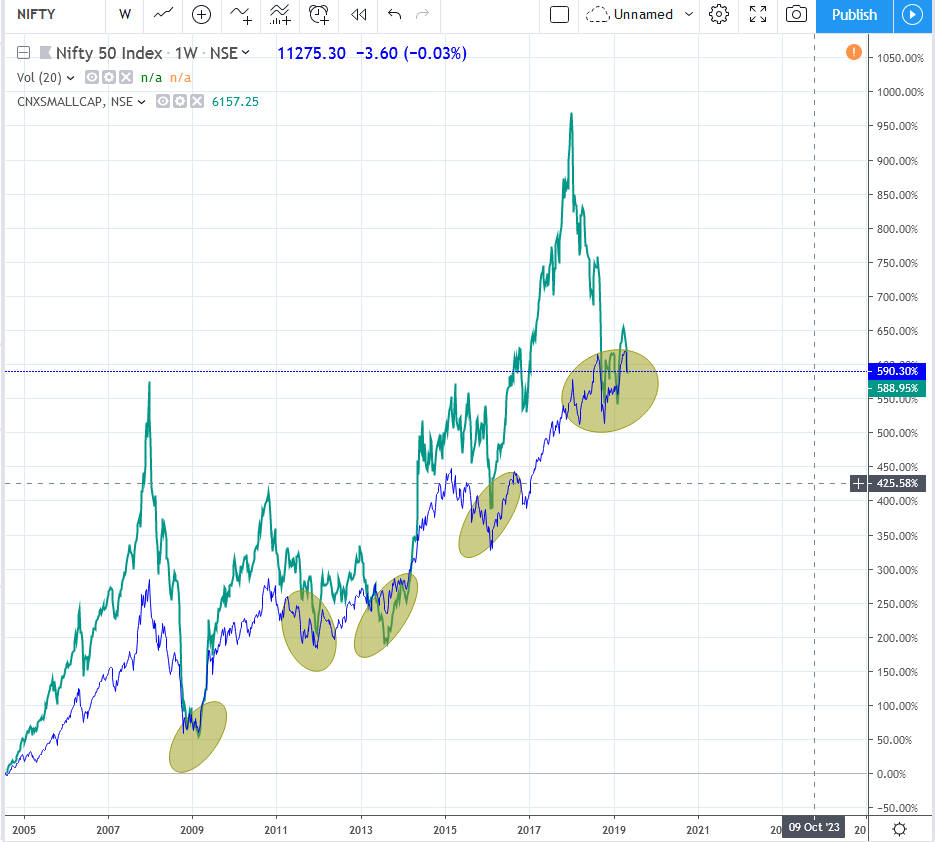
The chart below is of nifty small cap 100 superimposed on Nifty 50 with base year 2004, correction has ended in the past each time small cap reverse to mean and falls back to nifty 50 zone;
18 Likes
Did you know about 2008 event? Or did you know about the housing loan bubble back then?
(Intrestingly the shiller housing price index is reaching top now)
The thing is, “the event” will always be obvious after it will happen. Till then we are simply uncertain.
The only partial certainity we have is expensiveness of the market and that mostly reflects hope. And hope is not a plan…
4 Likes
A short time ago (week, 2 weeks), someone posted a calculation of Nifty P/E calculated based on full float rather free float & the P/E came out in the early 20s. The same calculations were posted on twitter also. Does anyone have a link to this?
The point being that during the last crash, the Index was based on full float - so 29 P/E now is not the same as the 29 P/E then.
The BSE Sensex P/E is around 29 now.
Are you referring to this?
This is Sensex 30 not Sensex 50 (in fact this is the first time I heard of Sensex 50).
Just looked at Sensex 50 page on bse website.
Yes.
Yes. I am not getting your point.
Adding further to the quoted post:
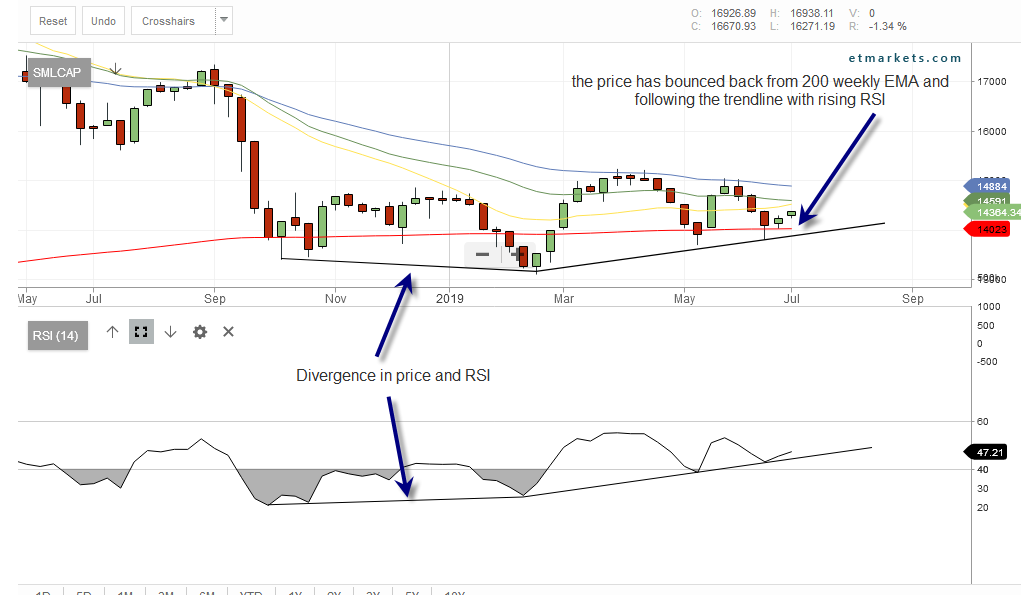
The small cap index price and RSI were in divergence from october2018 to mid feb 2019, pointing to potential bottoming out and reversal of trend for the small cap. From feb 2019, the new trend has started with RSI and price in sync forming higher lows and now it has bounced back from 200 weekly ema in June indicating accumulation phase in small cap. Small cap would get rewarding if able to take down 15000 mark successfully.
3 Likes
Three of the economy lead indicators are cracking namely auto, realty and inventory levels. When will the stock market follow suit and crack?
With interest rates going down, market may not crash, due to increased money supply. However without any substantial earning growth they may not rally either. Perhaps we will see this rangebound market continue long enough to give us a time-correction.
1 Like
I think nifty maynot even crack 11K…as the earnings from heavyweights are as per estimates i believe…TCS…RIL are kinda ok…i think HDFC and HDFC Bank will be better…which will keep nifty afloat…
1 Like
Hi
This post I can write on this thread without hindsight bias now. Earlier when I was writing in January 2018 about a very simplistic novice like analysis of distribution curves (skewed or not) I only had historical data to talk about. Please note it has nothing to do with how PE is calculated or whether this is standalone or not. It is about statistical trends. I think I was not able to drive this point earlier.
But being a firm believer of certain quantitative principles I was ready to put money where my mouth is.
In this case I was ready to stay as much in cash as possible. I am quite certain that my 7% on my 70 odd percent of my portfolio in this period is better than most market participants in the small & mid cap space by the grace of lady luck.
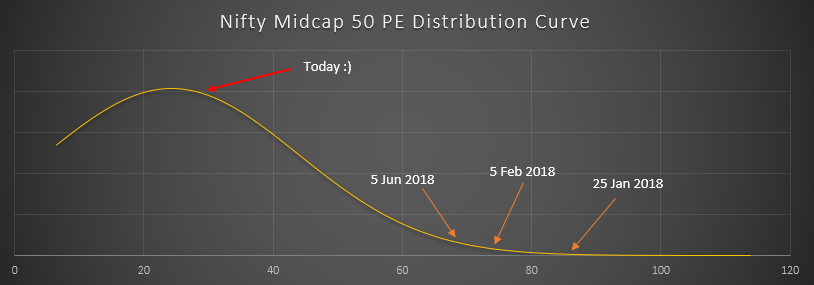
Now lets look at how reversion to mean has panned out. The most right skewed probability distribution curve was for Nifty Midcap 50 index. In the picture below the orange arrows are what I showed in H1 2018 CY. The red arrow is as of today. Mind you we are still not in the undervaluation zone in midcaps.
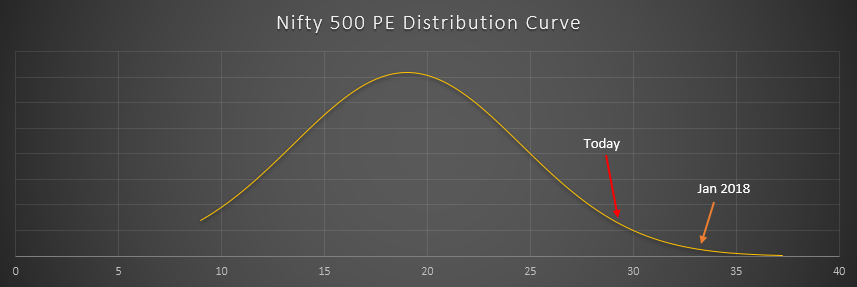
If we look at the broader market because of the top 10-15 stocks where the fund managers are taking refuge we do not see an appreciable reversion to mean. This index covers ~95% of market cap in listed universe. This is also not a normal curve, it is right skewed.
Not that we are in prediction business but we want to be on the realistic side of events which will unfold. I don’t think no matter how good one is as a stock picker it is very difficult to swim against the tide.
Personally I continue to sit tight most of the time. Whatever investments I had I have added little to them (except my kid’s portfolio where I do an SIP equivalent & slowly build an auto basket). Some of my active stocks have taken a lot of punches, most of my mistakes is in not analyzing well and being naive.
If there is capitulation in the larger names God forbid then it will depress the entire mid and small cap space. The silver lining would be the further lower valuations.
As someone rightly said - It is better to be out of the market and hope that you were in than to be in the market and wish you were out.
Regards and all the best
Deepak
18 Likes
Moderators, feel free to remove this post if it’s not relevant to the thread.
The notion of being careful’s with one’s individual picks / portfolio based on broad market movements has always bothered me. Now, I agree with the fact that individual picks may very well correct with the broad market regardless of how good they are. But if the investor has bought it at a reasonable discount to estimated value and not based on a napkin-back estimate, then the investor should receive their required rate of return in the long run (Provided there was a considerable discount allowed to the expected value i.e. a Margin of Safety).
The problem with staying out and wishing they were in, is that it’s hard to decide when to get back or worse, that most of the good bargains would be gone by the time that decision is made. If an investor can indeed do the three things: Exit at the peak, pick the bottom and make sure to not change directions in the middle, then they deserve to earn high returns. I just think it’s very, very difficult and most likely not worth the effort.
But that’s just me. I am indifferent to the broad market and believe that a good price takes care of expected returns in the long run, regardless of hiccups in the mean time. However, if there’s something I’ve learned in the last year and re-learning right now is that having at least 20-30% cash handy is essential to go that extra mile in generating good returns from the market.
5 Likes
Sensex PE always seem to mean revert. Atleast thats what it has done in the last 20 years. Why cant one create a model where one doesnt exactly have to time the top and bottom (which as you say is impossibly difficult) but one where one has to be in more cash as the PE shifts right of the normal distribution curve and more invested as it shifts left. The more extremely skewed it is towards the right or left, the more extreme should be the capital allocation to equity.
1 Like
Looking at current market ,I won’t mind if LTCG tax is 100% 
1 Like
Hi
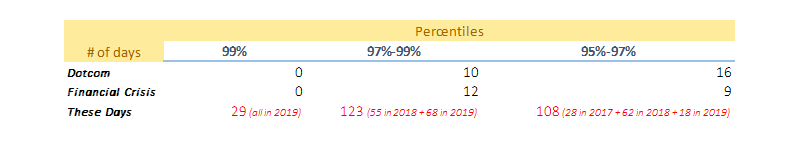
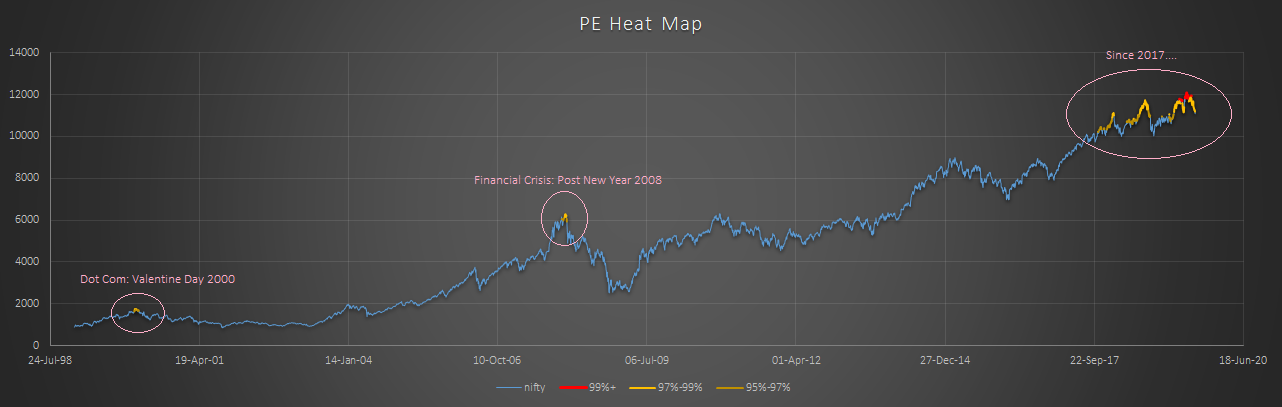
Every 6 months or so I try to check how is the heatmap of our marquee index evolving from a NSE reported valuation metric perspective. I used to look at it percentile wise. So a 99% means that those days the N50 index had PEs reported as 99th percentile since 1 Jan 1999. The below was last year’s graph.
Something interesting has happened since then. The sustained high valuations (because I think everyone is moving their money to the top 5-7 stocks like HDFC twins, BajFin etc.) of today makes dot com and 2008 crisis valuations on a PE level look small.
The heatmap from last time shows this now.
From a probability distribution perspective the curve is as below
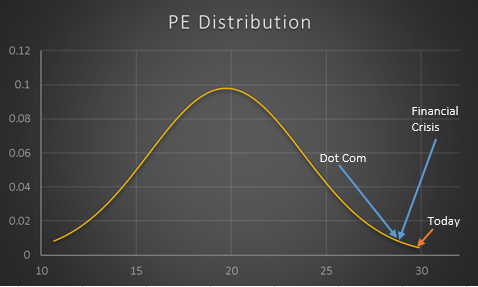
Today = June 2019 peak
I am quite afraid when the big ones fall what will happen to the small and mid cap stocks. They anyways seem to be around their historical median valuation levels. They will become single digit PE stocks. I am certain this is catastrophic for some investors already. I had shared returns from different percentiles for time periods such as 3yr, 5yr and so on. I wonder how those numbers look now post a year.
This is all only from a trend perspective. Derive your own conclusions. Everyone has a different style of investing.
Not that this is related but something to think about
https://markets.businessinsider.com/news/stocks/stock-market-news-druckenmiller-has-zero-exposure-buying-treasurys-2019-6-1028253820
Rgds
Deepak
2 Likes
^^ Inflation expectation and fiscal stability should have a bearing on market valuation as well…for ex. in 2013, CPI inflation was 10%+ , today that’s around 3% -
Do share if you have historic P/B or market cap to GDP ratio data as well.
I think that viewed in context with overall corporate profits the pe looks high but since overall corporate profits are 2.8% -3% of GDP they are at a 15 year low as put out by a study by motilal oswal. So there is a case for recovery as the profit cycle may have bottomed out. I also believe that 11000 was the bottom for nifty after the modi govt was reelected and unless that level is breached successfully on the downside the market will maintain its uptrend. After pushing through the 11000 levels with force the market is taking time to digest it and will test it a few more times , it has already done it once successfully and today was another test. Some base needs to be formed. This is a good time to pick up some stocks that are displaying good growth rates and are available at benign valuations in my view.
1 Like
I believe that a true value investor will wait for Nifty PE to touch its mean.
I find it tough to gauge a proper price to pay for a company, no matter how good or predictable its earnings are. I have seen the best MFs, advisories and individual investors generate poor returns in last three years.
Therefore, I want to see the Nifty PE normalize, to reach its mean, the tide to ebb away.
7 Likes
How much is the mean Nifty PE?