Hi Shan, most of us have read the black swan and are aware of Talebs views. A bell curve gives you a rough approximation of what may be. This is what Charlie Munger has to say about the bell curve.
If you’ve read The Black Swan, and understood it, and still choose to apply mediocristan tools to extrimistan phenomenon, then that’s great, good luck to you. I have nothing to add. I just hope you don’t cross the street blindfolded.
(Ans BTW I completely agree with munger and don’t see any contradiction… he talks of multiple models and not just one, besides I have never seen or heard him talk of predicting market movements based on historical IV)
Shan,
A dilemma that everyone faces in investing is a right entry and exit price once you have zeroed in on the right stock.What would you suggest if we do not go in for the normal distribution and identifying potential outlier values.What we are seeing from 2014 is P/E values remaining high for sustained periods with occasional blips.
I think you have misunderstood. I am merely pointing out that the bell curve is one of the tools that could be used in addition to the other tools you use. Relax and I would advise you to please read the thread from start to finish.
The objective ultimately is to add value to this thread by presenting differing points of view and to try and support your view preferably with data ( which i have tried to do) for everyones benefit.
Attacking others without any valid reason does not gel well with the ethos of this forum.
Partly correct but not entirely! One can use Central Limit Theorem and see that we get normal distributions even if only independence is maintained and the distributions are not identical. We can model different underlying distributions in a spreadsheet and then draw from them and then see that the resultant average would be normally distributed. No wonder we see distributions that are close to normal so frequently in nature.
This is not in good taste. Some may say that Bheesma did a good job and shared it with all of us. Even if one thinks that what he did is totally wrong, the language in the post still appears to be rude.
To learn, first, we have to accept that we do not know. The letting go of our big egos is a prerequisite to learning.
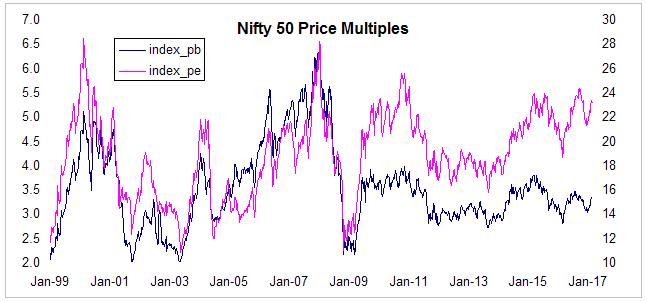
Chart below shows Nifty 50 PE and PB from 1999 until today. It shows that until 2008, PE and PB moved by same margin but since 2009 PE has gone much more than PB. If market is expensive in terms of PE, it should be expensive in terms of PB as well but that is not the case.
Source: NSE
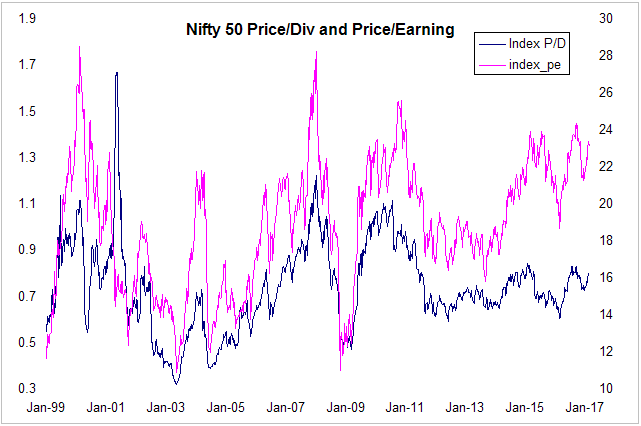
Similarly, I have also included a Price to Dividend chart along with the Price to Earning chart. Price to Dividend is just the reciprocal of dividend yield. Even here, market does not appear to be expensive in terms of dividend yield. Two ratios started diverging since 2009.
Source: NSE
In both cases P/B and dividend yield are not even close to the bubble high levels in 2008. These ratios are even lower than highs of 2010-11. P/E on the other hand has drifted upwards. This could be because of how NSE calculates PE ratios based on stanadalone yearend numbers rather than consolidated TTM numbers.
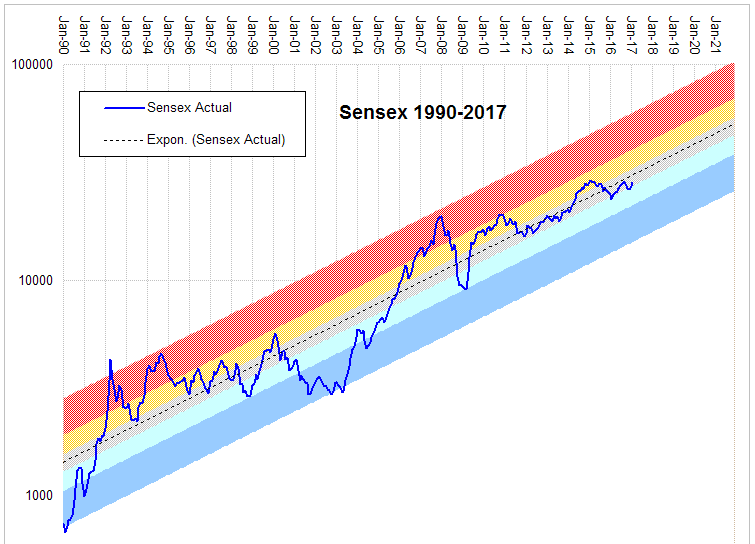
current P/B and Dividend yield are close to their long term average indicating market is fairly valued. Even if you take a look at simple trend vs actual analysis market looks fairly valued (grey zone).
However my view is that we should also keep in mind that Interest Rate have not been in normal zone Post 2008, Central Banks around the world have made decisions which had significant impact on Financial markets in a direct manner. PE ratios post those actions will be distorted. We should anlayze those data points separately
Thanks! It’s another great post.
P/B is P/E* RoE. The divergence between P/B and P/E charts shows that RoE never really recovered after the previous crisis. In other words, earnings growth has been wanting for previous 6 years (3%-4%) while the nominal rate of GDP increased in double digits (10%-12%). Compounded over 6 years, this makes a big difference in the level of earnings of the market. I think that we would get similar graphs if we use MarCap / GDP (P/E * E/GDP) in place of P/B. The big question seems to be whether earnings growth would get closer to its mean (nominal GDP growth rate) and that would lead to P/E reverting to closer to its mean or would the prices decline.
I think that I have made this point repeatedly, won’t repeat it any further.
Since 2009, bonds yields have dropped across the world and this has caused earnings yield to drop as well (since equity risk premiums have remained largely unchanged). Lower earnings yield means higher P/E ratio.
ROE has dropped over the last 8-10 years and one of the reasons for this is the lower inflation rate. Except for 2010-12 period, average inflation rate over the last 10-12 years has been lower than the average rate for the decade before that. Lower inflation means lower ROE in nominal terms although real returns would not change.
Third factor that I want to highlight is also how NSe calculates P/E ratios. Although I could not find their current calculation methodology, in the past they use to calculate PE based on standalone year end results rather than consolidated TTM results. This will cause PE ratio to drift upwards towards end of the financial year. I also wrote a post on how as per my calculation P/E ratio is close to 21 rather than 23 as published by NSE.
Many banks have been reporting huge provisions in the last 4-6 quarters and some are even reporting losses. That also depresses earnings and increases P/E ratio Bank investors are just shrugging off these provisions. Nifty has a high weightage for financials.
If you consider all these factors, market does not appear to be overvalued as suggested by PE ratio alone.
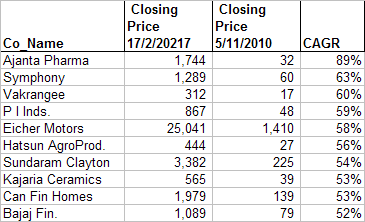
Although this is slightly off topic, I want to highlight that there are about 150 stocks that gave at least 25% CAGR (with an average return of 35%) since Nov 2010 when Nifty was trading above PE of 25. So good-old value stock hunting works even if market is overvalued and there is really no need to exit but we have work hard when market is overvalued be extra picky about what to buy and hold.
PS: for this screener, I only considered stocks above market cap of 100 Cr and stock price above Rs 10 to remove nano cap stocks and penny stocks as of 5/11/2010.
This is reason I can think of: These were non Nifty stocks and mid and small cap valuations continued to be depressed post 2008 crisis. last three years these stocks have seen disproportionate expansion in their PE ratios.
On the question of why RoE has dropped over the past decade - I have a different take than what Yogesh Sane posted. I do not discount the excellent factors suggested - that low inflation is the cause. My thought is, low inflation is a contributing factor, but the primary factor could be the ‘cheap money’ available world over; the argument being, that FII’s in the search of good returns care less about growth. They are piling into wherever they have a chance; possibly playing - bigger fool will buy at a higher valuation - game.
Critiques are welcome, as mine is just an observation.
The proof of my pudding will be when the Feds do turn off the tap and raise rates (also BoE and ECB in time), how will FIIs act. If my theory is correct then as Pranav Pratap correctly questions, we will have a price correction rather than growth revision.
That being said, the Central Banks are keen to wean the market off this cheap money (‘drug’) growth but they are finding it difficult; “They stab it with their steely knives, But they just can’t kill the beast”.
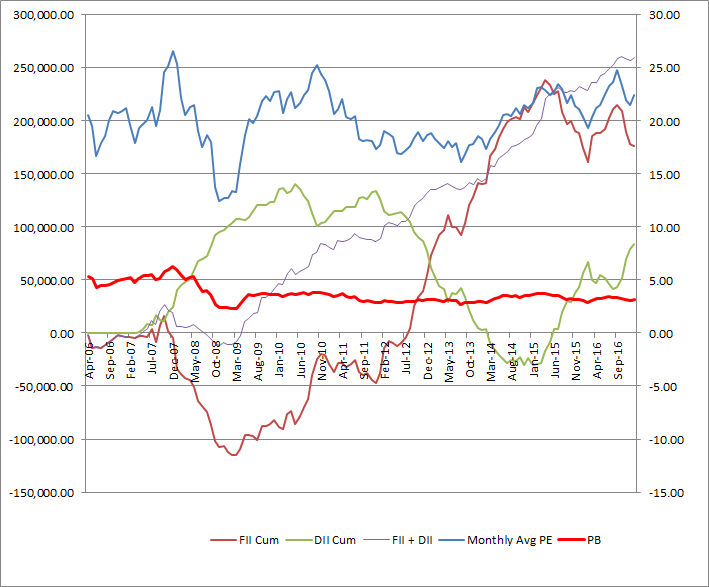
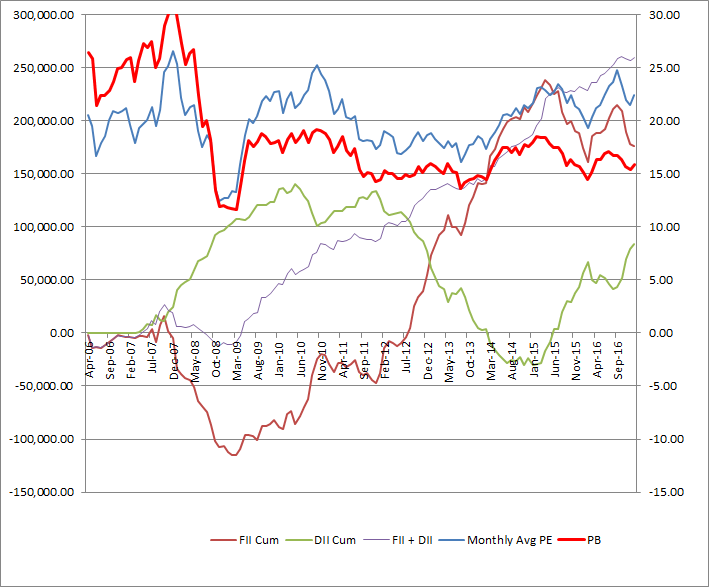
Below I have plotted the cumulative FII and DII data with PE and PB (the second graph, Exhibit 2, is a dramatized version of PB times 5, to show the divorce as the scales of PE and PB do not match, Yogesh Sane has already posted an excellent graph between PE and PB above with normal scale). The big assumption is the FII / DII activities were directly in relation to buy & sell of securities (and not exotic derivatives).
Monthly data for FII & DII from here
Data for PE from here
RoE is a variable that is independent of price or ‘cheap money’, it is a measure of business performance. Price of the stock is distinct from the underlying business and an outcome determined by what buyers and sellers agree to transact the stock at.
‘Cheap money’ may be explained to cause upward price movements, thus determining price. ‘Cheap money’ cannot cause RoE to move up or down.
So while price / cheap money and RoE maybe found to be positively correlated, they cannot cause it to move up or down.
RoE is a variable that is independent of price or ‘cheap money’,
Thanks - fair point; then perhaps I should rephrase my thoughts.
It looks like the ‘cheap money’ has got the market participants to not bother too much about growth (hence RoE). Since the market is not bothered too much (and hence not reverting to the mean), perhaps the companies have taken it easy. (Of course it is not all companies - as mentioned good stock picks in the last decade have yielded great results).
The market is going for it as longs as it lasts; “As long as the music is playing, you’ve got to get up and dance.”
Feds have made more noise today about raising rates - next meet is on March 13-14.
That is plausible. The seach for returns in the era of low interest rates may have pushed developed markets investors to look at India, even though RoE has been falling.
BloombergQuint (@BloombergQuint) tweeted at 3:01 PM on Thu, Mar 02, 2017: #ChartOfTheDay by @nupuracharya | Sensex’s golden cross signals new peak for Indian shares.
This paper (see link below) by Harvard economists, proposes that investors can identify and profit from market bubbles.
Some of the other things they point out - not all bubbles burst, prices continue to rise even after “experts” identify bubbles, if there is a crash the prices don’t necessarily retract back all the way to pre bubble days and they find that Eugene Fama was mostly right when he proposed that a sharp price increase of an industry portfolio does not, on average, predict unusually low returns going forward.