If you consider the 3 big FII sell periods – 2008, 2011 and 2015 – during all 3 of them NIFTY had a 20% plus correction.
But the tables have definitely turned during last/current FII sell period of 2017. So it might seem that our over dependence on FII money and the ability of FIIs to move the Indian markets at their whims has come to an end.
Domestic retail participation has indeed increased drastically, by about 70%.
In 2008, Mutual fund inflow was 107,000 crores.
In 2017, mutual fund inflows was 178,000 crores.
The real picture about FII vs DII is more complex when considering the FIIs, because exchange rate was 40+ during 2008 and now 50% lower. In terms of rupee market capitalization, we are now more than 3 times the value in 2008, at more than 130 lac crore rupees now, versus about 40 lac crores back in 2008. In USD terms, the growth may be much smaller due to rupee depreciation. In fact we apparently crossed the 2008 highs in USD terms only around April/may 2017, so the overall return over a 9.5 year period may now be only around 20% for FIIs.
(Refer to the chart above)
In 2008-09 crash, FII were stiff sellers, shown by a sharp down slope of the FII line in the period, and the market crashed. Then, DIIs didn’t matter, although the volume of DII buying was more than the FII selling.
Applying the same observation to 2016-17 period. DII line has a steep up-slope, showing their strong and clear intention to buy. However, FII line had not developed a clear direction or slope until just before Sep-17.
Hence, One could conjecture that the FII line has now formed a clear negative slope, denoting that FII have now started selling.
Furthermore, this line is likely to go much lower towards the zero line. Showing, their clear intention to sell stock, which wasnt the case in 2016 and most of 2017. Probably because then the rates werent high enough for them to sell, and nor was the buying the volume. But now they have both.
Again, DII buying strength may not support the market, like in 2008-09.
130 lakh crore is 2 trillion USD which is roughly the size of our economy. In 2008, Stock market capitalization to GDP ratio was 1.7 or 1.8 at the peak. Which means we still have lots and lots of room to grow. A 20% correction can come any time in a world where mad men have fingers on nuclear buttons but this so called bubble will grow much much higher before it bursts.
In my opinion, comparing market cap to GDP ratio may not be correct approach. There are a huge number of traditional companies and start-ups which are unlisted. It may simply mean that there has been a tremendous growth in non-formal economy or unlisted companies.
“The only way you can mitigate your losses is by getting almost entirely out of financial assets,” Damodaran said. The problem, however, is that “the cost of staying out of the market is often greater than whatever you might benefit by staying out of the next crash.”
“The real question you have to ask yourself is: Is it worth it to actually reallocate your portfolio to try to avoid that correction when you don’t know when it will come, how it will come and what form it will take?”
“I have never been able to make that prediction solidly enough to reallocate my portfolio,” Damodaran
You would never find a celebrity come out openly and say “Now it is alright to completely exit the market”. Almost as if it is NOT allowed, or as though there will be adverse consequences for the celebrity.
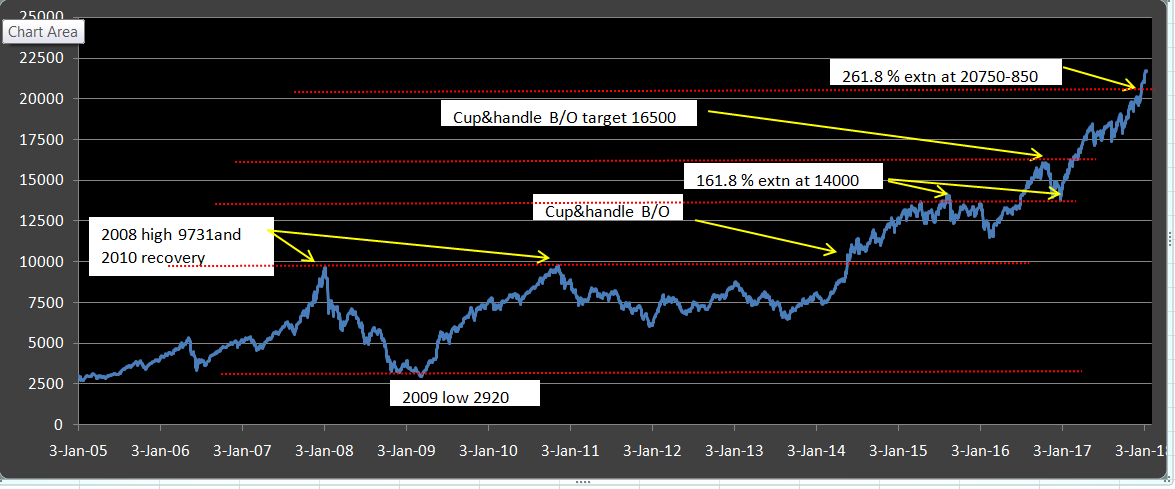
In the last week of Sep-2017 midcap (sensex midcap) was corrected about 5%, first week of Nov-2017 it was corrected around 3%. But where’s it now ? it went on and on. IMHO, don’t time the market, If a specific stock you are looking for corrects more than 10-15% (without fundamental changes) add more, that’ll be ideal.
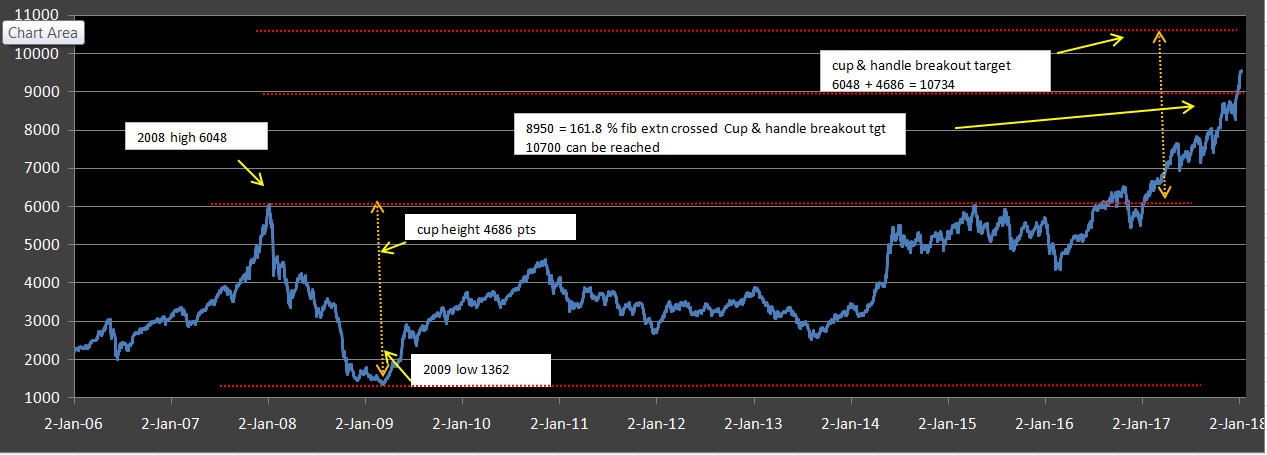
midcap index had crossed the 261.8% fib extension levels at 20750-850 range, and smallcap the 161.8% extension levels at 8950-9000 range. So a correction back to the breakout level can be expected
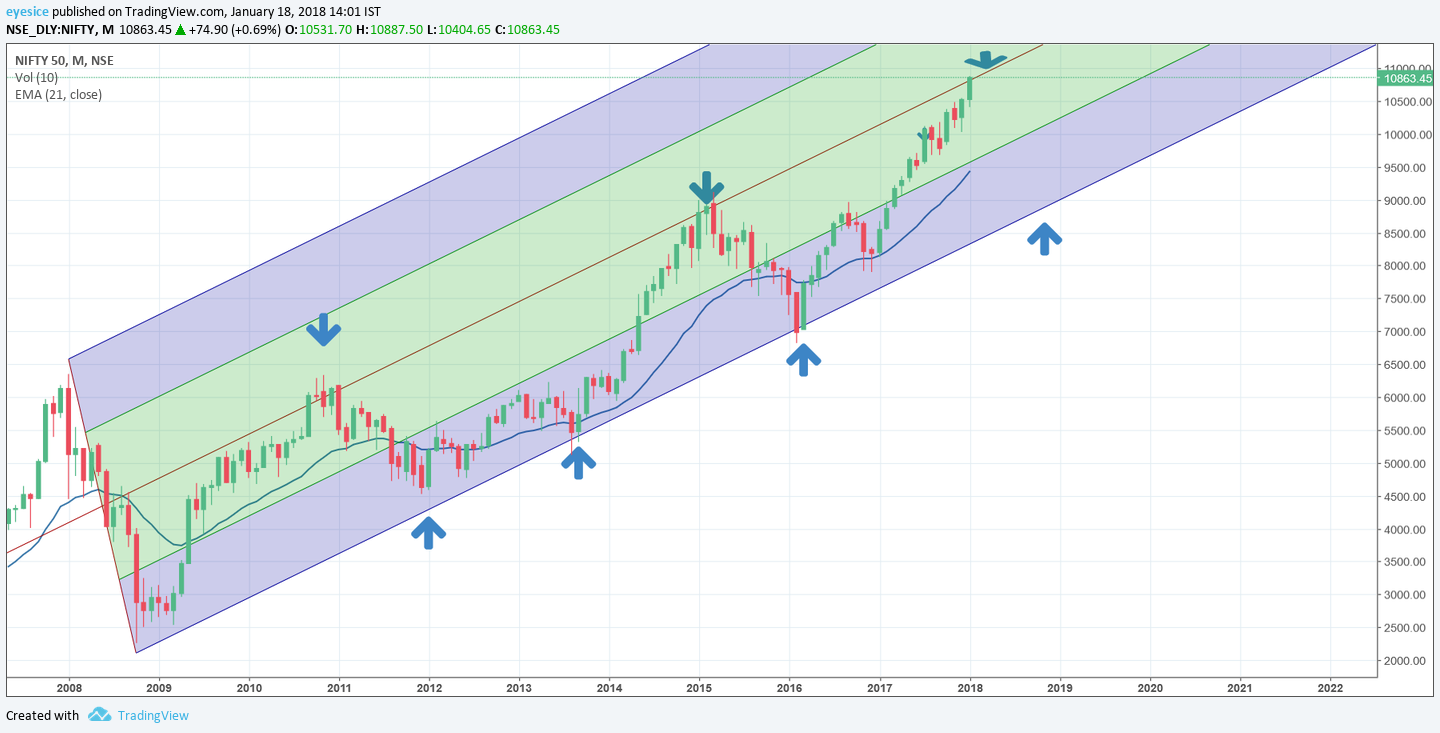
I am no technical analyst but I am posting the updated Nifty monthly pitchfork that beautifully describes the movement of our national index from 2008 to now. As you can see, only twice in the past 10 years have the NIFTY monthly hit the median of the pitchfork. Now it has reached the median for the 3rd time. Once the index hits the median, usually we have a year fall / consolidation. Let’s see if Nifty can breach the median this time or repeat history!
Hi,
nifty has touched the channel formed after 2008 fall for the third time. In the previous consolidation phase after 1992 bull mkt and fall ie the channel formed after 1992fall, when nifty touched the channel top for the third time, after a correctionnifty broke out from the channel for the mega bull run of 2004-2007. i have detailed my observations in the just previous post.
discl. 80% invsted, have puts to protect PF and 20% cash

 IMHO, don’t time the market, If a specific stock you are looking for corrects more than 10-15% (without fundamental changes) add more, that’ll be ideal.