I have a query on the FPI sell data. If you browse this URL, the FPIs have actually been buying in the stock markets. They might be selling in derivatives but I doubt that we can conclude that they are bearish based on this data.
These are my thoughts. This is theory I have for higher market valuation. It is not based on data, but on the basis of observations in day to day life.
Market is a complex system which has input signals , feedback and output signals. Based on the feedback received, input would be converted to output.
Inputs to market
Money flow (in or out)
Type Of money coming in (stable and unstable)
Feedback to market
Events happening in
World
Country
Industry
Individual Stock
Statistics : GDP growth
Emotions
Confidence
Ecstasy
Greed
Fear
Money flow : e.g. FII flow
Output from market
Prices of stocks
Dividend
Emotions : which is also a feedback to market
Dividend
More emotions
Happenings at market are primarily driven by input : type of money coming in and amount of money coming in. If long term money is coming into market it is going to stay for longer amount of time in-spite of valuation being good or bad.
Way market reacts to events is what causes emotions : this would drive short term money flow : traders , small time investors
Way market performs over long term determines the fate of long term money flow
In current scheme of things it looks like the amount of money flowing into the system and confidence of investors that returns would come from here that is keeping the market in state where it is now.
Also from India specific perspective: government is closing down or making difficult to invest in other avenues like real estate , Bank FD. So investors do not have a choice left but to invest in the mutual funds. thus enabling steady flow of money every month via SIP route.
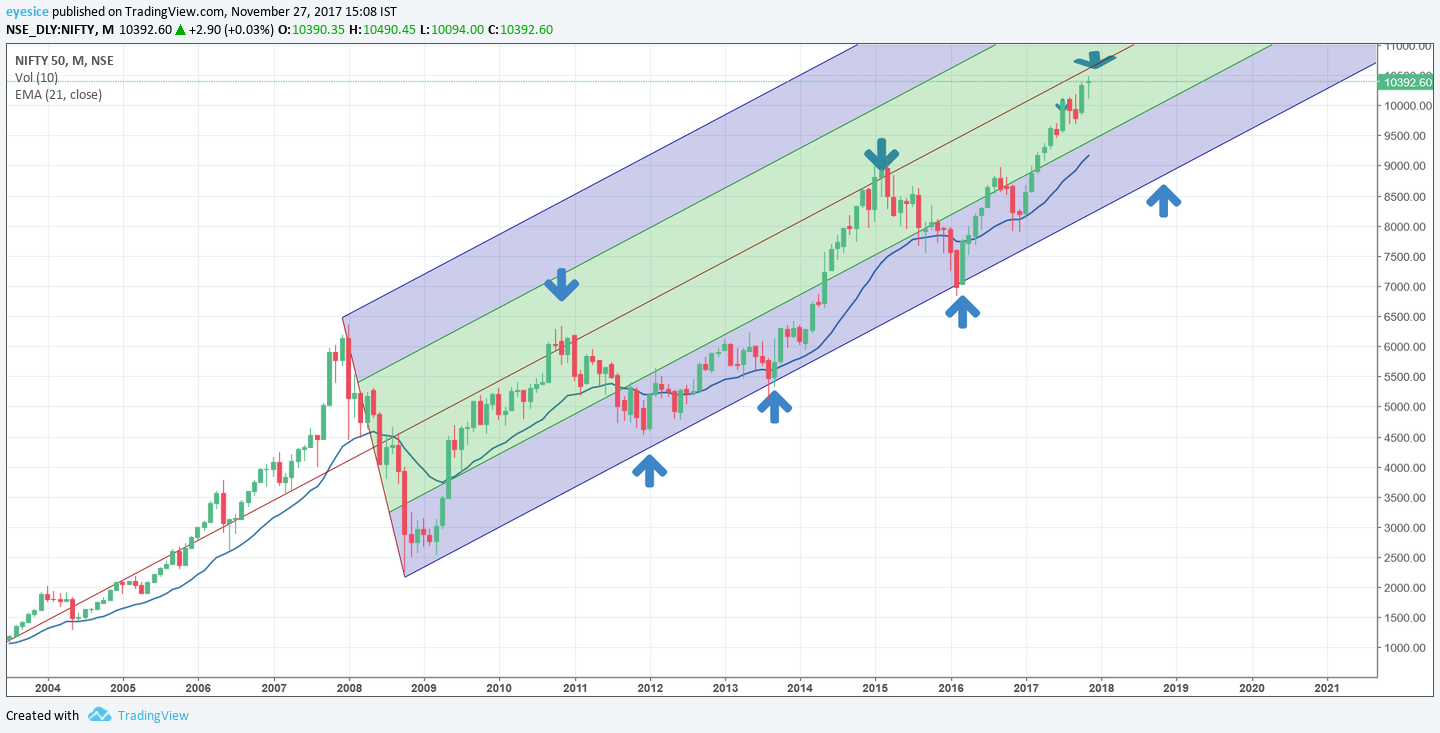
History has repeated twice in the past 7 years and the index is now at the peak of the pitchfork’s median. Can it break through the median or fall to 9000 levels again over the course of the next 12 months? Requesting expert opinions from @bheeshma@Mehnazfatima and other gurus whom I may have missed out.
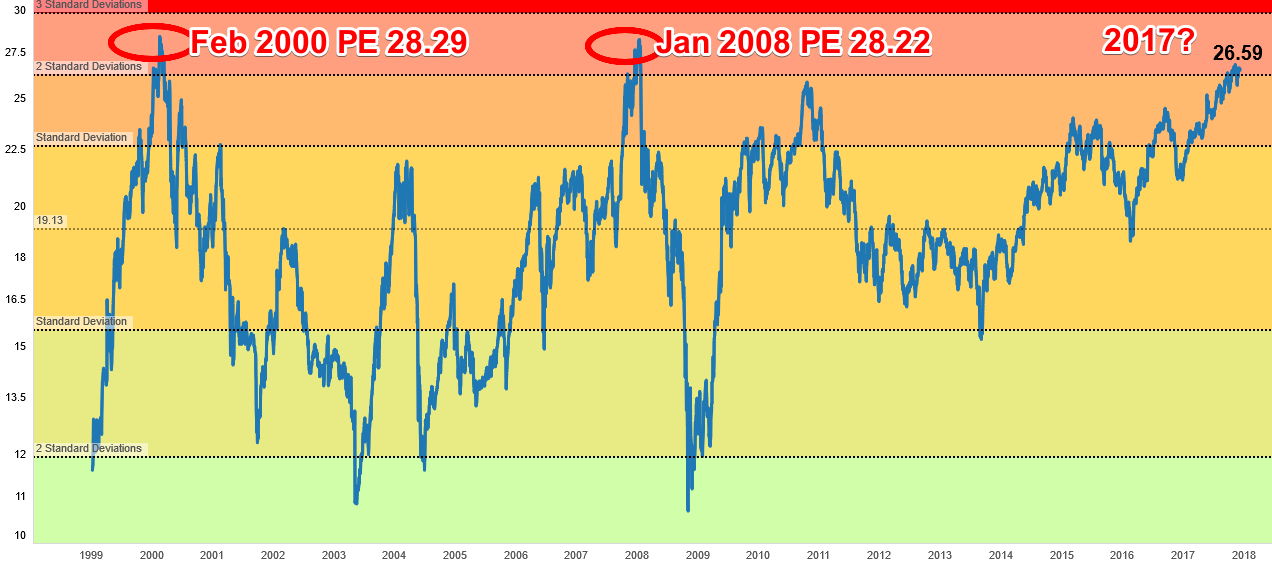
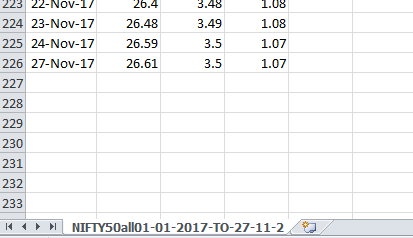
Nifty PE Ratio is coming near to 2000 & 2008 levels i.e 28~28.30 and that too near January. Will the market witness good correction or it will break all it’s records ? It will be very interesting to see how it goes once PE touches 28+.
Current Nifty P/E is lower than what’s reported. Please check this post by @diffsoft. The current P/E is 22.91 and not 26.59 and that makes a big, big difference even though its still high.
DII or FII sell/buy everyday even when market falls or rises. They do start accumulating cash when the market valuations gets too high, in NOV the % of cash in hand( of fund managers ) is highest since jan 2017 ( read few days back in a article somewhere).
And as you can see that the DII’s are now less aggressive in buying. I am not saying that market will witness correction or not. I am just giving you the stats.
( I have my own calculations and what I think is that market might touch 10800/10900 levels by Jan 2018, before it’s fall towards 8800/9000 levels.)
Hi @phreakv6 That is correct. The thing is, Nifty reports standalone and @diffsoft’s calculation is consolidated; but the data we use is standalone for the prior periods as well so it presents a true picture of standalone vs standalone.
If @diffsoft can provide the consolidated vs consolidated for 2000 and 2008 I suspect it will be similar to the consolidated calculation today, otherwise the comparison is not on the same data when we see 22.91 vs 26.59. Best.
Hi,
Would you please elaborate on your calculations and assumptions that nifty might touch 10800/10900 by Jan 2018. I have posted my views in another thread.
Hi Josephseby, by calculation here I mean the chart patterns. Nifty will face very strong resistance at 10800/900. And with such high valuations it would be difficult get past that, lets see how it goes.
In 2000 most of the earnings were from standalone and to a large extent in 2008 also. Large global subsidiaries like Airtel Africa, JLR, Pharma and FMCG and auto-ancillary acquisitions have happened in last 10 years.
You also need to consider normalized interest rate (10 year Gilt yield 7% currently). This was around 9% in 2008 and 11% in 2000. This is biggest variable. If stable inflation and interest rate regime continues. Normal 2018 PE should be 1.5 times 2000 PE.
Not much prediction (Technical Analysis) is required when one knows well enough to buy Index scrips only below Nifty PE 17, and sell above PE 22. This is very likely to beat the index and most mutual fund performances.
Do we have any source for shiller-PE for Indian markets… standalone pe is ~26, consolidated pe is ~23, I would say shiller-PE would be less ( Say around 20?) coz earnings haven’t grown as much as the inflation over the years…