Nifty PE crosses 24|A statistically informed entry-exit model!

Hey Nishant,

By combining P/B and Div Yield into one variable, you’re essentially getting the same inference with one variable.

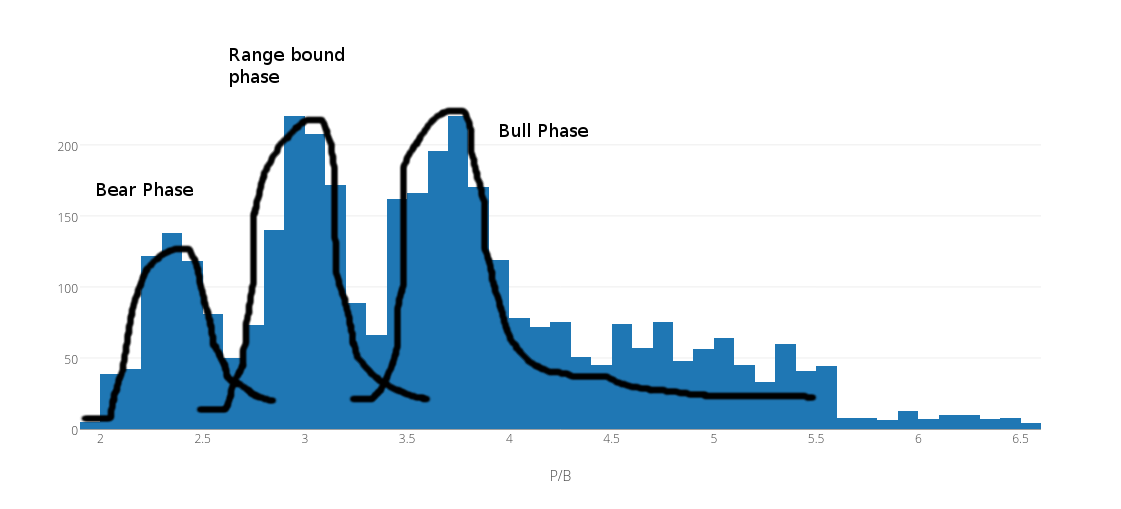
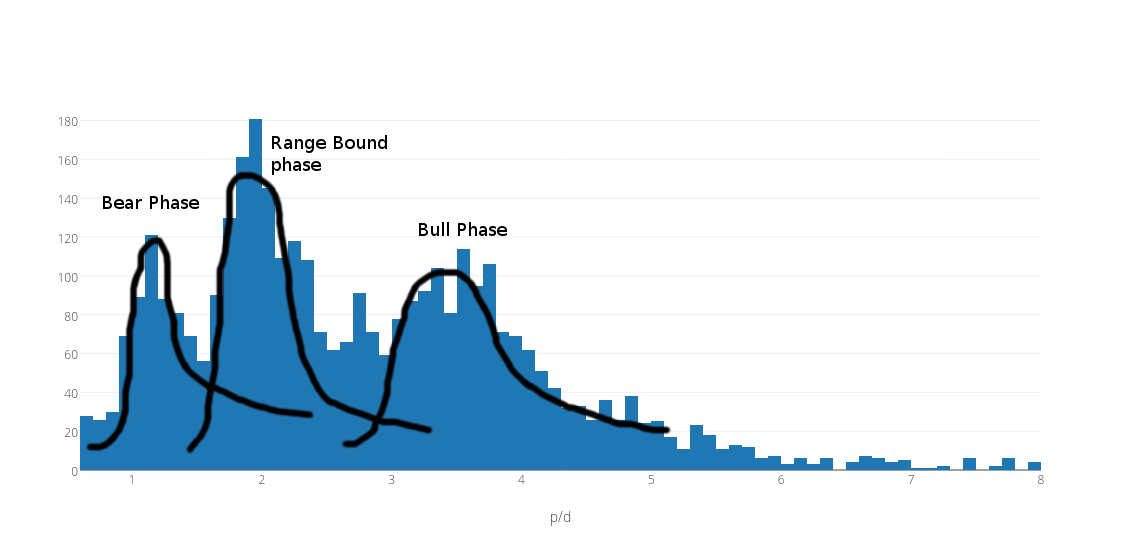
I think your first point about equities getting richly valued when this ratio goes over 4 seems correct.

But what’s your definition of backing out of stock market? Is it selling all your holdings?

Regarding point 2, not sure if you’ve checked but this ratio has been under 1 for probably 1-2 years out of the past 16 years. And it’s stayed under 2 for roughly around 4 years out of the 16. So I don’t agree with the 2nd inference as this is a very rare occurrence.

Also I’m not really sure about the 2nd point itself as most of us look to buy individual businesses. At any given point in time apart from extreme overvaluations, the market offers enough decent capital allocation opportunities without having to wait for point 2 to be true.

My only aim of this exercise was to understand when I should refrain from fresh allocation to equities and try to identify those times of extreme overvaluation. Thus, as per my inferences (my original post) when 1,2,3 is true, I believe all of the potential good opportunities in the market at that moment will also correct if not collapse with the other businesses. Plus, any market crash will also throw up multiple more opportunities to invest in.

However, this also doesn’t mean I’m trying to time the market as I believe no one can ever do that consistently for a long period of time. My investment aim is to buy good businesses for very long periods of time if not forever. Thus I want to try and make the optimal (read as roughly correct than precisely wrong) decision of when to buy.

Btw just on high valuations, a lot of quality mid-caps seem to be around that. I’d be very surprised if the mid-cap index outperforms the large-cap this year as well. Some quality large-caps are really begging for people’s attention at the moment.

Regarding the data source, you’re correct the only source for this is the NSE site and I’ve taken the data from there. That’s strange, I got no server restrictions when I downloaded it a few months back. I’ve downloaded the data for all the years and put it into a single spreadsheet. I’m not able to upload it from my iPad (Apple fail :expressionless:), will share it once I use my laptop or can email to you separately.

PS: Great reply to Satish’s query. Could not have worded it any better myself :ok_hand:

1 Like

No worries Gurjot. I got the data :relaxed: nifty 1999-2015.xls (188 KB)

Backing out of stock market was meant to sell all the holdings. Ideally at such rich valuation times, everyone should keep holding their existing investments, not deploy extra cash into the market and wait for the earnings/dividend yield to catch up. However, the investors mob don’t usually follow this advice when such times come. There is an atmosphere of extreme euphoria and a tendency to further skew those ratios until the market can’t anymore handle such ever increasing stress, eventually leading to its sudden break down. Then extreme pessimism creeps in like those two years (2002-2003 I reckon) you mentioned when my proposed ratio was even below 1.

Btw, meanwhile I did some more analysis:


The above is the distribution of Price to book ratio of nifty from 1999-2013. The Y axis represent the number of days the given ratio value was maintained. X axis represents the ratio value itself.
You can infer 3 underlying distribution with a fat tail on right end of each distribution. Currently it seems we are in the “range bound” phase. (And hopefully switch to Bull Phase soon :yum: )

The above graph is for my proposed ratio (price/book)/(dividend yield) which tries to capture both dividend yield and price/book ratio into a single ratio. If you see it is pretty similar to earlier graph with fatter right end tails.

Regards,
Nishant

PS: I do realize that mid cap seems highly valued. Strangely I was eyeing to include more quantity of Midcap stocks like AIA engineering, P I Industries and Torrent pharma into my 5-10 year term portfolio this year at attractive levels. I am just waiting for my proposed ratio to go below 1.75 (if at all nifty wants to go in that direction!)

PPS(Disclaimer) : Currently Invested in Torrent pharma and AIA from the above mentioned stocks.

Hey Nishant,

I agree with your intention/objective but not with the points for biases, you are correct , there is no point looking deeper if something works out well. I misunderstood the objective, I thought the idea was to discuss further and look into second order and third order effects so that it can greatly benefit everyone.I thought we will delve deeper to understand in special cases where it can mislead you and all.

Anyways, lets stick to P/E. P/B and dividend yield but somehow when I was writing the previous post I always felt it is always better to look at the truth then get agreed on something we knew a kind of confirmation bias.

Satish. No one is discouraging anyone to bring something new, revealing and useful to the table. Perhaps, you could create a separate thread and we could take the discussion forward there. I would be interested in knowing how each of the 3 points you mentioned is true. Perhaps you could elaborate it in detail there. Or you could message me :relaxed:
It friggin hard to look at the truth which is so latent in nature especially in the stock market. Hence the use of these 3 easy to understand metrics (more like vantage points) which I personally find quite powerful. But if you have a better vantage point or a new set of vantage points to find the truth, then that would be awesome.
I am myself trying to figure out the special cases where this simplistic model would break. if you know those special cases I would be more than happy to know!
Cheers.

Hi Krishnaraj.

This may sound like a very basic question, but does dividend yield too needs refinement when accounting for consolidated earnings?
(My guess is that irrespective of standalone or consolidated, nifty’s dividend yield should stay the same.)

Warmest regards,
Nishant

No, dividend yield is dividend paid divided by price. Earnings (standalone or consolidated) does not enter the equation.

Warm regards,

1 Like

Thank you. Is there any impact on the book value, between standalone vs consolidated? I am asking this because many people (including me), also consider price to book value as a parameter to judge the valuation of the nifty index.

I am not sure I got your question. The book value (SA or Consolidated) will come down to the extent of dividend and DDT paid.

Yes @nishantkandoi, the book value of the company would be different for standalone vs consolidated statements. Should always take the consolidated book value of the company when doing any kind of valuation.

2 Likes

Thanks @gurjota. Do you have any idea whether screener.in gives us consolidated or standalone book value?

I am just sharing the logarithmic value of sensex in dollar terms from 1979-2016 on monthly basis.
The exchange rates are prone to error as I have manually collected it from rbi website.
This is just to give a visual view.
Sometimes, its better to look at the graph directly rather than build models.
Cheers.
https://docs.google.com/spreadsheets/d/1rJKA_P2wKpuTcrHr9FVhhTD7stp41NmHTzXPntThJro/pubchart?oid=879298565&format=interactive

2 Likes

I m investing in ICICI Dynamic Fund since 1.5 years reason is i believe in the PE ratios but investors rarely see them. Last Year it was during March the PE picked out at 24 PE that is for Nifty. So around that time i exited the markets completely but you know their is only one thing Permanent in this Universe that is CHANGE. Yes Change after getting out of the market i m setting on Cash since a year or more which is painful i m waiting for the right PE. that is 16 to 19 one can get more info on this as explained wonderfully by Kalpen Parekh of IDFCMF on their website.

Good. Although market was near trailing pe of ~17 during February end. maybe you are looking at standalone PE, not consolidated PE .

Hi Tejas.
You would be definitely safe and make decent money with such dynamic approach.
The only thing is that you would miss out on bull market phase riding on winner stocks. Market heavily rewards the good stocks during that phase. Also there would be a lot of time when market would stay between 18-22 PE (standalone). If you follow such strict approach, you would not be able to invest at many occasions when it would be still fertile to make money.
I have myself been working on (and would continue to work on) building sophisticated sensex index models as a hobby. The more I work on this, the more I am getting convinced that stocks which show solid earnings will be the best stocks to hang on to in bear, bull and neutral phases.

Best regards.

4 Likes

Just wanted to check Nifty 500 on the same measure of valuation as has been discussed on this thread.

  1. Nifty 500 is a broader measure of the market as compared to Nifty 50
  2. Nifty 500 would be less impacted by the standalone v/s consolidated debate

https://www.nseindia.com/products/content/equities/indices/historical_pepb.htm
Date >> 25-Jul-2016
PE >> 27.14
PB >> 3.04
Yield >> 1.22

Derived ROE = PB/PE = 11.2%

Seems to me the market is overpriced based on Nifty 500 data.

Note : From Exchange website

  1. The total traded value of Nifty 50 index constituents for the last six months ending March 2016 is approximately 46% of the traded value of all stocks on the NSE.
  2. The total traded value for the last six months ending March 2016, of all Index constituents is approximately 87% of the traded value of all stocks on NSE. (Nifty 500)

NIFTY PE has crossed 24 level again. This has been a sharp rally, from 19 PE in Feb to 24 PE in September.

Is it time to stop making fresh investments? I certainly think so, unless one can find a highly undervalued company with good fundamentals.

What do others think? Has market reached over-valuation stage?

Would like to know, since I am considering reducing positions in some ETF’s that are part of my portfolio.

4 Likes

Yes- Its overvalued. Past 7.5 year nifty PE chart indicates that everytime it crosses 24 PE, Significant correction is in offing. Though Sep-Nov is a bullish month and market liquidity is pretty high, This is the level where profits needs to be taken for it to snap back.Disc-100% invested and will start moving out of profitable trades. Fed Hike may be the snap back event.

There are many events like Surprise FED Hike in Sept instead of expected Dec… Bad news from China… Oil breaking last month low of $39… Failure or Default of stressed Italian Banks…

On local front it can be weak monsoon in Sept bcoz of La Nina Effect over far early, Thats why more than average monsoon instead of surplus… Weak PSU and BHEL earnings… Already GDP has slipped from 7.7 to 7.1… High inflation than expected will result in delayed rate cut…

There are many factors…

1 Like

But just because of excess liquidity, i expect nifty to reach 8990 to 9110 before next significant down wave starts… for nifty to reach new highs, it should cross previous 2015 high of 9119 and then 9350…

i expect a major downwave in 2017… mother of all bear runs in 2017… maybe 6400 and if any major financial crisis then till 4800.

I have a small question…

Rakesh Jhunjhunwala says that we are on the cusp of a mega bull rally which will even dwarf even the bull rub of 2003-2008…

Can we objectively compare the Nifty p/ e if late 2002 or early 2003 with the present p/e? What if he is correct?

1 Like