Hi
On sept 18th despite nifty gaining 67 pts there was only a very slight accumulation. Nifty 500 gained 60 points and there was slight distribution happening. I feel this type of rally, if happens continuously is a matter of worry especially at higher valuation levels.
A lot of people are super bullish as they expect a lot of domestic money is going to come into equities via mutual funds and SIPs. That may be true also. But the fresh money coming to MFs and SIPs may be due to herd mentality. Even though FIIs are continuously selling, the global liquidity flow is still intact. that is why all global markets are in risk ON rally. So if any tightness in global liquidity happens there will be a risk OFF sale in global markets and India will not be immune to that. All the money which has freshly came to the markets via MFs and to some extend SIPs may leave the markets. Super bullish people says that the MFs and SIPs has taken the role of FIIs who controlled the markets in earlier bull markets. This may be correct to some extend. But I feel at the end, the role of retail investors (who bought at the top of previous bull markets and burnt hands in the subsequent bear markets) will now be played by MFs and SIPs. I feel this because the MFs and SIPs may be flooded with so much money, so that the portfolio managers will be finding it difficult not to buy in the overvalued zone.
So i feel it will be wise to be little cautious in the markets at this overvalued levels.
Hi All,
Here there is a blog post from stallion asset.Especially for those who says "this time its different"
I hope along with all that historical data, there was a monthly DII inflow historical chart.
I am seeing it other way… India is part of emerging market index, whatever happens in India will also affect EMI…Am I right or missing something?
Hi,
It can be seen in that angle also. Off course whatever happens in india will also affect EM index. But I dont feel that the weightage for India in MSCI Emerging Markets Index is huge enough to have such an effect. I may be wrong also.
Hi
Yes the weightage of India in the MSCI EM Index is not big. Have a look at this link below.
While India ranks among the top three in the emerging market basket in terms of GDP, it barely makes it into the top 15 in terms of index weight.
Also the August 2017 update on the MSCI India Index below.
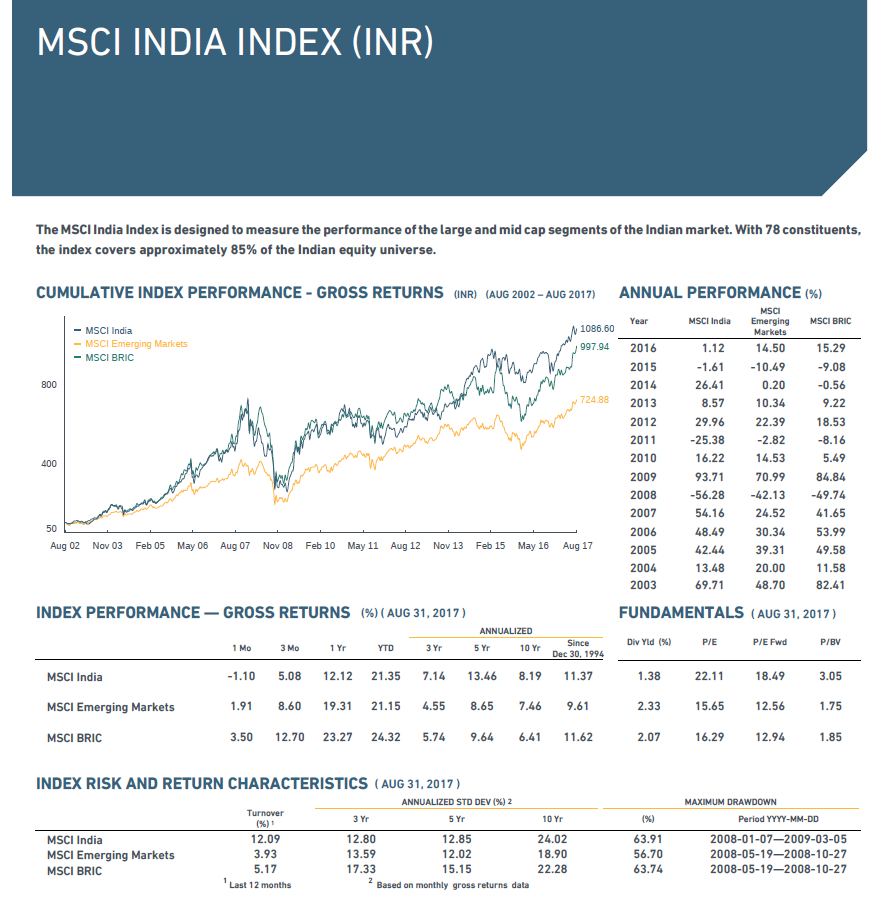
(please open to see clearly)
I think there is no doubt that our markets have run ahead and valuations are high. Be it the person wearing the bearish or the bullish hat they both will agree on this. Now its only the disagreement when the music is going to stop. All the best ![]()
Regards
Deepak
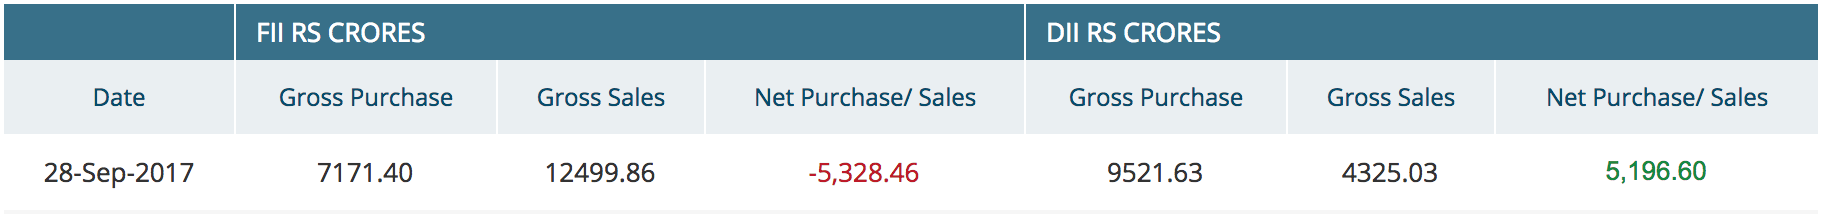
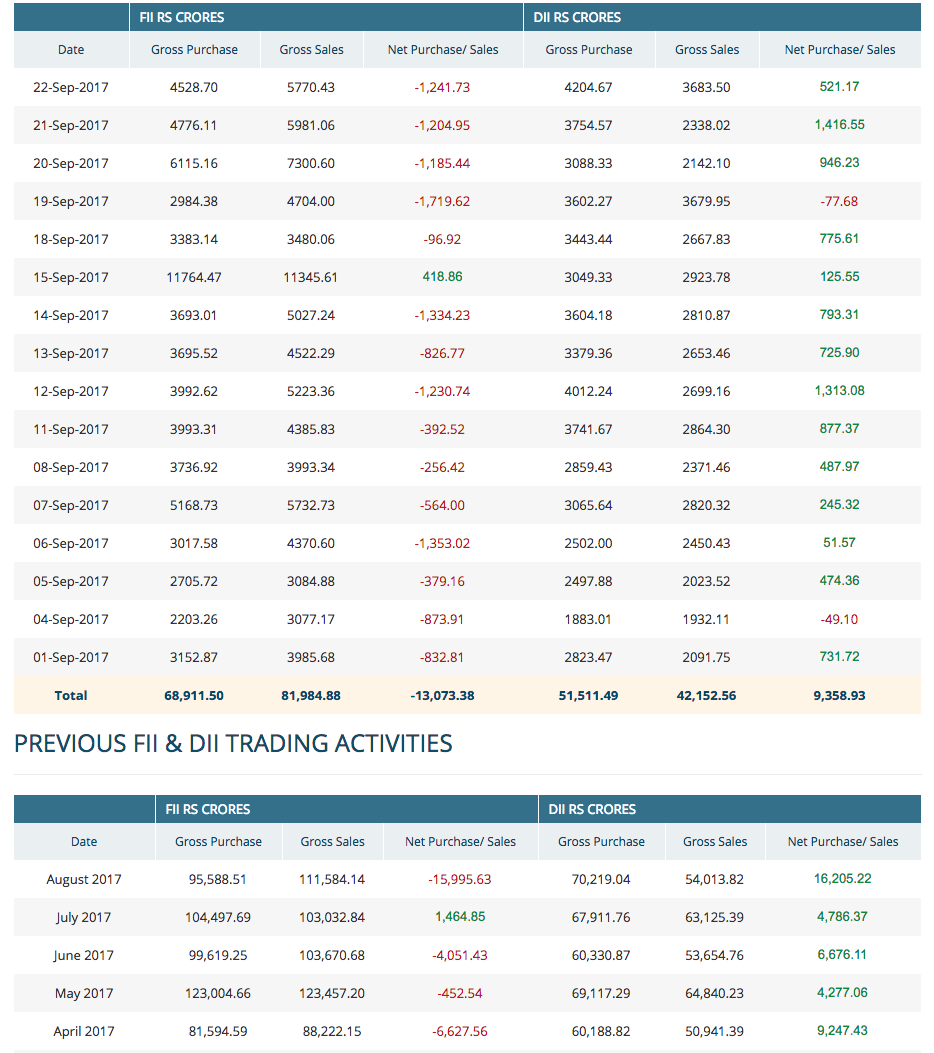
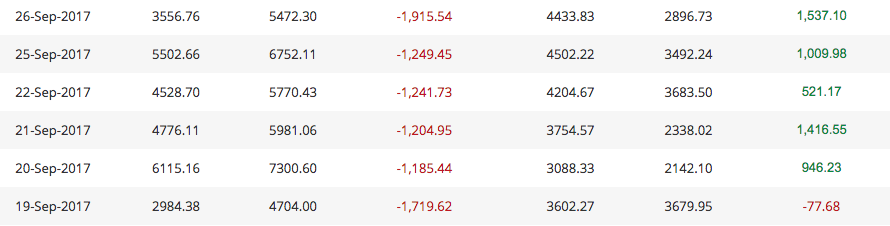
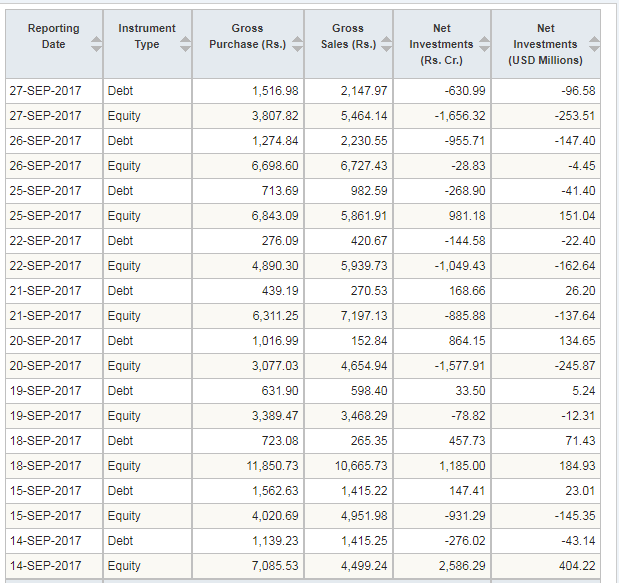
Is this the month where we run out of DII liquidity? Apr-Aug DIIs have done phenomenally to support but September aggregate now stands at 13k Crore FII selling vs 9.3k Crore DII buying. The difference between yesterday and today as well is quite apparent looking at the numbers. Not enough support today resulting in the bloodshed. Not sure if this is enough information to come to any sort of conclusions though since Sept 4,6,14,19 also had similar gaps.
Hi
RBI has released its Handbook on Indian Economy which is available on its website. Its a treasure trove of data for who enjoy such things.
Some of the data points can be picked up and plotted on to graphs. The results for some we empirically/theoretically already know.
Regards
Deepak
Hi @deevee
Could you provide your interpretation of the graphs plotted? Assume you are explaining these charts to a 10 standard kid eager to learn
Best
Bheeshma
Hi
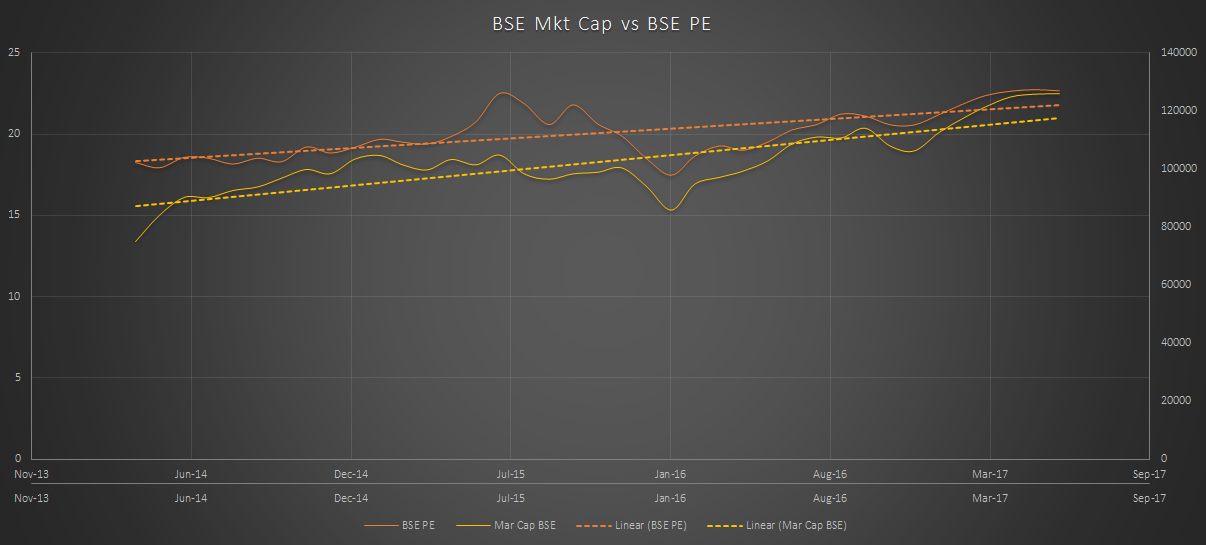
Trying to put one line for each. Focusing on the trend lines.
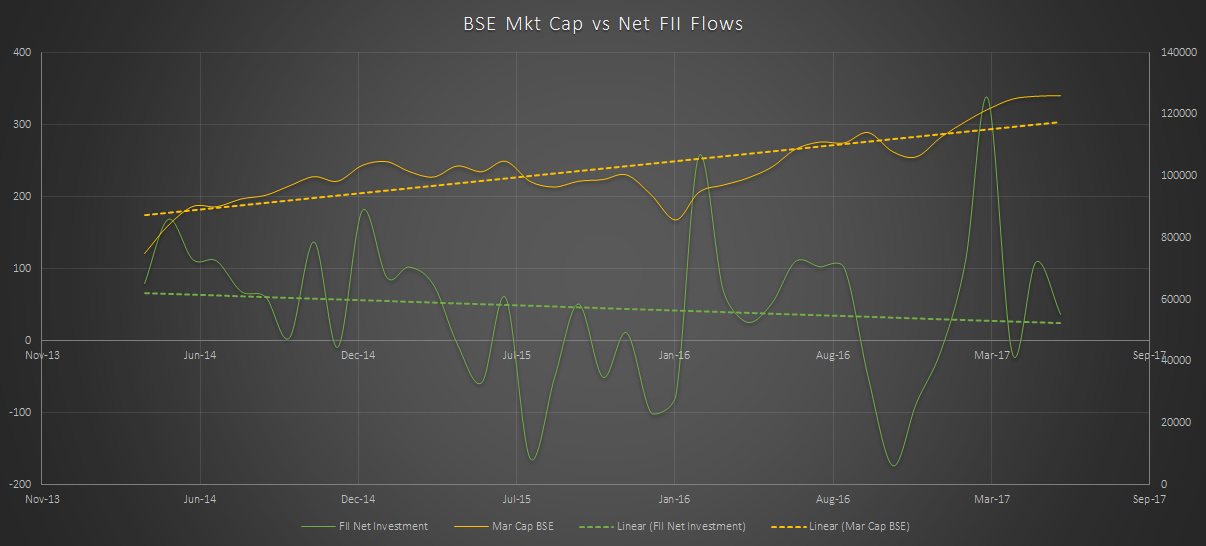
- FII flows is slightly falling but the mkt cap of bse is increasing. We can conjecture that we are getting decoupled from fii flows to a certain limited extent and that domestic flows are supporting the market cap growth
- Mkt cap vs pe: The slope of mkt cap is steeper than pe meaning we are running ahead of valuations which we already know
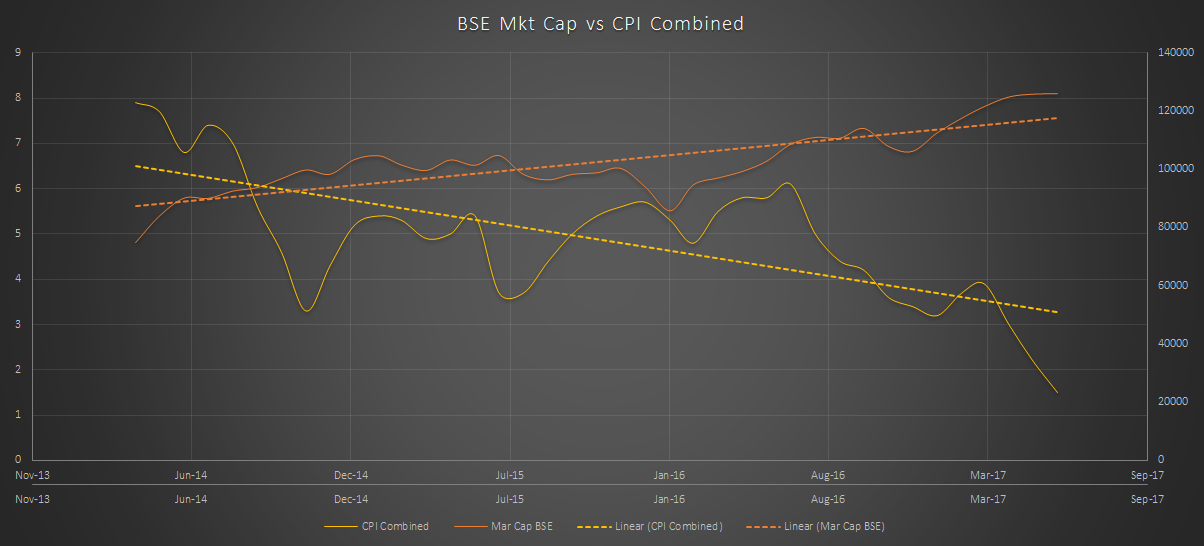
- Mkt cap vs inflation: inversely proportional as expected per theory
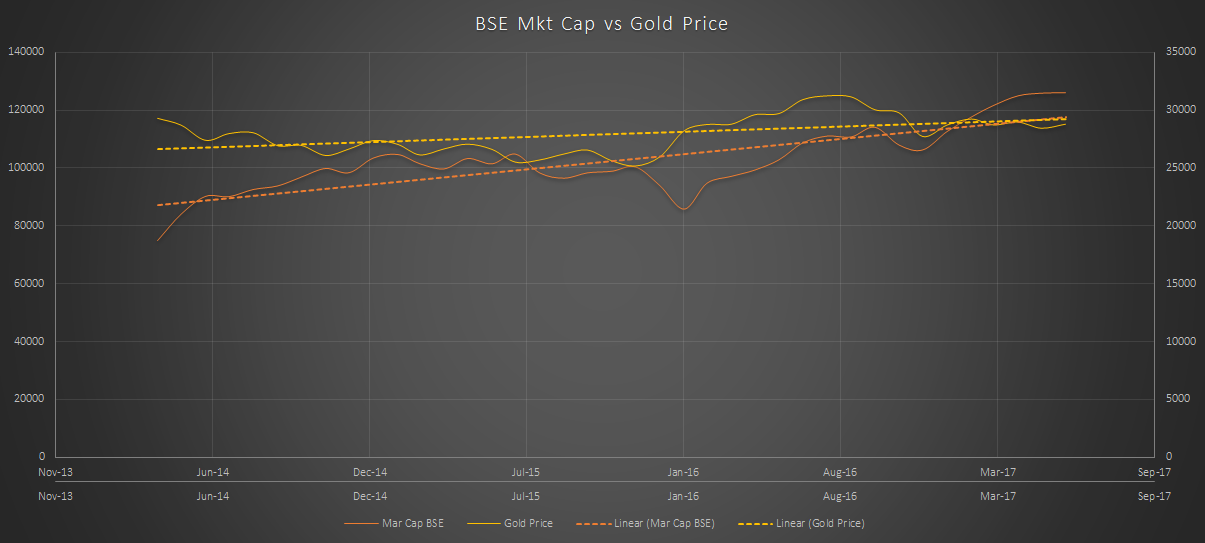
- Mktcap vs gold price: should have been a little more similar to the behavior of gold but its much subdued in terms of inverse relationship
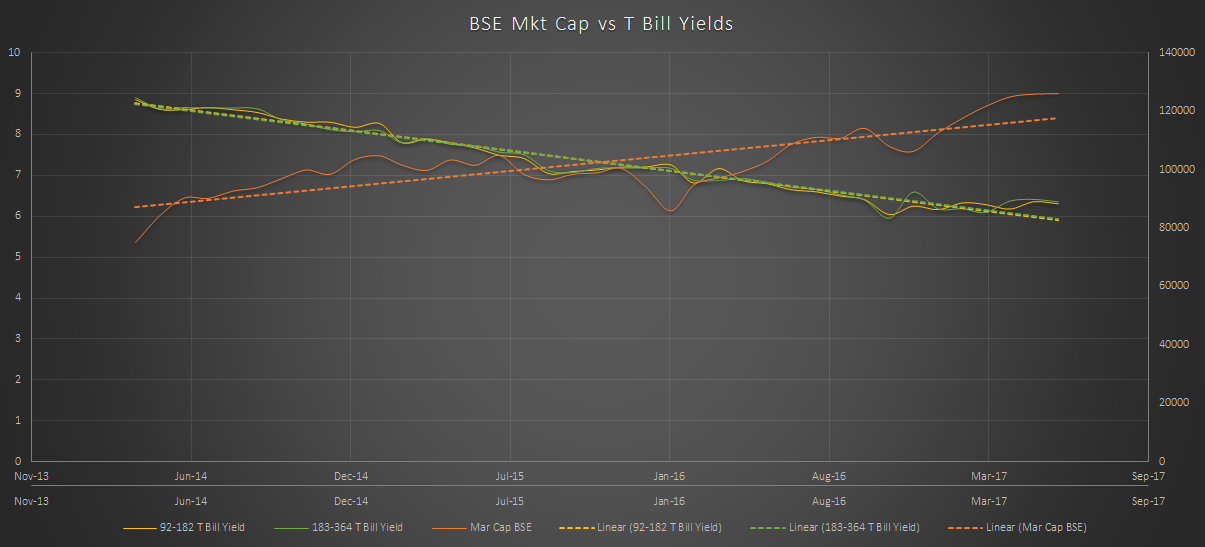
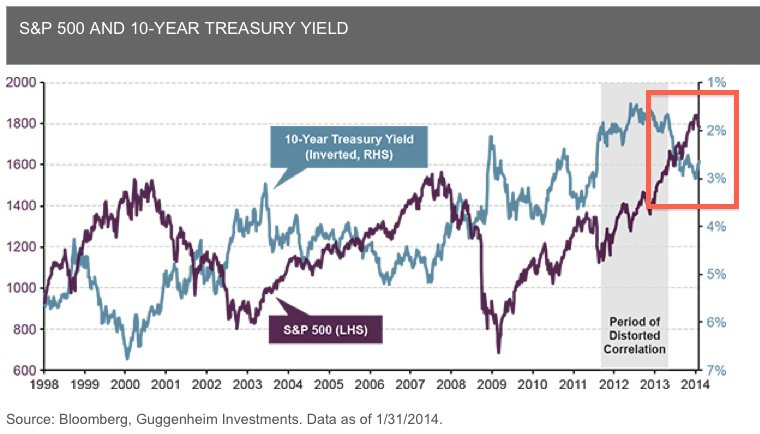
- Mkt cap vs bond yields: inverse relationship as per graph but as per theory as yields rise usually stock prices rise (bond prices are directly proportional to stock prices, bond yields are inversely proportional to bond prices). this is usual though where we get distorted correlations. have a look at the graph below for s&p 500 and 10yr. Also these are only bills up to 1 year in the RBI graph. It would have been better if I had the data for longer term bonds. These relationships are key signals that is what my fixed income friends tell me.
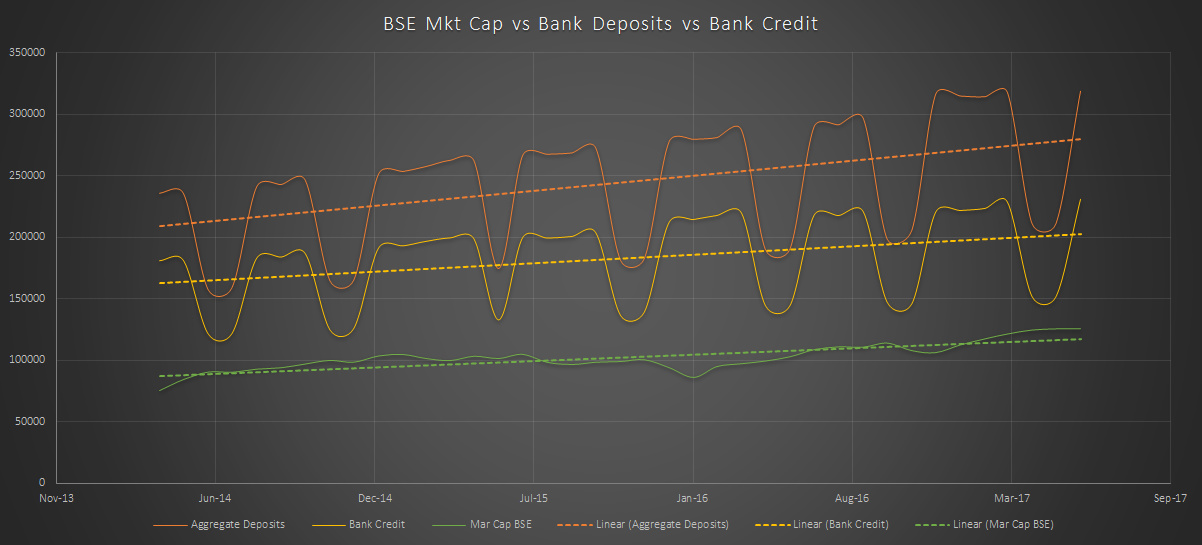
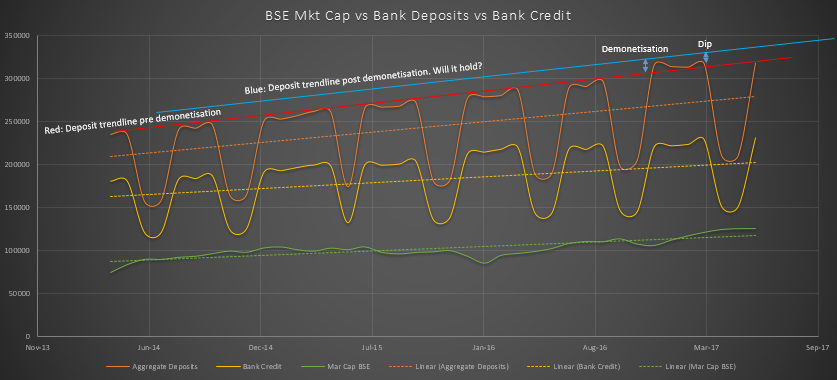
- Most interesting for me is the deposit graph. Pasting again with trendlines. We see the effect of demonetization and then the waning of the effect also. The valleys and plateaus are because of quarter end variations which banks target ie get excess deposit base at quarter end which dips post that. graph below.
I hope I was able to communicate. Thanks.
Rgds
Deepak
bond prices are directly proportional to stock prices
If both Bonds and Stocks are competing for same capital, how can they move in unison?
If I buy the Bond rather than Equity, then I feel the company is risky - hence if the company goes belly up I would like to be paid first (safety of the bond market). Equity price should then be moving in the opposite direction, because I am last in line of payouts for the risk I carry - hence I should get a better (i.e lower) price.
Only in the case of an economic revival, after a downturn, where the central banks have held the interest low, so as to spur growth, the Bond and Stocks move in unison. The Bond rises because the interest rate is low; the Stock rises because growth is around the corner.
I believe that the graph in question is in proper order - the yields have been driven down, forcing people to draw out their Fixed Deposit / savings and pour it into risky assets i.e. the Stock. The companies are having it both ways now, ‘baking their cake and having it too’, with Stocks rising and them being able to borrow (even though they may be risky) at lower rates.
[This is my understanding; please do let us know if there is a different way Bond and Stocks are correlated in price movement, which I may have missed]
Generally there is no ‘general relationship’ between Bond and Stock prices, is my understanding.
Edit: It is for the reason, that companies are now able to borrow are low rates, Ambit’s management keep highlighting that rout will begin in the bond market - in India.
Hi
I did not want to hijack this thread to discuss the correlation between bond yields and stock prices. There was also a typo in my post which I have yet not corrected (not what you referred to though).
It is a very pertinent point you have actually put forth but it is generally held that bond yields are inversely related to stock prices, thus bond prices are directly correlated to stock prices. As you rightly pointed out that depending on various economic scenarios this correlation usually changes.
There was an academic paper by the Reserve Bank of Austraila on this. Pasting portions of the abstract below. The paper is called “A Century of Stock Bond Correlations” and is attached. I will re-read it now ![]()
Throughout much of the 20th century, the correlation between equity prices and government bond yields in the United States and other countries, including Australia, fluctuated but tended to be negative. However, stock-bond yield correlations have been largely positive since the late 1990s, rose strongly during the global financial crisis and have since remained at a high level for a prolonged period.
Also the legend Robert Schiller had studied determinants of variability of stock market prices. In his paper he tries to find the attribution of stock prices variability to information related to real interest rates (thus related to bond prices). His paper concludes, as per my interpretation, that he cannot find such a correlation.
So honestly with whatever little I have read I actually cannot confidently say what the exact mathematical relationship between yields and equity prices is. Apologies.
I did not know Ambit had highlighted this.
I think there should be a thread for all the gyaan from the experts on the forum so that we guys can learn.
so many things to learn, so little time ![]()
Regards
Deepak
RBA_bond_yields_vs_equity_prices.pdf (449.9 KB)
Schiller’s paper here and here (I don’t have a decent copy as it needs to be purchased I think).
That’s 6 trading sessions in a row of serious volumes of FII selling. We have even crossed August’s net selling number already this month. Even the way the selling is concentrated over short periods of time makes it look like they are more intent on inflicting a lot of damage than just profit booking.
Hi
This drawback of FIIs is going to continue it seems. President Trump has just now made announcements to release “very powerful” tax plans tomorrow.
He says “we want to bring back trillions of dollars of wealth parked overseas. we want this money invested right here in america”. He says atleast 2.5 trillion dollars will come “pouring” back.
Sounds like PM Modi 
Regards
Deepak
Hi Can you share the source of the information please.
I was looking at FII activity on ICICI direct and the numbers dont seem to the same (they should be, right ?)
Here it is -http://www.moneycontrol.com/stocks/marketstats/fii_dii_activity/?classic=true
Could you share the figures you have to make a comparison?
Thank you for sharing this. I did some digging up and found that your data is accurate. The moneycontrol data used earlier is provisional.
However in your data the Equity component of FII transactions have sale on the stock exchanges and the primary markets (pre-IPO anchor investments, FII subscription to the relevant IPO portion etc). You would need to remove that, but that wont change the numbers dramatically.
The underlying source for the official FII transactions can be found here - FII transactions
But the underlying conclusion that FIIs are on a selling spree is unchanged. They were net sellers in 17 out of 19 trading days this month.
Cheers,
Why have FII turned sellers? Will this trend continue for many months? and How much will they sell?
are the key questions, we need to understand to guess where the market will be in 12 to 24 months.
Why have FII turned sellers?
- Profit Booking
- Expected return (growth) for next 12 month not good (high P/E)
- Indian Economy might take another 12 to 24 months before moving up.
(FY18Q2 will be bad - my guess) - It might average a growth of 5 to 6% or less. - Rupee depreciation
- CAD (Current Account Deficit) outlook is getting bad
- Repatriation of funds to US to take advantage of new tax law (??)
- Geo political tensions
- Expected correction in US and EURO market.
I don’t know how long this selling will continue? or how much fund will be departed.
Looking forward to others views as well.