NIFTY and Gold ETFs momentum investing
Recently there has been a lot of talk about Momentum based ETF rotation strategies. I have gone through some of the strategies and was awestruck by the amount of returns these strategies claimed to be making. One such example is this article:
This book also talks about momentum investing with backtest going back upto 30+ years.
Dual-Momentum-Investing By Gary Antonacci
I decided to try out a simple momentum strategy on the Indian markets. I don’t think we have globally diversified ETFs in india as yet but we do have NIFTYBEES and GOLDBEES. These two ETFs are not positively correlated so I decided to use these for my analysis.
The Strategy:
The strategy is really simple. Here are the rules:
- At the start of every week, check the 30-week rate of change of NIFTYBEES and GOLDBEES.
- If none of the ETFs are returning more than 3% in 6 months. Do nothing.
- If one or both ETFs are returning more than 3%, invest your entire position in that ETF.
That’s it. I don’t think it can get any simpler than that!
The Results:
I don’t have a lot of historical data to test this with as GOLDBEES was only introduced around 2007. Keeping that in mind, the period that I tested was from 2005 – 2015
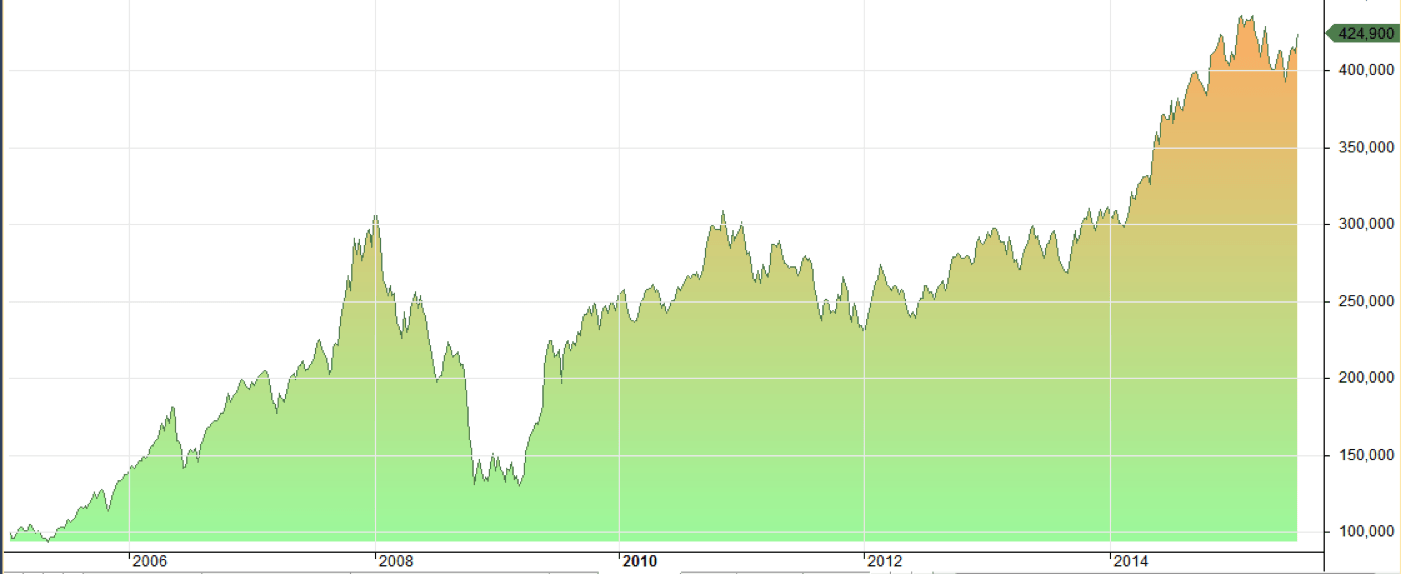
First lets have a look at the returns generated by investing only in NIFTYBEES
- NIFTYBEES
Period 1/1/2005 – 21/7/2015
Initial Capital 100000.00
Ending Capital 424899.97
Net Profit 324899.97
Annual Return 14.73%
Max Drawdown -57.92 %
Although the returns have been decent at 14.73, the maximum drawdown is really scary at -57.92. If we have another sustained Bear market and the returns will suffer badly.
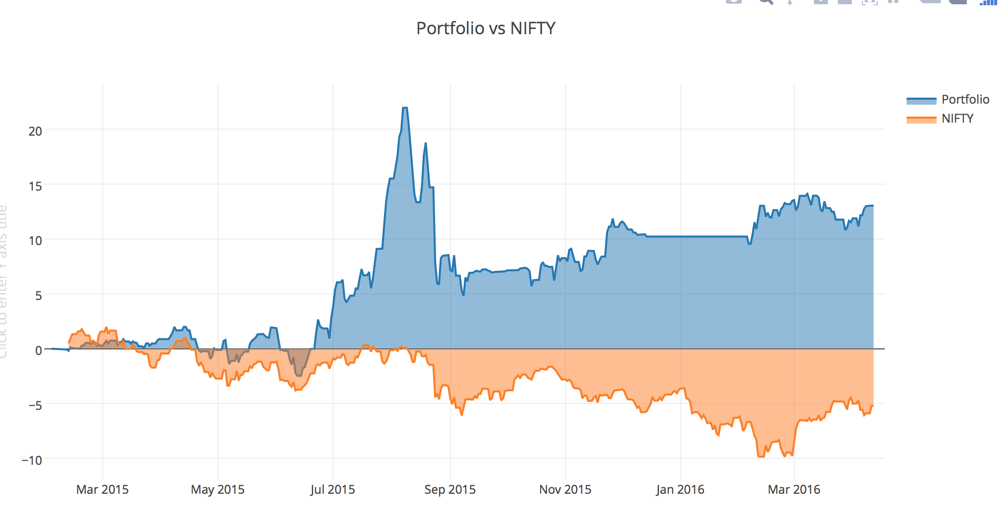
Lets have a look at the equity curve
As you can see, Equity declined more than 50% during the GFC in 2008. It took more than 4 years to make up for the losses and go back to the equity level before the GFC.
Now lets have a look at the returns made by the momentum rotation strategy
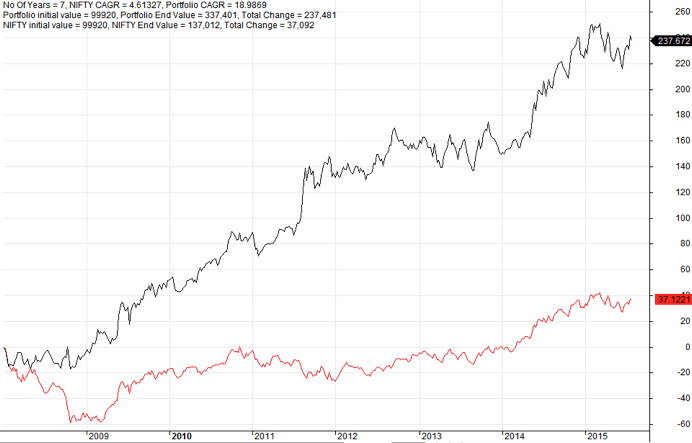
- NIFTYBEES + GOLDBEES Momentum
Period 1/1/2005 – 21/7/2015
Initial Capital 100000.00
Ending Capital 1067835.31
Net Profit 967835.31
Annual Return 25.22%
Max Drawdown 21.96 %
As you can see, the returns are amazing. It’s a no contest between buying and holding NIFTYBEES and Momentum rotation. Lets have a look at the equity curve.
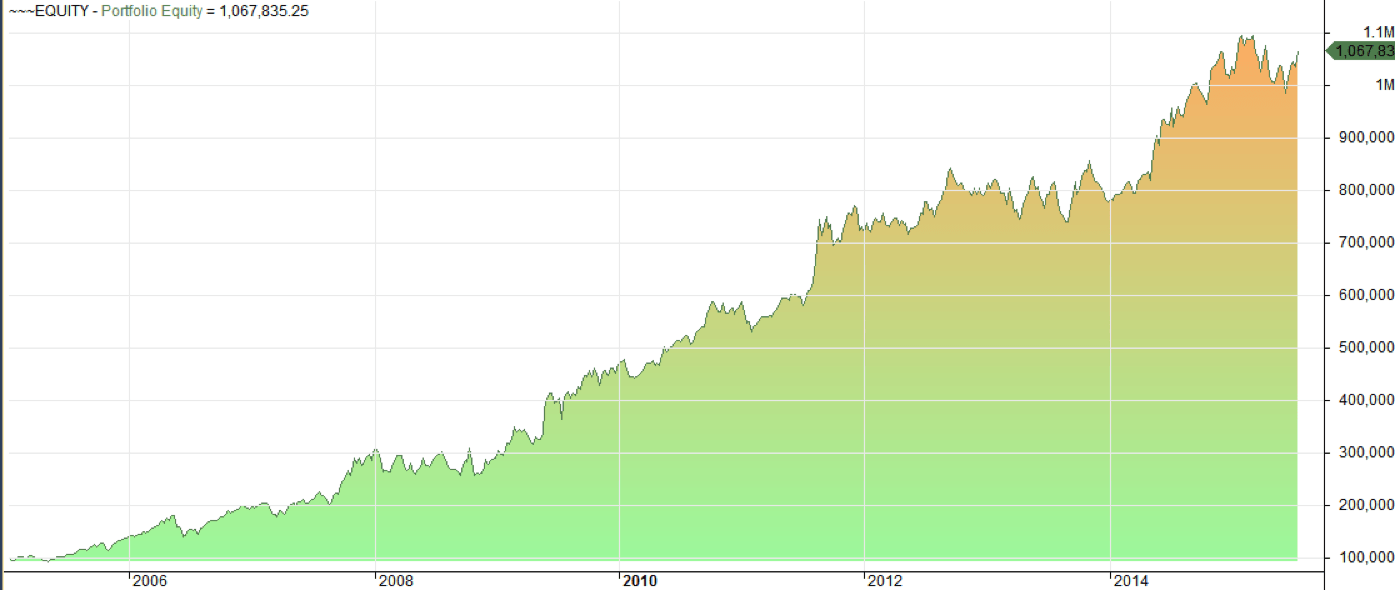
To me, it looks like the only reason why this strategy has performed so much better than NIFTY is because it has the ability to resist severe drawdowns. The equity curve shows that there have been no real drawdown and the ride has been really consistent.
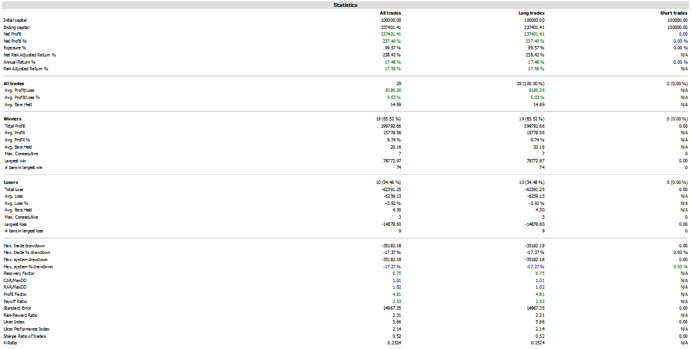
Lets overlay both the curves on one to understand why the strategy works.
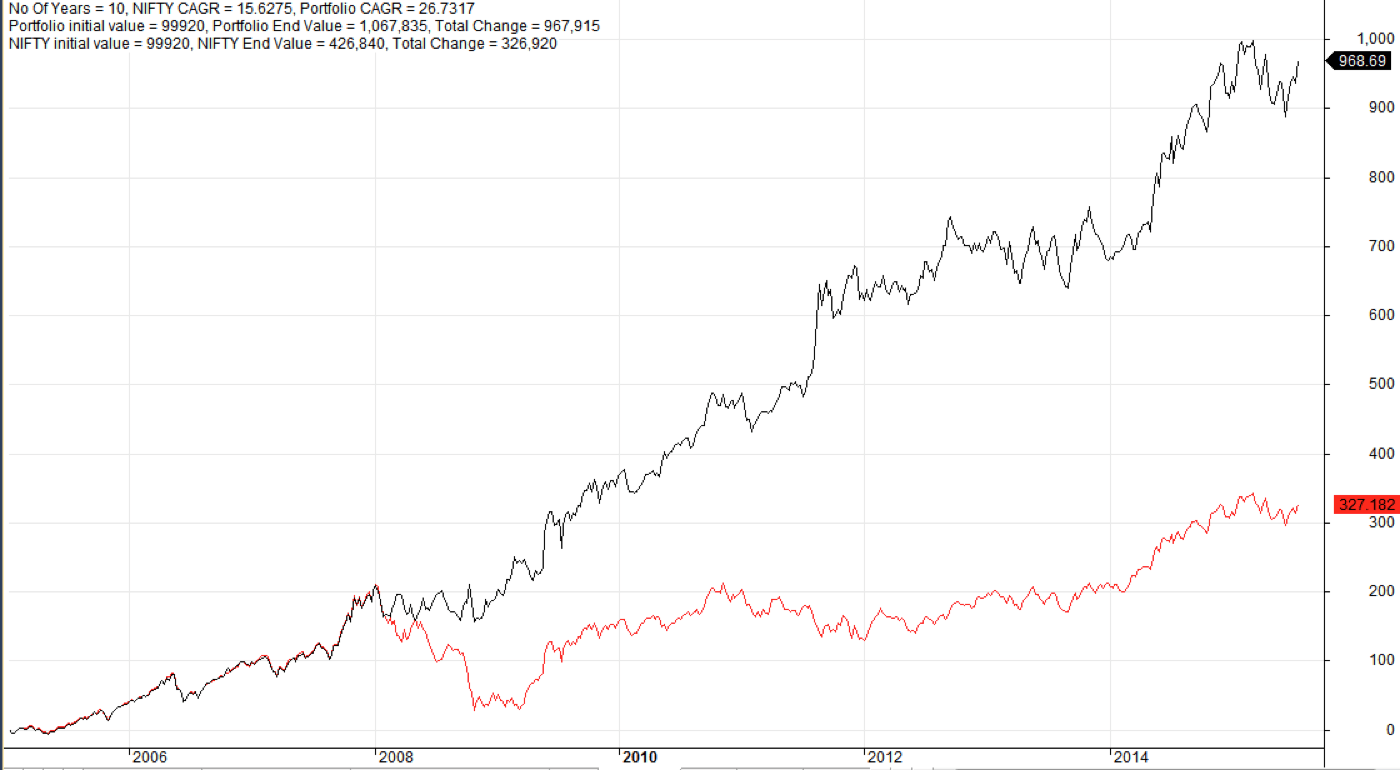
This proves my previous point. The only reason this strategy has worked so well is because it has avoided the bear markets. In fact up until 2008, both the strategies were generating the same returns.
Lets have a look at the 6 month rate of change for Gold and NIFTY

This indicator plots the NIFTY and GOLD ROC on the same chart. The green and Red histogram marks NIFTYs Rate of change and the Gold and grey line marks GOLDs rate of change. The blue line is the fixed 3% return that we can get from our banks or from LIQUIDBEES. This shows that whenever the Equity market has declined, investors have flocked towards gold and it has seen significant advances.
BTW. According to the strategy, the current outlook shows that we should sit tight and invest our money in LIQUIDBEES or Banks as both NIFTY and GOLD have been returning less than 3% on a half yearly basis.
I am sure this strategy can be taken as a Macro indicator on the general market direction. E.g. Instead of investing in NIFTYBEES, we can invest in winning stocks based on our fundamental research and recent momentum.
Please let me know if there is something I have missed in my analysis. I shared this because the results look too good to be true and I want to know the point of view of the experts.
Here is the amibroker afl code required to backtest this strategy. Backtest this on a watchlist containing only NIFTYBEES and GOLDBEES symbols on a weekly timeframe.
SetOption(“InitialEquity”,100000);
EnableRotationalTrading();
SetOption(“WorstRankHeld”,1);
SetOption(“MaxOpenPositions”,1);
returns = ROC(C,30);
PositionSize = -100; // invest 100% of equity in single security
PositionScore = returns+1000;
PositionScore = IIf(returns > 3,returns + 1000,scoreNoRotate);
Disclosure : I am very new to investing and I am not following this strategy(yet).