Is my argument about 1x being applicable of India sane?
When the free float percentage is lower does this factor fundamentally change? On first thoughts it should not be I am still a bit confused about it.
How can one collect highly accurate data on total private company revenue vs public company revenue? Currently I am using the data from the MCA website on paid up capital.
Do small firm profits count as corporate profits or do they count as employee compensation?
As always macro factors can only indicate very broad trends. Value investing in my opinion should only be done with Individual stocks. The places where it becomes tough to take decisions one way or the other is where macro factors can be useful.
BTW: I tried to find an appropriate thread for this but was unable to find it.
Would gross profit be a rough way of understanding GDP? So, is market cap to GDP approximately capturing the PE of the market?
In a developing country like India, how much of economic activity is captured by listed/unlisted companies that report to the MCA? Can we use tax/GDP ratio for adjusting your analysis to make it more relevant?
I don’t know enough to answer your question, but hope to follow your discussion. Can you simplify your language a little for non-financial type people?
For completeness, is this the data you are referring to? MCA Paid-up Capital
I guess 1 word is enough to tell you what is the thing you seem to miss “Future”. All you said is true of the past, but people are not buying Indian past, they are peeping into the future and the growth propelled by modern day tinsel’s that are easily being imbibed into India. I guess thats giving lead indicators a bit of cushion or fat, but that will be trimmed down from time to time by EPS on them acting like muscle…
Investing is an Art of foreseeing(not predicting) the future not understanding the past, thats the librarians duty.
On Seeing the future, according to Ray Dalio and Gurufocus have given a positive review about India. According to Gurufocus and its data, India is likely to give a return of 15.3% return.
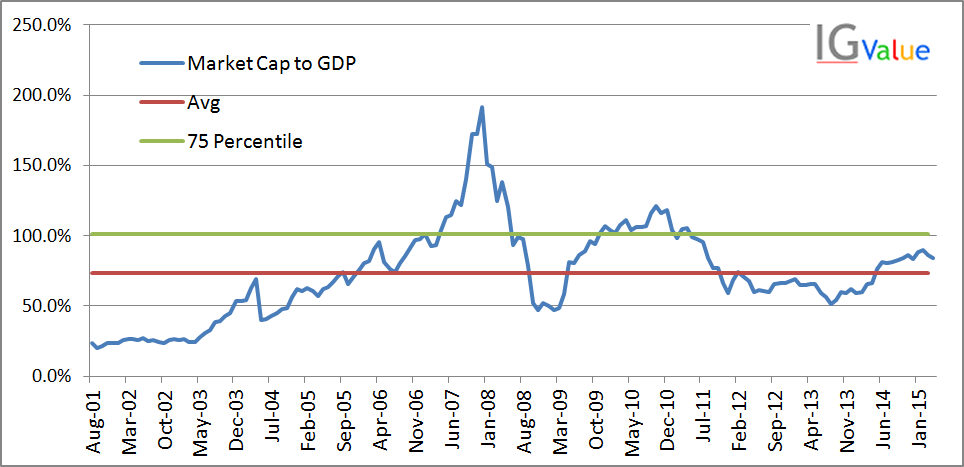
On the Overvaluation, ratio of Mkt Cap to GDP is at 73% which is below the mean of 80%. Historically it has been at 165%, that is just before 2008 collapse. More info can be gleaned here.
For those Curious on understanding what Ray Dalio does and why I have cited him, please refer to this very informative site. http://www.economicprinciples.org/
The GDP data is available only upto Q3 2016-2017, so need to wait but one can already see how stretched valuations are. I dont know what the thresholds are bu it certainly looks like if the market cap is 90% or more its time to be cautious.
Views invited.
Disc - biased - have a negative view of the market
Bheeshma, I had a quick question here. How does this ratio get adjusted as more and more unlisted players start getting listed? How does market cap of unlisted players get captured?
I have no clue. I dont think unlisted players have a market cap.
Just take whatever are the latest gdp numbers put out by the rbi or sebi and compare with the market nos put up by bse or nse on the date of the gdp nos.
The idea is to get a rough sense of the steam left in the market. Judging by the overlay of the mcap gdp ratio it seems to portend some pain ahead. Only time will tell of course. Nonetheless a rough guide is useful even if not completely accurate.
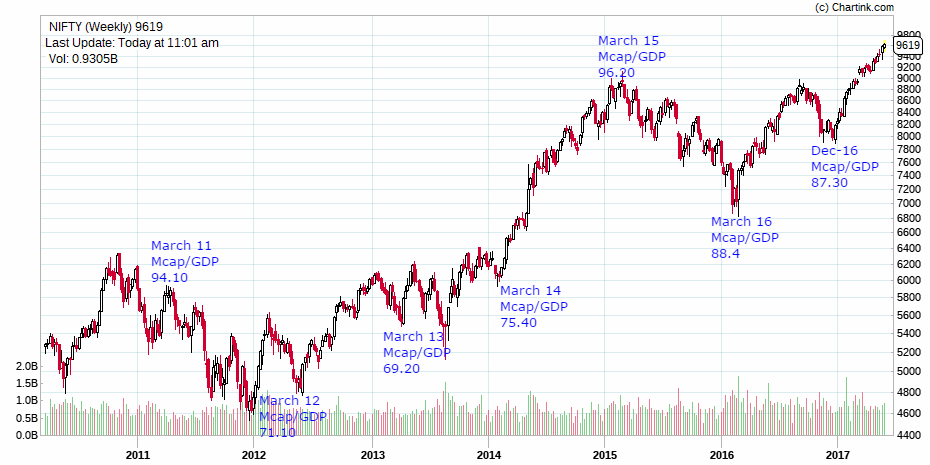
With the FY 17 GDP (at current prices) at ~ 152 lakh crores (FY 17 GDP) and MCap at ~ 127 lakh crores (MCap on 02 June 2017) the MCap to GDP is at 83.55%.
So one may say the ratio has come down from Dec 16.
Some notes:
Overall, MCap has grown faster than earnings (as seen in the other posts on Nifty PE), which means that corporate profts to GDP will have slid lower than in FY16, which was at its lowest post 2007.
GDP is a statistic, extended from a sample to the universe, while MCap is not, and to that extent this ratio will suffer from some biases.
GDP is the net value we have produced as a nation in a year (and so net consumption and savings). For corporates that measure will be their net profits. An increasing MCap to GDP roughly means (in my understanding and language) that our expectation of what value companies will produce relative to what the nation has produced is rising. This cannot go on increasing forever. Warren Buffett has put a caution at a ratio of 1, though recently in Sqawk box, he said theoretically if interest rates are zero, valuation should be infinity.
In India, we do not know what the equivalent of 1 is, but our corporate profits as %age of GDP is roughly 1/3rd of US. (recall from my old research and memory).
Addition of listed companies does bias the indicator, as nothing would have changed in the economy on just getting a firm listed, but over time the bias reduces as large firms get listed. For eg, TCS, Coal India, DLF (it was a biggie in 2007-8 era) made a material difference to the ratio, but now there aren’t too many unlisted firms that are larger than the large listed ones (can think of only LIC as a grand daddy moving the needle) So the indicator would have attained stability now.
The GDP and Market Cap were roughly the same as on March 17. These are dangerous and unsustainable levels and while the market has kept surprising us i think one must be vigilant and cautious.
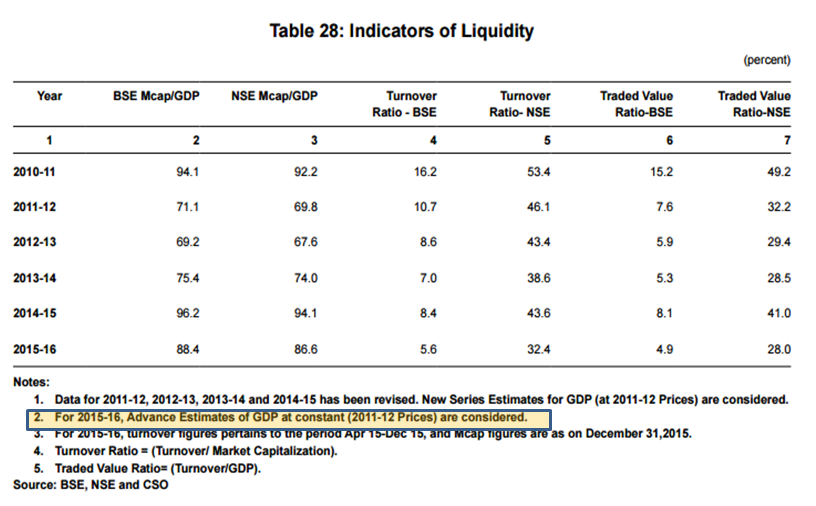
Govt uses both constant prices and current prices as may be seen from the link I posted earlier. That is the raw source of data (even RBI - the source you used, gets it from this source).
‘Constant prices’ adjust for inflation because the unit of value, which is rupees, always goes down by inflation and so it is necessary to adjust for this every time GDP is computed to know the real value of produce. The other price (which is current price) which has inflation embedded in it is called nominal value.
So as you will understand, when we compare Market Cap to GDP, both need to be of the same unit of measure, which is either nominal value or real value. I have taken nominal value for MCap and GDP (we get nominal value as well published by the Govt - as ‘current prices’).
Using nominal value for MCap and real value for GDP will inflate the MCap GDP ratio as one of them is adjusted for inflation and the other is not.
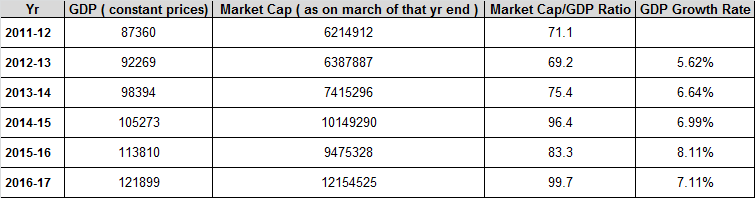
That is debatable. Not sure how you arrive at the conclusion that the Mcap is not adjusted for inflation but as far as i can tell inflation is an integral part of the interest rates. Interest rates play an integral role in influencing the market cap and it accounts for inflation in my opinion. SEBI certainly puts out inflation adjusted measures of GDP i.e Constant prices when they compute the market cap to gdp ratios. Also if you observe they match closely with my computations ( column 2 in the picture pasted)
’ Not sure how you arrive at the conclusion that the Mcap is not adjusted for inflation’
Market Cap today is measured at today’s stock price, GDP at constant prices is measured based on the price of base year. So we will be comparing today’s rupee with 2012 rupee (for that base year).