
Hi,
This post is not related to elliot wave principles
Technical analysis says even though History never repeats it rhymes
I think some Investors are in the camp who compares the present high valuation situation (nearly 27 X PE) with the situation at 2008 bull market top and are fearing a crash like 2008.
Some are in the camp who compares the present situation with the situation at 2000 market top (PE went up to 27 X). There was a 50% correction after that. So market has not survived a 27 + PE multiple in both occasions.
Here I am trying to draw certain parallels between 2017-18 with 2003-04 scenario.
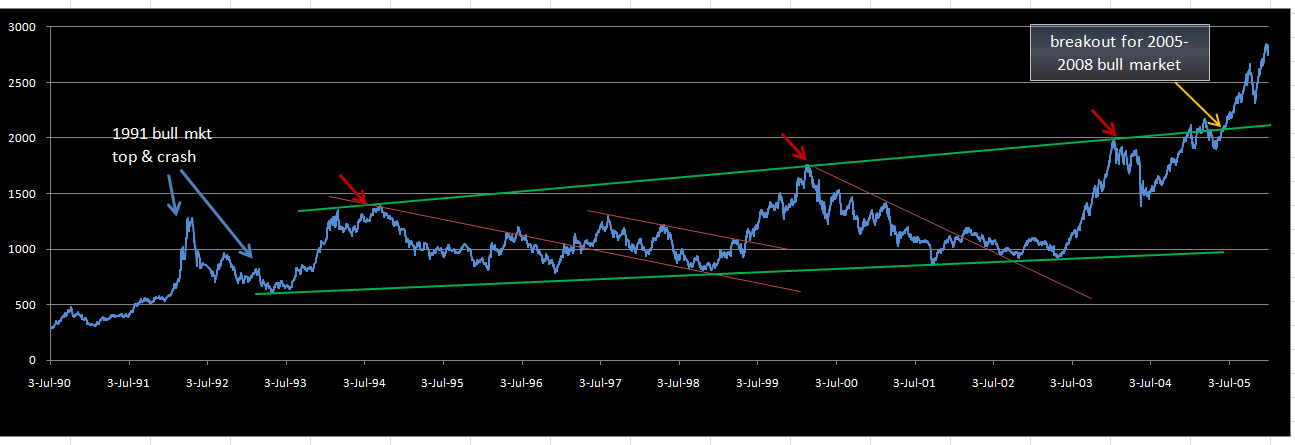
The first major bull market in India was in 1990-92 period where index went almost 5 times. This one bubbled up by harshad Metha scam and was topped in 1992 may and a nosedive happened in markets after hitting the top. The markets anyway recovered to the same level by 1994. The market went on consolidating within a range for almost nine years. The market touched the top of the range 3 times, first in 1994, second in 2000, and the third in 2003.
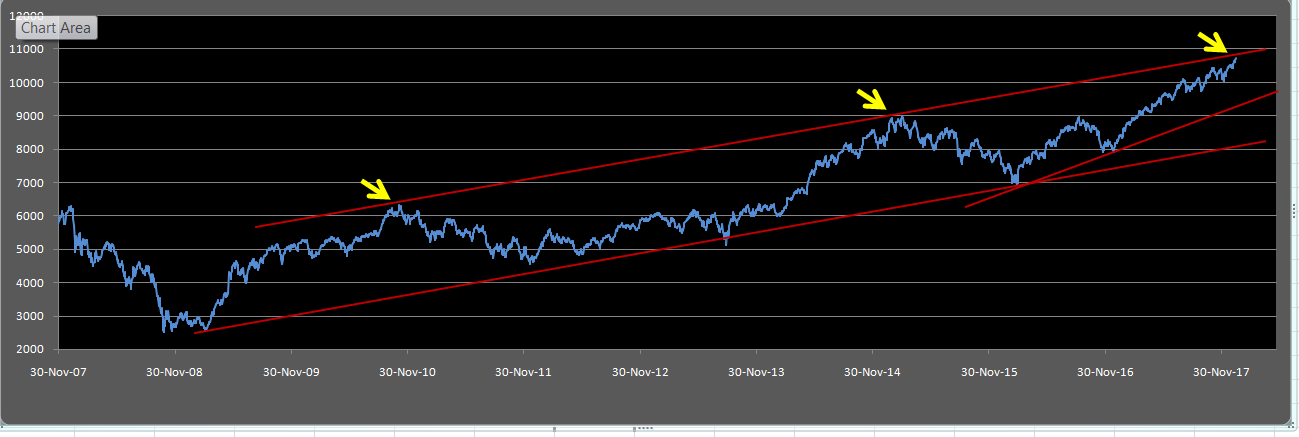
The second major bull market in India was in 2005-08 period where index went almost 5 times at the peak of 2008 Jan 7th. This was brocken in 2008 during the global financial crisis and a nosedive happened in markets. The markets anyway recovered to the same level by 2010. The market went on consolidating within a range. The market touched the top of the range 3 times, fisrt in 2010, second in 2015, and the third at present (nearing to touch).
When the market touched the top of the channel of 1994-2003 for the third time, in 2003, the inflation adjusted nifty has already crossed the trend line from the 1992 bull market.
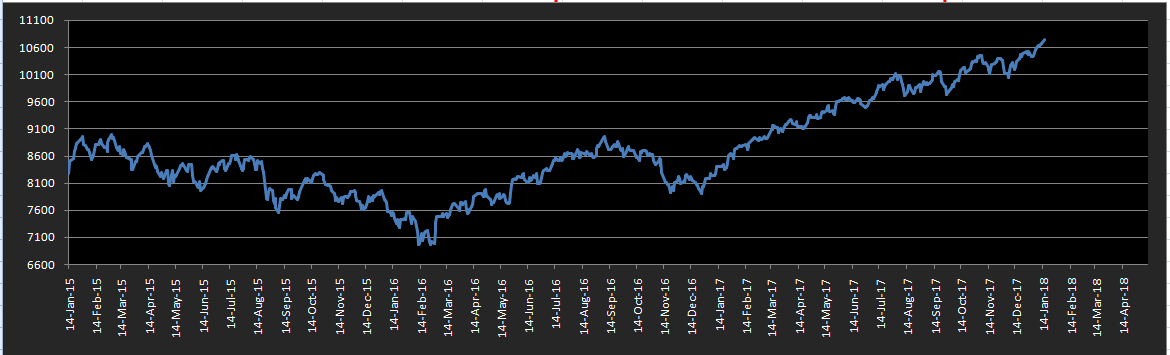
Simmlarly now Nifty has touched or going to touch the top of the channel of 2010-present, for the third time. The inflation adjusted Nifty has already crossed the trend line from the 2008 bull market.
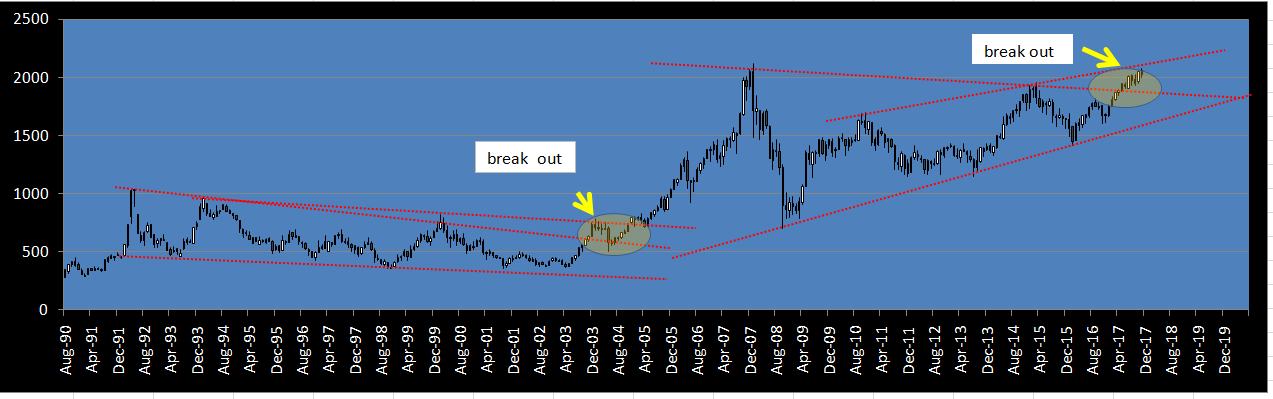
So the chart patterns of 2003-04 and the present pattern can be seen as similar.
After 2003 top there was a correction of 35% , but this was due to the unexpected results in the 2004 loksabha elections. Also there was a scam in the during that days stock market days which was later unearthed by SEBI.
Apart from this fall due these events the fall was restricted to 10-12%. This 10-12% correction is a healthy and needful correction in any bull market.
In 2003-04 , after touching the channel top for the third time in 2003 dec there was a correction of nearly 35 % (in which a nearly 25 % can be attributed to the unexpected election result and the scam involving UBS). This was the base for the big bull rally which culminated in 2008 at nifty reaching 6300 lvls. So after touching the present channel top (of 2010 - present) which is about to touch, after a meaningfull correction the big rally can start.
Another interesting thing happened during the correction after hitting the top of the channel in 2003 is the Williams accumulation/distribution levels.
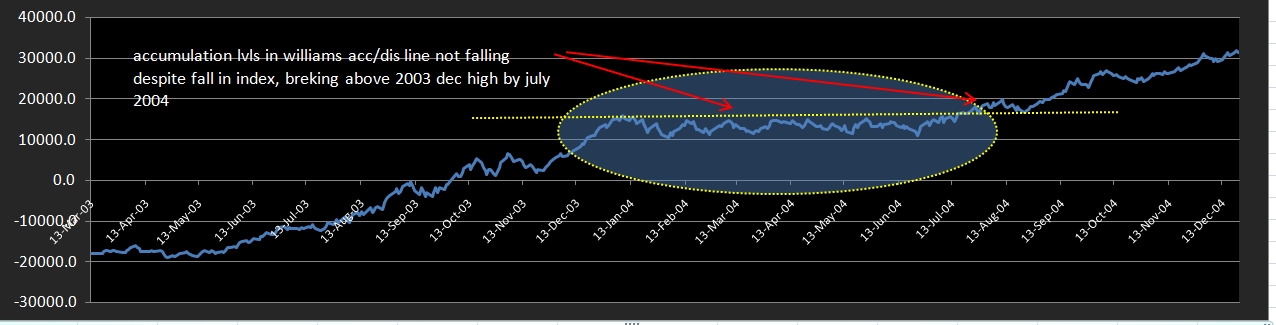
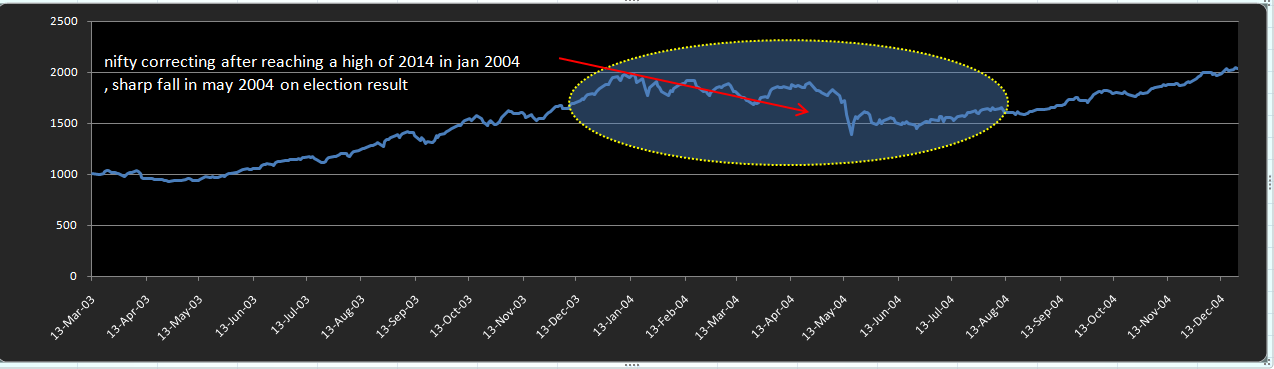
Here it can be seen that during the entire correction( almost 9 months) the accumulation levels in willams AD line was not falling much despite sharp fall in index. It can be seen from the charts that accumulation levels climbs above the highs of 2003 dec index high , by July 2004, eventhough the index level was 1600 range (nearly 20% lower than the highs).
I feel that this accumulation levels is the most important thing to watch during the correction that might happen soon after touching the channel top which is expected soon.
How much correction possible?
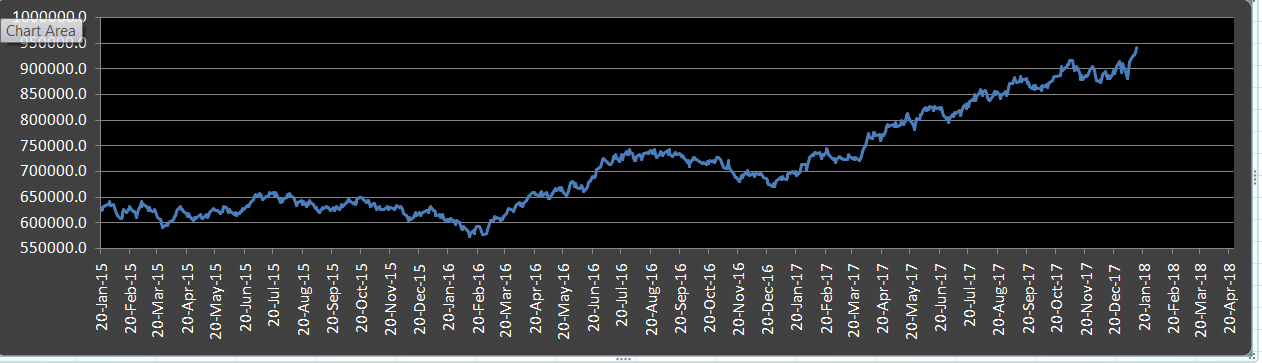
Here is a chart of weekly RSI vs Nifty.
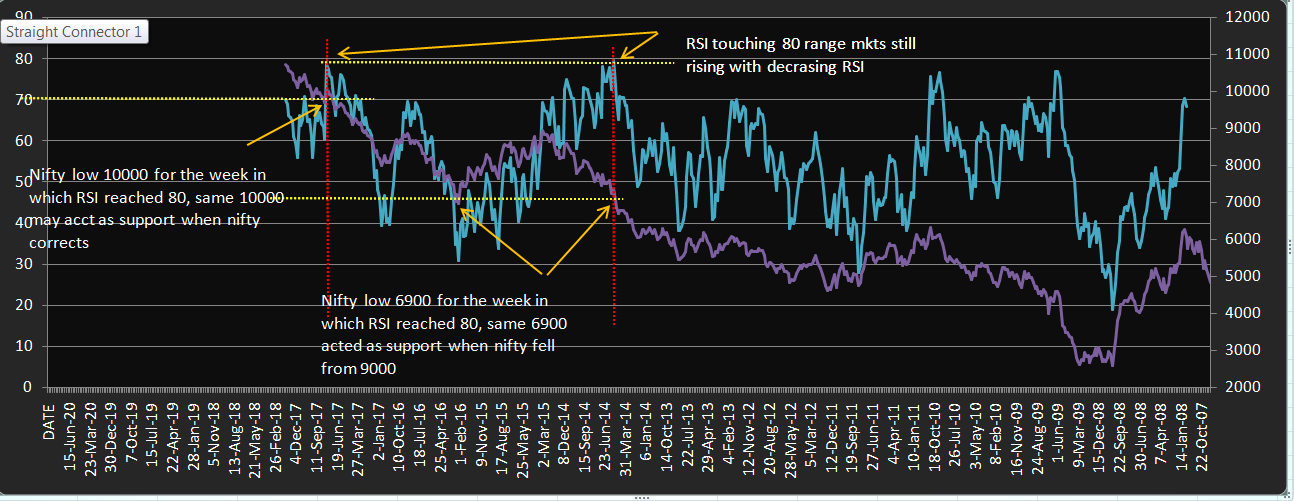
Weekly RSI touched near 77/79 in May 2nd week 2014, nifty kept on rising to 9000 lvls in march 2015 with a negative divergence in RSI. The lows of the week in which nifty RSI peaked was 6900 lvls. After reaching 9000 lvls in March 2015, nifty corrected to 6900 lvls, the lows of peak RSI week. Then Nifty weekly RSI touched 77/79 in july 2017, and the lows for that week was 9900-10000. Nifty kept on rallying further to present with decreasing RSI. So I feel even if correction sets in 9900-10000 will act as support, which was the lows of the peak RSI week.
But one major concern is that the present accumulation levels is lower than the high which happened during august 2016 when the index was hardly 9000. A 2000 pts increase was not able to lift the accumulation levels above those highs.
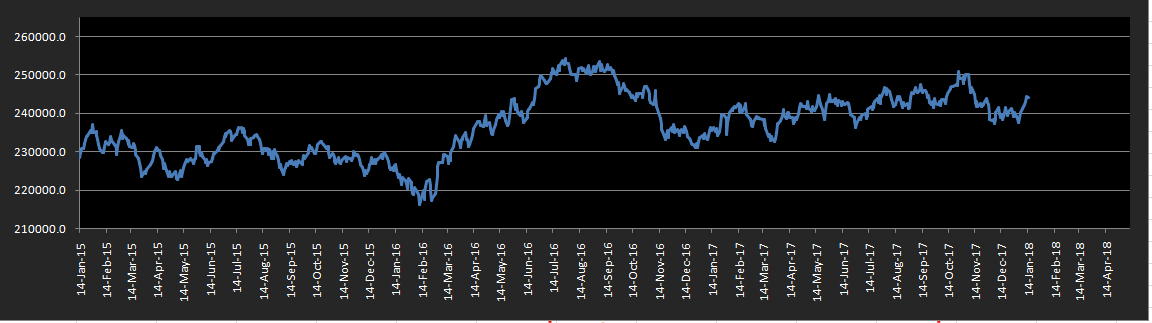
But this divergence is not seen in nifty 500. Here accumulation is steadly increasing and that is reflected in the outperformance of broader markets.
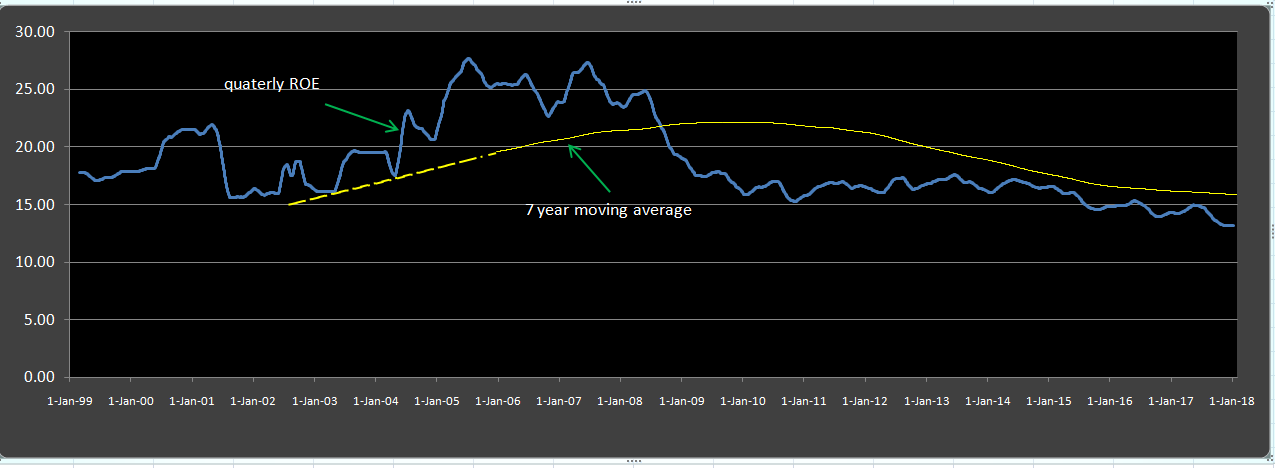
Here is a chart of ROE plotted on a quarterly basis (in which I took ROE= EPS/BV which is not accurate but will give an indication. ROE has remained subdued for nearly 9 years. So atleast a mean reversion has to happen. Now with recovery in economic conditions ahead in sight (recent IIP data, high PMI data) earnings recovery can be expected any time soon
Here is a chart from indiacharts.in in which consolidation of IIP is shown and the latest IIP if it is a sign of pickup, can breakout from this range.

With all these observations I feel that after a meaningfull correction, nifty will breakout of the consolidation phase, for the big bull rally which may last 5-7 years