Thanks for the wonderful website. Check if the following is possible:
HSCODE to company mapping - for example companies that use Ibuprofen as raw material, companies that produces Ibuprofen etc…
It is difficult to map the companies and the materials that they deal with as it requires decent amount of research (reading annual/sectorial and industry reports). May be you can source this data from registered users by giving an option to enter the company info that deals with the commodity in import/export or trends page, later this mapping data can be sanitised by verification.
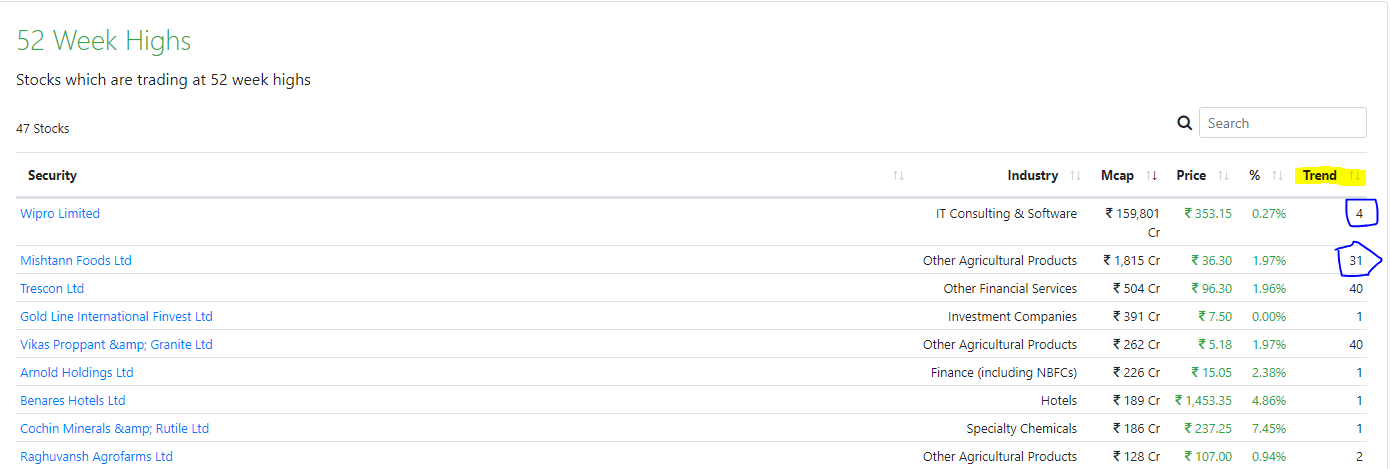
Here’s breaking the writer’s block with one small add-on feature requested by @bheeshma and @anni23 to the 52 wk high low module. I have added a 26/13/7 week high low as well in the same screen which is useful owing to the fractal nature of the markets. You can switch using the tabs at the top right.
Of course every stock which is trending in a higher timeframe will be trending in a lower timeframe as well, as stocks at 52 wk high will also be at 26/13/7 week high. The ones which are in lower timeframes but not in higher are the early trends (eg. Hester Biosciences). I don’t have a way to filter trends not present in higher timeframes to spot these easily yet. Bit of manual effort will be required as of now.
@Jiitt007 - Thanks! Trend is simply the number of days it has been in that trend (Trend = Trending days). If a stock hits 52 wk high for the first time today, its trend will be 1. If tomorrow it ends in green again, trend will be 2 and so on. I only consider closing prices to consider highs/lows.
Btw, I see you have highlighted Mishtann Foods - Just my 2 cents on this business. It seems to be questionable. The number of Patels holding this business is staggering. They are controlling the floating stock and pumping the price up day after day, taking it from Rs.3 to Rs.40. Its current market cap is a staggering 2000 Cr, much larger than players like LT Foods, Agro-tech foods, DFM Foods etc. It doesn’t make one bit of sense though looking at the very, very colorful AR.. Reminded me of Saanwaria Agro which had a similar colorful AR for probably non-existing products. So better to be careful with this company, if the strong trend looks promising.
@girishrbhat@Karthickphilistines - Will definitely consider whenever I resume development. Busy with other things as of now but will hopefully start soon.
@dipen01 - SHP gets updated on the same day company releases it to BSE.
I was looking into SHP for GNA axles, Promoters are increasing their stakes and reporting on BSE but same is not reflecting https://phreakonomics.in/shareholding/index/GNA so was wondering if you update on the quarterly basis ?
I am a bit annoyed by the blatant appropriation of the research I had done here
Even the screenshots used are directly lifted from this post with no source pointing to phreakonomics or to the VP post. Some of the points in my post are used as is and attributed to the management. It’s a bit dishonest and unfortunately the risks I had listed in bold in my post are omitted. Sigh!
@phreakv6
Hi Phreak
Where do you get the import export data for january from ?
I get data from this government site but the latest is only published until Dec
Appreciate any pointers
Thanks
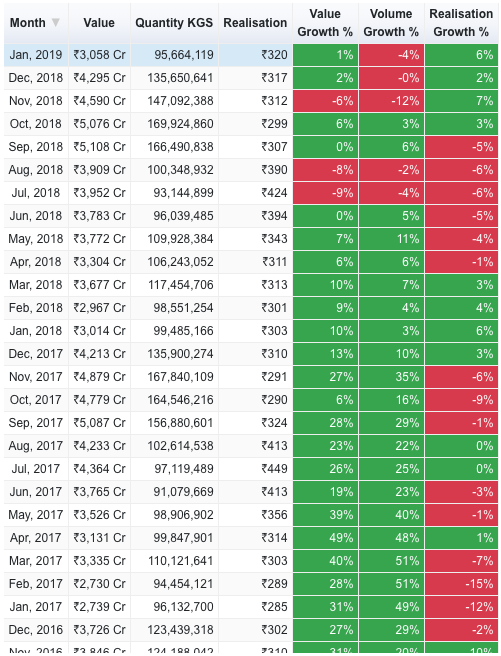
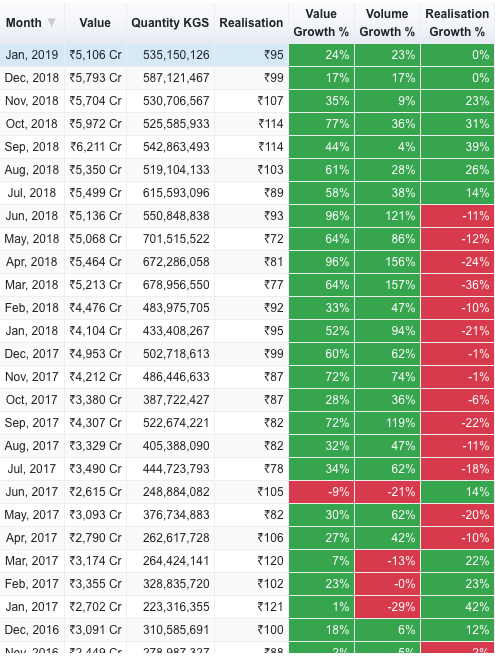
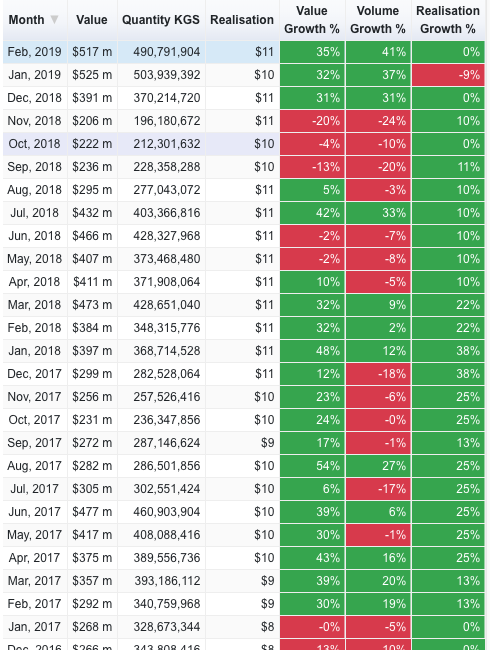
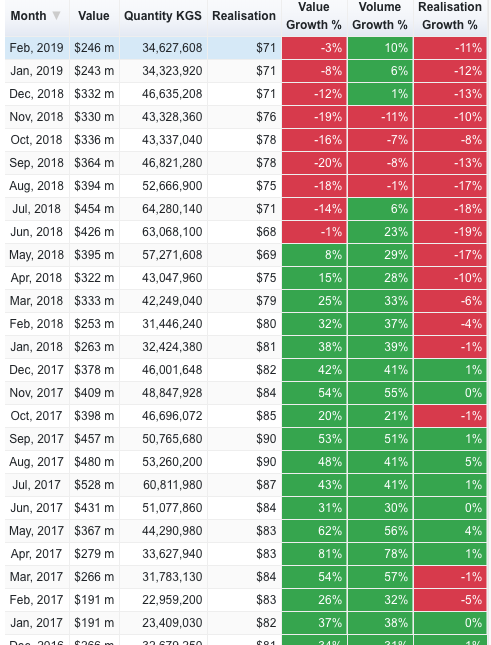
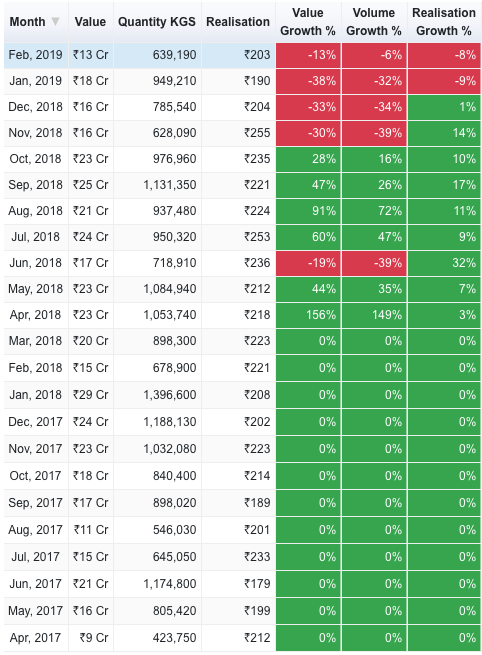
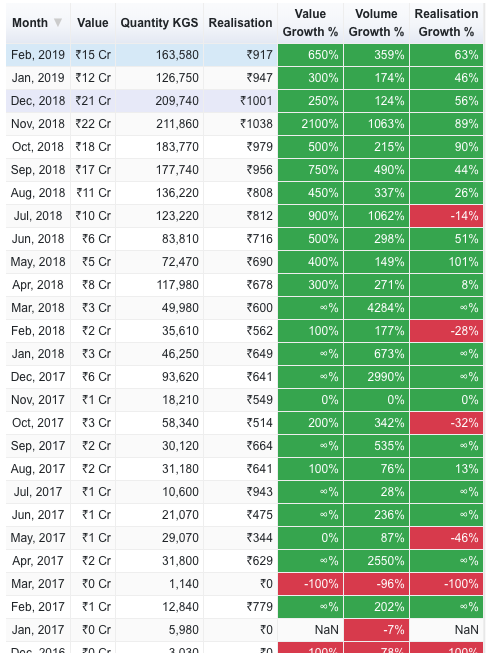
Camphor imports almost non-existent and exports continue to pick-up steam. Realisations bit down compared to Q3 though, probably because of slight drop in GT prices in Jan.