I have a new module which I have been tinkering on, ready for use. I have been working on a quant toolkit and here are two things which are very useful.
Every stock which is a multi-bagger makes it appearance in 52 week high on multiple days so watching this section closely is very useful to identify what’s moving the market. Even the 52 week low is an interesting segment to look for contra-trades (especially when combining with an oversold RSI for eg. Quess in recent memory). The last field is the number of consecutive days the trend has held.These update everyday around 8 pm or so.
Moving average crossovers - These are very useful for trading short-term when you are using the daily moving averages. The 200 DMA price crossover is especially useful as it is a definitive sign of near-term strength. The death cross (50/100 or 100/200 bearish cross) and golden cross (same in reverse) are also useful for timing exits and entries. Weekly moving averages are very useful to catch reversals (eg. DCM Shriram when it closed above 200 WMA around 280-300 levels). These are also very useful for timing entries into long-term positions.
The sector field is useful to see which sector is having tailwinds/headwinds. The market cap field is useful for filtering the decent quality stocks. I intend to blend some fundamentals based fields here (RoE, D/E, Qtr profit % etc.) in the future but for now, there is a link to screener for you to look these up. I intend to add a down-from 52 wk high option sometime in the future
Suggestions welcome. I know I have been receiving quite a few. Be assured that all of them are going to make it sooner or later as time permits. This is still a hobby project for me.
Disclaimer: The usual. Use with caution and you are responsible for your P/L.
P.S. Noticed some errors in Weekly crossovers so have disabled it until I fix. (Update: Fixed and its back live). Please cross-check the output against some other source as well just to be sure. The prices I use are hand-built and adjusted for Splits/Bonuses/Reduction of Capital/Consolidation etc. (not for Dividends yet) and not purchased from any source so there could be divergences but I have tried to ensure they are of same or better quality.
Have you considered doing fuzzy matching of names of holders? As you have mentioned yourself, there are multiple names. I think that could be a good way to do it rather than have to sanitize the data itself.
@hegman12 - BSE changed their site over the weekend btw. Pretty much everything from announcements, prices, corp actions, shareholding etc. did break but weren’t too hard to fix over the weekend. Hopefully we are set for a few more years before they change again.
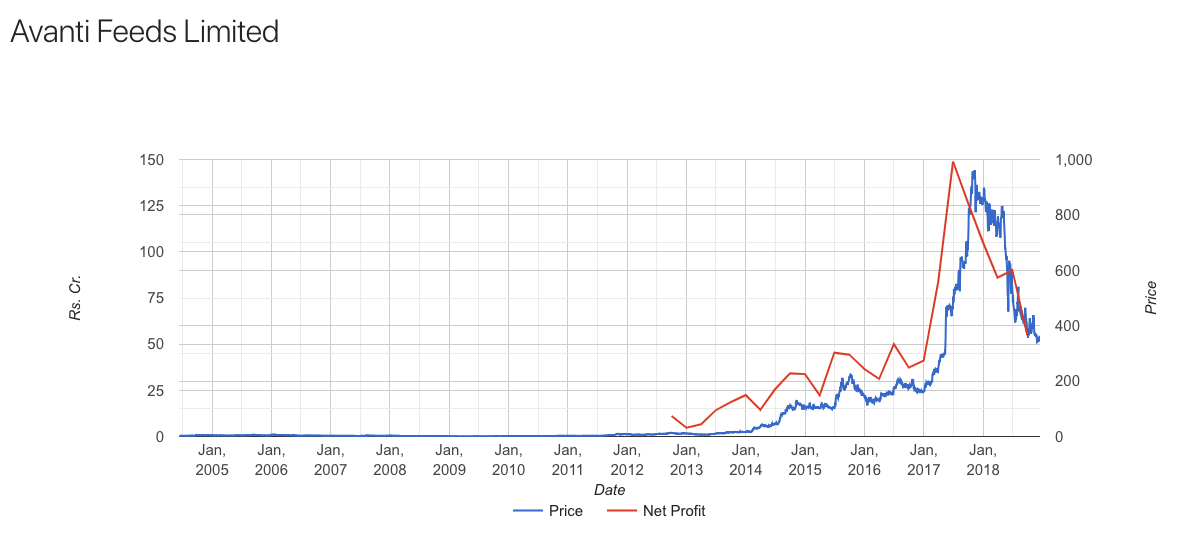
Seeing the export figure of Basmati rice since Q4 2017,there is value growth every quarter wrt
same quarter previous year ,what can we deduce from this?
shows how MFs dumped on retail in Sept. Unfortunately SHP is available only end of quarter while price moves everyday so the extrapolations between quarters may not be very accurate but does give a decent picture of what’s happening.
Also the individual commodities data is updated until Oct '18.
Q3 data is incomplete so viewing monthly is recommended.
Also, have updated the 52 wk high/low interface to be more user-friendly/mobile-friendly.
@raj4mjsr - Basmati rice realisations are going up but volumes have been on a downtrend or flat at best. @Karthickphilistines - Will see what I can do.
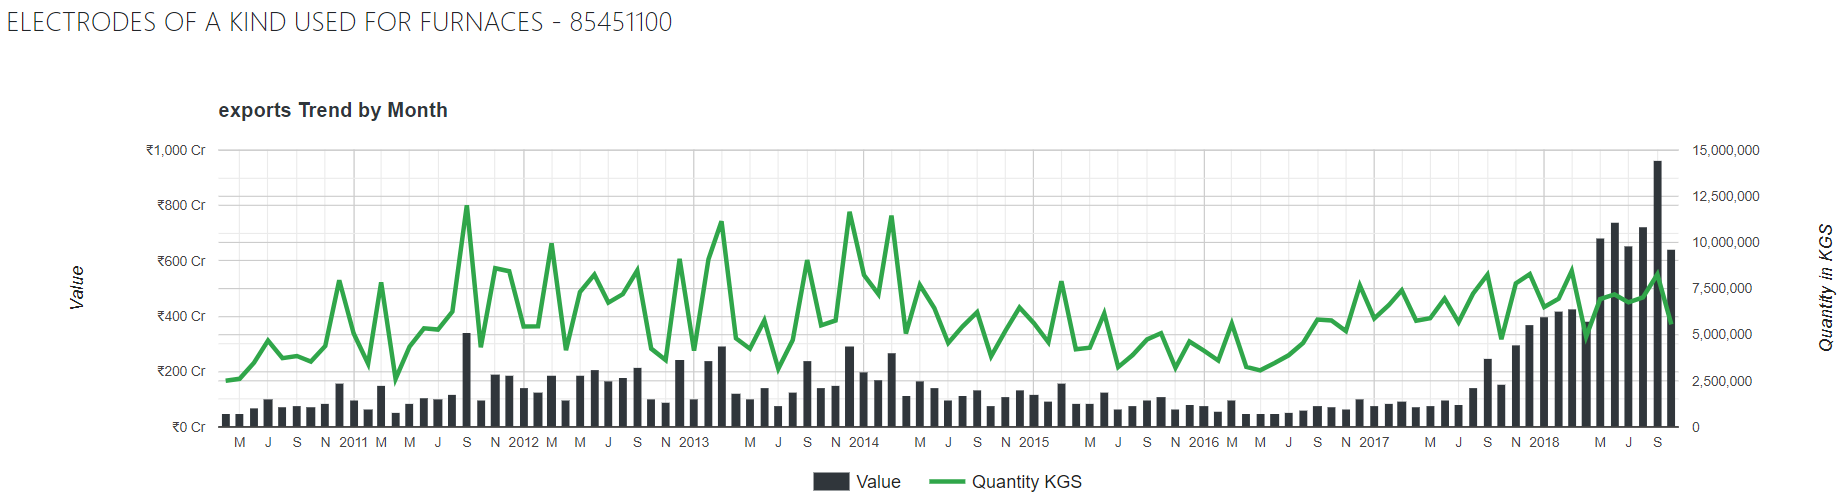
Electode exports came down in October. @phreakv6 is this commodity same as the Graphite Electrodes exported by HEG/G I? (realization price /tonne matches, but the total quantity exported is less than export revenue of HEG alone)
The current trends section for exports/import of both grouped as well as individual commodities now shows volume and realisations as well as requested by some here. I think it makes better reading now. Please note that only grouped commodities with exports/imports above Rs.100 Cr per month and individual commodities above Rs.50 Cr worth exports/imports are included in the list as only these are useful for our purposes of finding investible opportunities.
@gurramlokesh - Yes I believe this is the HS Code for graphite electrodes. However, i am not aware of what HEG/GI’s exports vs domestic sales are and if there are multiple HS Codes for their products as I am not following this sector closely anymore.
hi Phreak can we have a single LINE chart with a time frame of 10 years for an equity with
1.market cap or enterprise value
2 revenue
3.PAT
4.debt
5.OPM…
Kindly consider.(…charting is better than number crunching…)
Hi Karthick, Yes I do have something like this in mind. However, at this point I don’t have a source for core financial data. I like building over buying (especially when it comes to core components), so am in the process of collecting this information. Once I have it, I do intend to show data visually where it’s easier to read trends and compare parameters. Am not sure how long it will take but it is definitely coming, sooner or later.
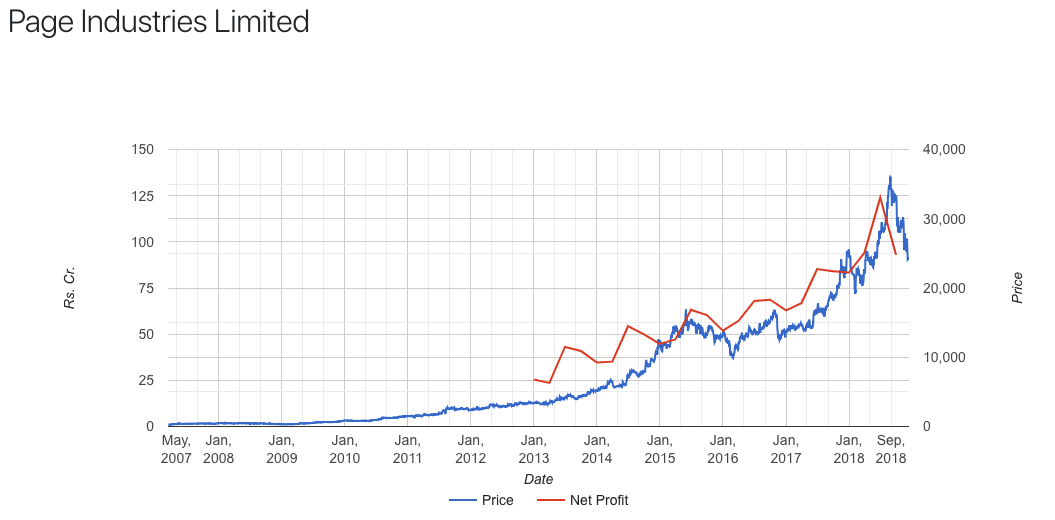
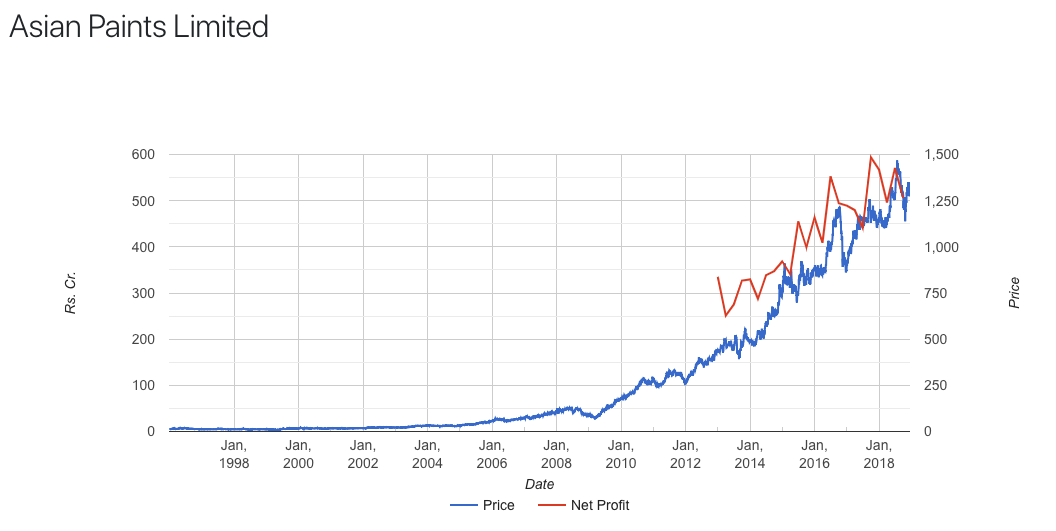
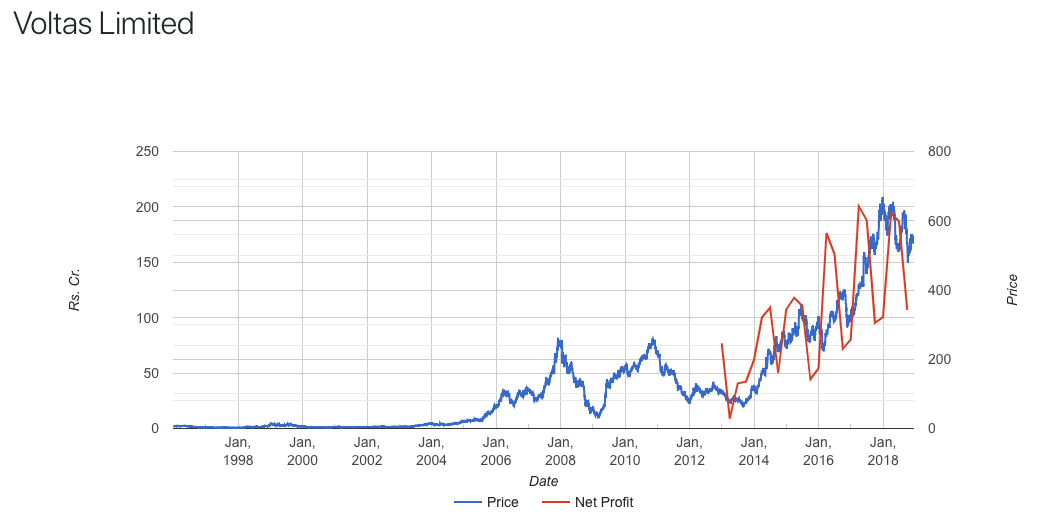
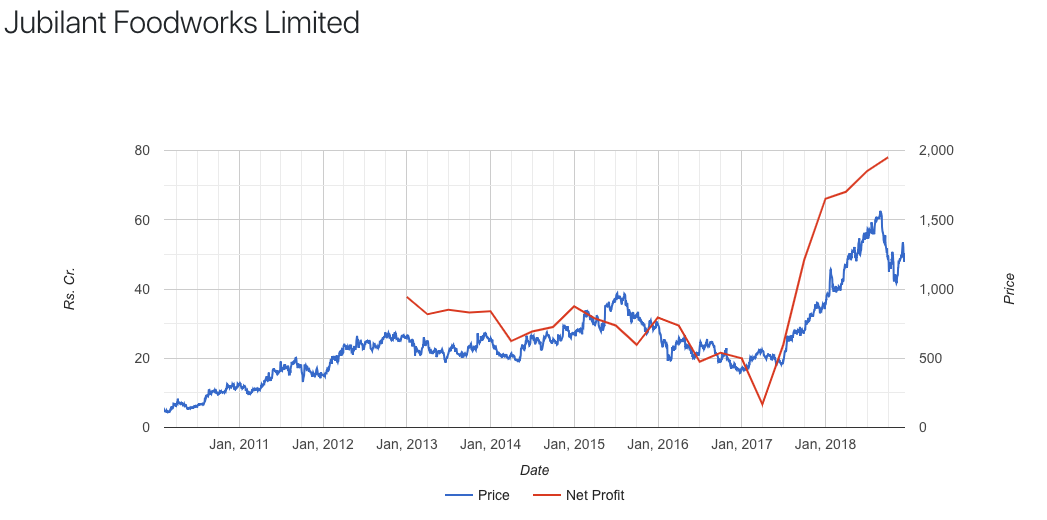
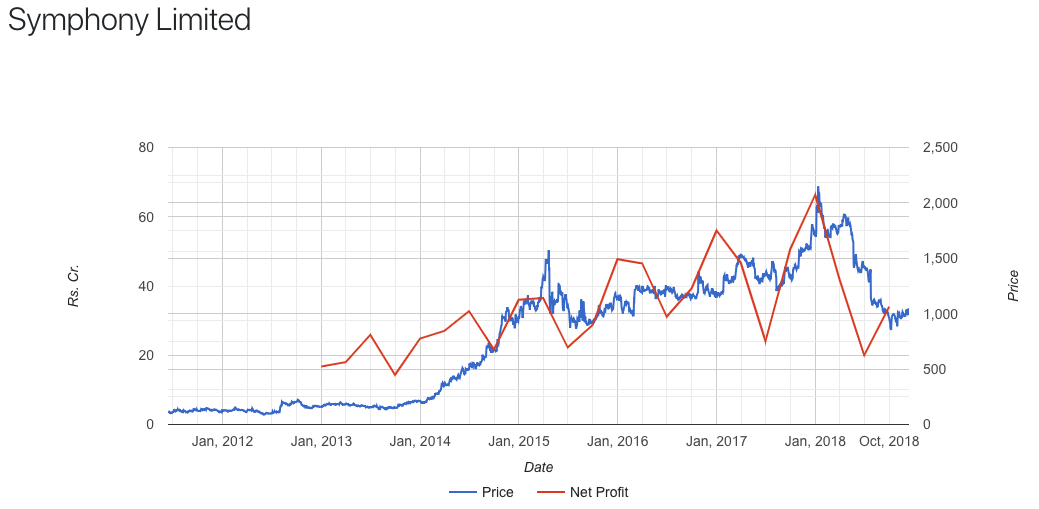
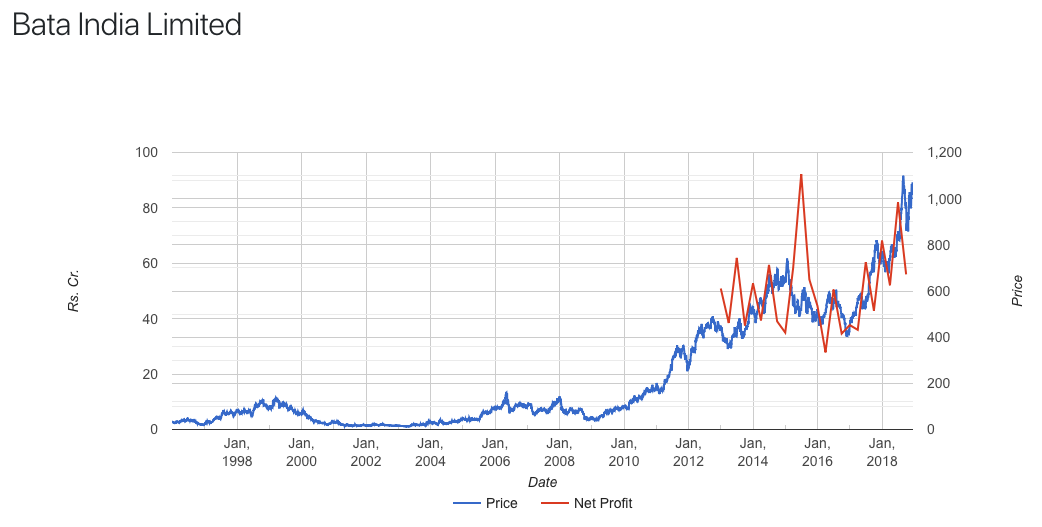
Been fiddling with some stuff and found this very interesting. The following are price and net profits plotted together. Please note that although net profit is plotted on the end date of quarter, the actual results would have come out a month or so later.
Sometimes market reacts ahead of the numbers - like in the case of demonetisation - the earnings did dip but resumed later and now again, the price moving up because of crude and expecting the earnings to catch up.
Market rewards businesses that can come out of adversity all guns blazing. Jubilant post their pizza base, cheese and price overhaul after the onslaught from food delivery businesses
Here the seasonal peaks of Jun/Dec quarter are leading the price and now the price is leading towards the Dec quarter results in the hopes of similar patterns to last FY.
This is super stuff phreak! I plot discrete yearly sales, profit and price. Though it captures long term profit trend and consequent price trend but what you have posted is super granular and Is fantastic. I am sure this is not excel but some software or algorithm.
I would request you to post more and churn out more meaningful patterns.
Your posts have been insightful, without fail. The habit to tinker and build useful stuff is very inspiring.
Currently, I’m trying to organize all my financial research (PDF’s, PPT’s, mind maps of research reports, concall summaries, personal notes, misc.) by using the tagging/labeling system on the Mac. The folder structure has become so complicated that I’ve decided to stop updating it. Are you aware of any versatile cloud-based document index system that I can use to achieve the same? Mac labeling is really good but I want it to be accessible remotely. GDrive really needs this feature.
Also, are there any other paid tools that help during your research process? For example, I use Notion extensively to jot down notes.
@investor_learner - Thank you. I have never used folder labels on a Mac although I have been on OS X since Tiger. Notion (why not Evernote?) looks quite interesting and reminds me of basecamp which I have used few years back for collaboration. I use Wunderlist on mac for simple to-do lists but that’s pretty much the only organising I ever do as I am not a very organised person in general.
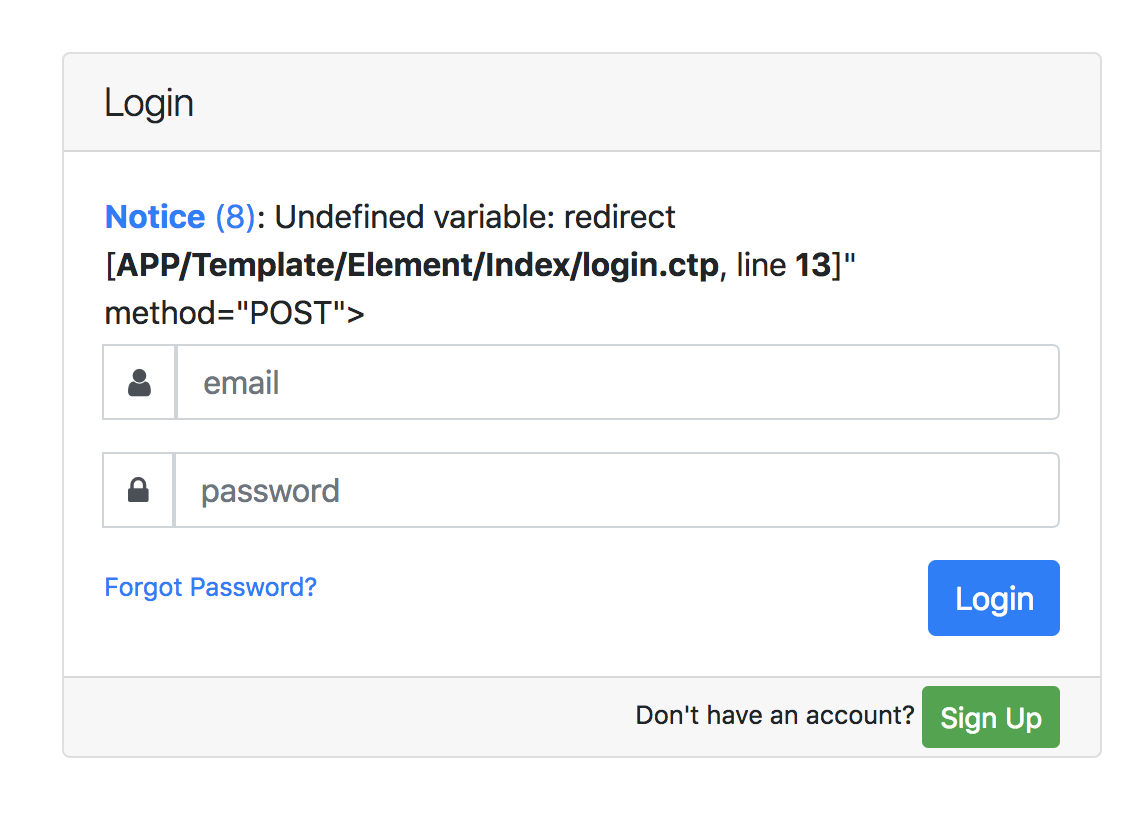
@phreakv6 First of all thanks for sharing such a nice tool.
Small nitpick: When I click the “Forgot Password” it displays an undeclared variable in the post request. Although it gets the job done.
One feature if you can add, will be icing on cake…
In BSE Alert Notification, 1. The way we have stock specific alerts option, Possibility of KEYWORD Specific alert, example say my Keyword is “AWARD”, so any announcement which will have this keyword, notification will be triggered for the same. Very useful feature, FYI , there was a Website created by Our Forum member earlier, which was doing this, But since new BSE Site Update, they have stopped providing notification for KEYWORDS, So if you can try checking possibilities of the same in your portal.That will be big thing.