If you kindly share for novice like me how to interpret the share holding pattern it would be beneficial for us to use it effectively. As 8k miles share holding patterns shows smart money are increasing their stake …But the co is seems to be dubious in its accounting practices
@sajijohn - Thank you
@hegman12 - BSE/NSE sites don’t change often. They might redo their logo once in 10 years but I doubt if their website is a priority for them. It shouldn’t take too long to update things if they do though.
@bhavin.mehta2810 - I noticed this anomaly with Bharat Rasayan too sometime back. BSE doesn’t have their SHP - https://www.bseindia.com/corporates/Sharehold_Searchnew.aspx?scripcode=590021&flag=7&expandable=6
@devaki.tripathy - That’s nice to hear. I developed this for that same reason as I don’t like performing repetitive tasks again and again.
@Jayatu - It should be as simple as seeing what the intentions of other people are. Small dips do happen from time to time in Promoter holding or HNI/MF but a consistent downtrend of a percent or so every quarter should be concerning, especially if it involves prices moving down and retail holding going up. In reverse, there are some very good small caps where you can spot accumulation as well where retail holding is going down steadily as price moves up and HNI/MF/Promoter holding is going up.
This however is not everything and one shouldn’t base buy/sell decisions solely on these. These are very helpful as one of the screens/checklist items to see who you will be in bed with and what their intentions are and if it aligns with yours.
In case of 8k Miles though, I did notice that the usual pattern seen in Vakrangee/PCJ/Fiberweb etc. didn’t work. This was when I started suspecting that they weren’t reporting truth to the exchanges - be it with Tandon’s holdings or now with Suresh’s holdings. When the downside of mis-reporting such things is a couple of lakhs fine (if at all and that too after 5 years or so) and a reputation loss but you get to make a few hundred crores, the incentive is skewed to encourage misdemeanour. Its like a coin toss where you lose 10 bucks if you call wrong but win 1000 when you call right. I would take it any day.
2 Likes
Thank you very much for your detail explanation…And really a great initiative…Hope to learn a lot and add another dimension in investing decision…Great going…
Thanks a ton for these tools. Really amazing, very helpful.
Pretty impressed by what you built and thank you for willing to share the fruits of your IT development skills.
@RajeshKH, @james_kerala, @Jayatu - Glad to be of some use. Please let me know if something’s broken or if something can be better.
1 Like
Very useful utility for anyone who wants to dig down deeper into SHP. ![]()
You may consider adding a screener like feature which enables a user to filter out stocks on a given criteria.
For example –
Delta in “Promoter” Holding >< “1%” over last “X” “ Quarters/Years ”
So broadly, there would be 4 variables as highlighted above.
- First variable can have broad values such as promoter/MF/DII/FII/Individuals greater thn 2 lacs/Individuals less than 2 lacs.
- Second variable can have numerical value which could be negative or positive. This will give the percentage change in holding.
- Third one again numerical will give change in holding over the number of quarters/years depending on 4th variable
- Forth one will have two options i.e. quarterly or yearly. (This can be skipped and can be kept “Quarter” as default)
These are few inputs from my side and I’m not sure if this is possible or not but if incorporated, it definitely is going to be a very helpful feature.
Regards
MV
2 Likes
This is awesome - a super helpful tool. A couple of minor suggestions:
-
Can you make the y-axis of the chart more granular. The y-axis unit appears to be either 10% or 20%. When it’s 20%, the shareholding change is difficult to spot, particularly because in many shares promoter shareholding changes by quarter are no more than 1%. Maybe 5% will be better, or at least 10% if space is a constraint.
-
Can you show the Total % holding at the bottom of the table, so that we can check that it adds up to 100%? I was looking at Tata Motors, and promoter holding is 33% in one quarter and 0% in all other quarters. Not sure that’s right.
Thanks!
Introduction of screening option will certainly add greater value to your splendid job…If possible …
Really liked your following explanation @phreakv6. I was wondering if you create a quick-start/ intro guide so a new user can get started easily? Thanks
@Jayatu - It should be as simple as seeing what the intentions of other people are. Small dips do happen from time to time in Promoter holding or HNI/MF but a consistent downtrend of a percent or so every quarter should be concerning, especially if it involves prices moving down and retail holding going up. In reverse, there are some very good small caps where you can spot accumulation as well where retail holding is going down steadily as price moves up and HNI/MF/Promoter holding is going up.
This however is not everything and one shouldn’t base buy/sell decisions solely on these. These are very helpful as one of the screens/checklist items to see who you will be in bed with and what their intentions are and if it aligns with yours.
In case of 8k Miles though, I did notice that the usual pattern seen in Vakrangee/PCJ/Fiberweb etc. didn’t work. This was when I started suspecting that they weren’t reporting truth to the exchanges - be it with Tandon’s holdings or now with Suresh’s holdings. When the downside of mis-reporting such things is a couple of lakhs fine (if at all and that too after 5 years or so) and a reputation loss but you get to make a few hundred crores, the incentive is skewed to encourage misdemeanour. Its like a coin toss where you lose 10 bucks if you call wrong but win 1000 when you call right. I would take it any day.
Hi - Thanks for the wonderful tool.
I noticed that the tool misses new entries in shareholder patterns…
In “Acrysil” latest shareholder’ pattern below investor entered in Sep’18 qtr but NOT appearing in your tool.
VINITHRA SEKHAR 1 75745 75,745 1.46 75,745 1.46 1.42 0.00 75,745
Please have a look
@inxs_22in - Will see what I can do with the screener. This is definitely a great idea. I currently run manual queries to get what I want. I had not intended for this to be used as a standalone module but now that it is one, it makes sense to make it more usable/useful.
@asarun - #1. I have made it move in 5% steps and it does look bit better. #2. Total here would not make sense as there are some grouped columns as well so we will be double-counting. For eg. Mutual Funds is present as an aggregate and then as line-items. I prefer it this way as it gives an idea of how the aggregate as well as individual holdings have moved (The trend is more important to me than the tally). Tata Motors Promoter holding issue was a bug and it’s fixed now. Thanks for reporting that.
@Chetanpinto - There is nothing more to this than looking for accumulation/distribution and following motives/actions of fellow prisoners (I view shareholders as prisoners as I often apply Prisoner’s dilemma from game theory to figure out what’s happening). Just look for past instances of stock re-rating/earnings growth or de-rating/degrowth and compare how SHP moved during those times. This should just be used as one of the many parameters for evaluation/screening as there are bound to be a lot of false positives when using this method solely.
@Vasan - This entry was present but was cut-off by the footer and this was affecting a lot of stocks which had lot of shareholders where the last entry was hidden. I have fixed this now you can take a look against at Acrysil SHP.
Again, thanks everyone for your feedback and pointers. This is very useful. Regards!
3 Likes
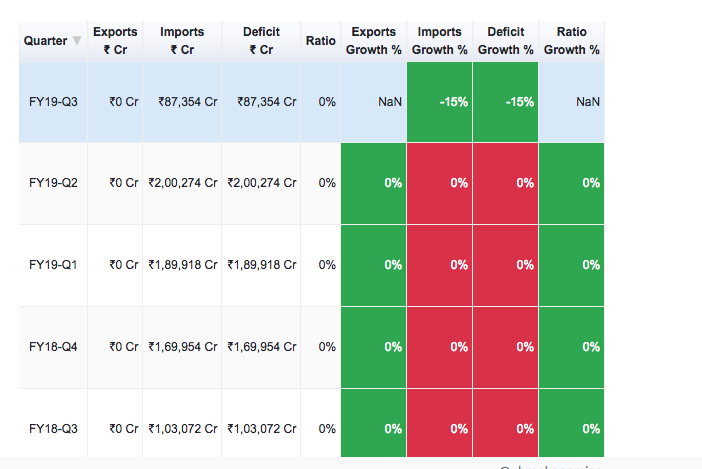
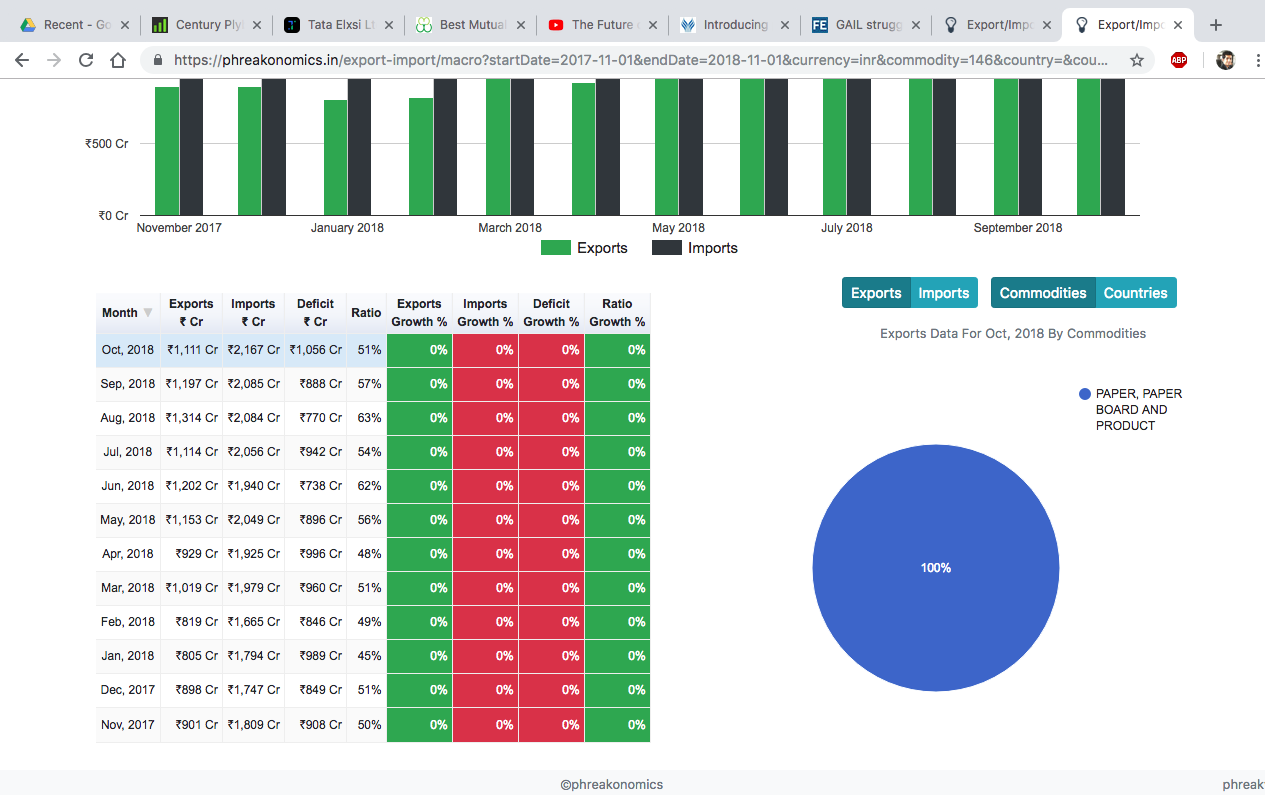
September Export/Import data is out. Since Q2 is complete, in addition to checking monthly data, you can also check out quarterly data.
Paper exports seem to be growing again in Sept - 55% MoM and 63% QoQ
and imports of Waste and pulp continues to remain high
Marine products flat (which i think is somewhat of a good news)
Organic Chemicals continues the steady uptrend
so does Inorganic chemicals
Agro-Chemicals continues trend
Dyes and Dye intermediates as well. Interestingly Dye Intermediate growth isn’t as much as Dyes.
Please do post any other interesting trends you spot.
4 Likes
Analytics on export/import that too Industry/country wise is superb. Nice tool for serious investors and people with analytical bent of mind. Well done !
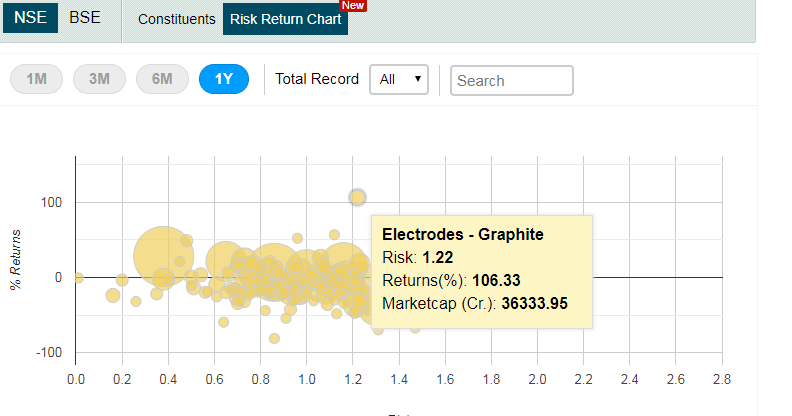
I am looking for any simple data/chart etc which can essentially show Sector Tailwind. By that I mean every 5 odd years , we see some sectors doing exceptionally better than others. We can call it sectoral theme…e.g. IT in 2000, RE in 2007, Pharma in 2013, HFC in 2015 so on and so forth. Now these themes are also not ever lasting…cyclical kind off. One of the ways to identify these themes early on is definitely extensively reading VP blogs. Other than that let me know if there exists any online portal which shows such sectoral tailwinds/themes.
I found one in ET. Its a new feature and shows bubble chart of Risk/Reward of various sectors in last 1 year. But not much details behind the charts. However looks good. Whats your view on this.
To explain again in simple terms…now I know carbon electrode and specialty chemicals are doing exceptionally good and may continue for 2-3 more years due to China Ban on pollution. But how to identify via system and not just by reading.
1 Like
@homemaker - I have some quant tools under development and have a rudimentary sector tailwind identifier but its not yet ready for public. When it is ready, it will go up on http://phreakonomics.in.
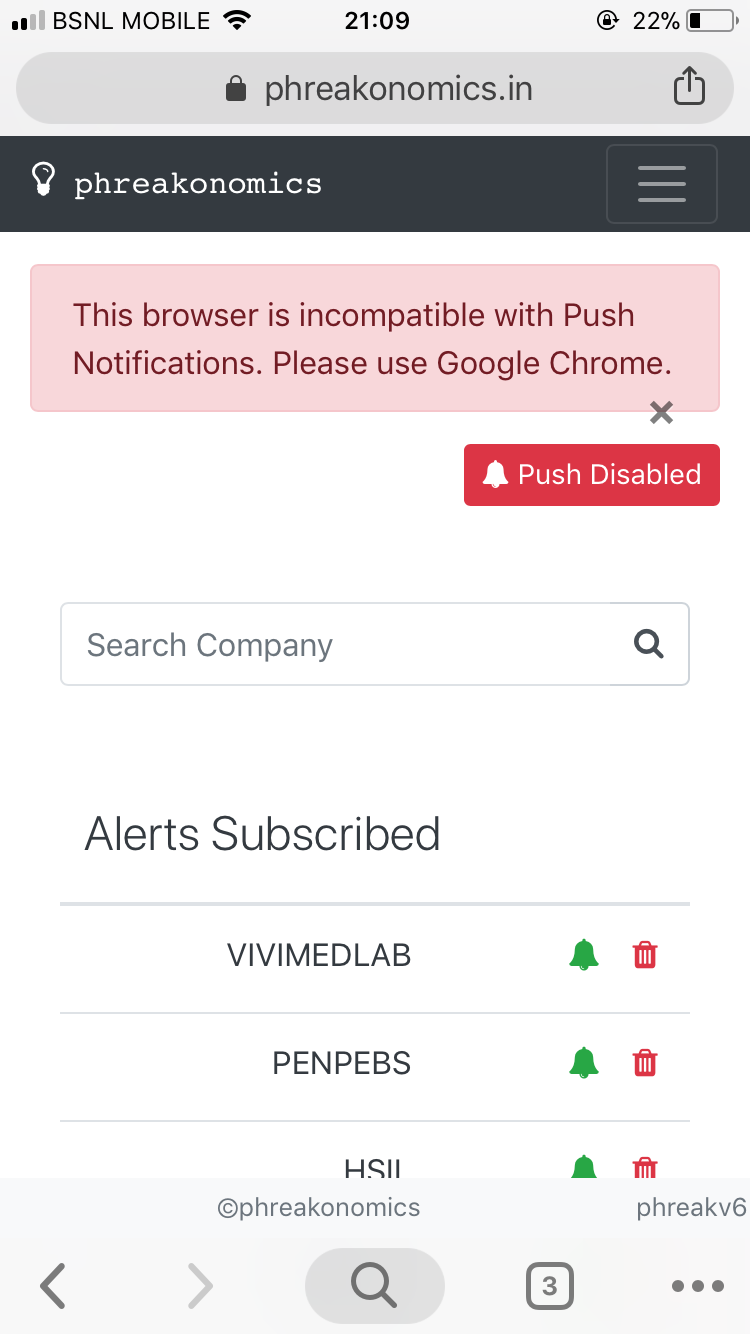
@all Now that the results season is over, I hope the notifications feature helped keep track of results announcements realtime. I see a lot of people are using it but haven’t heard any feedback. I hope no feedback means everything is working as it should.
Oh and October exports data is up.
6 Likes
Really a wonderful tool to use …Thanks a ton for your great effort for the community …Some times I wonder how you manage all these along with your personal stock hunt …Best wishes form a novice investment learner …
2 Likes
Bse announcements working very effectively for free , same as bsealerts paid subscription. Well done. Keep it up.
1 Like
@cathene - iOS doesn’t have a crucial component called ‘Service Workers’ which is required for web push notifications to work in any browser (including Google Chrome). Apple is developing this though so hopefully in the near future, it will work.
1 Like
@phreakv6 When I’m seeing the monthwise trend of exports/imports the data table has been showing all the growth numbers viz Export Growth, Import Growth etc as 0%.