
Dear Nabenduji. I am interested in starting an MFI in Mumbai.Can you help me.My mobile no 9833417751.
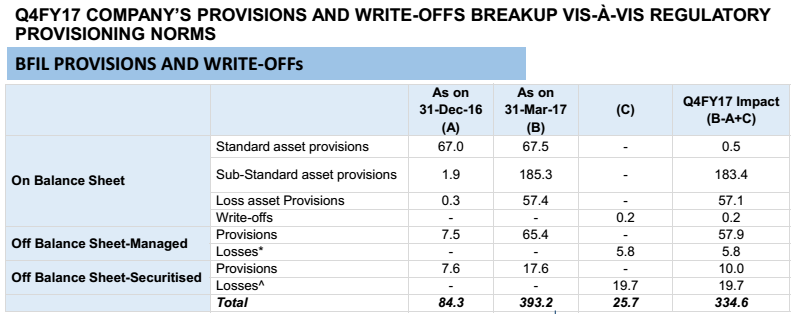
the above screen shot is from BFIL Q4FY-17 investor presentation
What is off balance sheet-securitised, off balance sheet- managed ?
I tried a lot to google in vain.
When it rains, it pours.
HI Yogesh Sane,
If you have time, Can you refresh the NBFC/MFI/Gold Loan companies comparison charts/graphs published in Nov-2016 with FY16-17 numbers? Also it would be good if you can add NPA (without RBI relaxation) numbers in the graph.
Many thanks.
Regards,
Vinoth

I can only do that once I have all the annual reports from all companies in the group. Last year’s data was from Annual Reports.
Ok thanks for your response Yogesh.
I highly recommend reading MFIN Micrometer. It is a report by the MFI association and is unparalleled in its coverage and details about the industry. Here is the link.
4 Likes
Well, if I have to take one takeaway from this report, then it will be the fact that overall annual disbursement for MFIs are more than their year end AUM. this clearly states that average maturity should be somewhere between 6-9 months and loans are fast moving in nature. Once they get over demonetization woes through write-offs and provisioning, it will be a clean slate to start with.
MFI Repayments Are Reaching 98% Levels: Antique Stock
Hi Yogesh,
I have just compiled the FY2016-17 annual reports for most of the companies used in your previous analysis.
2 companies we dont have the annaul report yet (Au Financiers and Janalakshmi Finance). And I have newly added “Edelweiss Financial Services” which is in growth path.
Can you re-run your graphs / reports based on the data points available? We can ignore the missing ones. Thanks
NBFC / MFI Companies FY 2016-17 Annual Report Links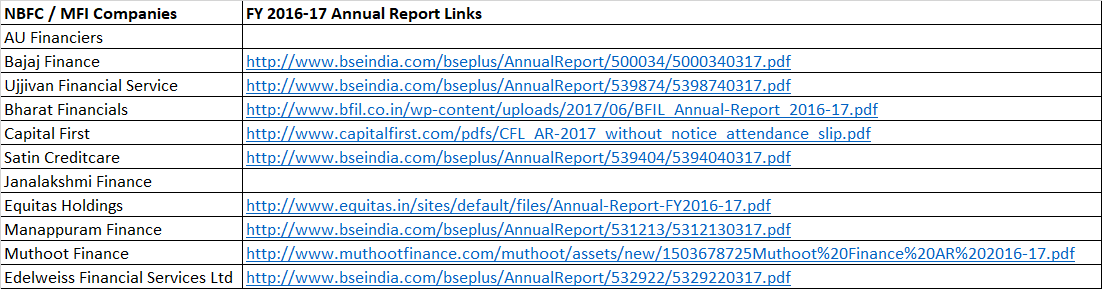
AU Financiers
Bajaj Finance http://www.bseindia.com/bseplus/AnnualReport/500034/5000340317.pdf
Ujjivan Financial Service http://www.bseindia.com/bseplus/AnnualReport/539874/5398740317.pdf
Bharat Financials http://www.bfil.co.in/wp-content/uploads/2017/06/BFIL_Annual-Report_2016-17.pdf
Capital First http://www.capitalfirst.com/pdfs/CFL_AR-2017_without_notice_attendance_slip.pdf
Satin Creditcare http://www.bseindia.com/bseplus/AnnualReport/539404/5394040317.pdf
Janalakshmi Finance
Equitas Holdings http://www.equitas.in/sites/default/files/Annual-Report-FY2016-17.pdf
Manappuram Finance http://www.bseindia.com/bseplus/AnnualReport/531213/5312130317.pdf
Muthoot Finance Muthoot Finance - India's No.1 Most Trusted Financial Services Brand
Edelweiss Financial Services Ltd http://www.bseindia.com/bseplus/AnnualReport/532922/5329220317.pdf
Regards,
Vinoth
3 Likes
Based on your analysis, both Dewan an Capital First seems to be underdogs among their pack. Is it a good idea to invest in these stocks backing for improvement or are we better off backing shareswith better metrics given management of both companies are bullish about their growth? These shares are relatively inexpensive as well.
Disc: invested in both Dewan and Capital First as I bought these before reading the posts.
A different view point.
1 Like
There are conflicting reports regarding MFIs’ current biz and outlook. We should wait for Q2 results for an informed opinion.
Here is the comparison of various MFIs updated with 2017 results. Ratios for Ujjivan for 2016 are skewed because of restructuring.
Size: Bajaj Finance (although not a strictly an MFI) is the biggest of all followed by gold loan companies. Bharat Financial is the largest MFI in this set. don’t have data for Janalakshmi and Bandhan. Except Bajaj finance, others are still much smaller than banks and even NBFCs.
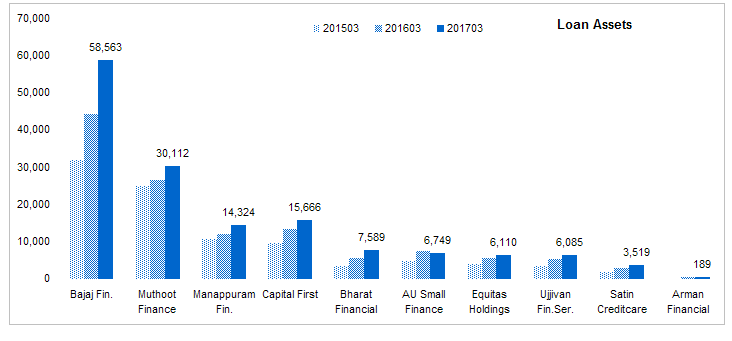
Source: Capitaline
Growth: All companies in this sector are showing high growth rates. gold loans companies have recovered from the regulatory issues and are now growing their asset base. Rest of the pack is growing at healthy rate of 30-40%. This is a 4 year trend growth rate.
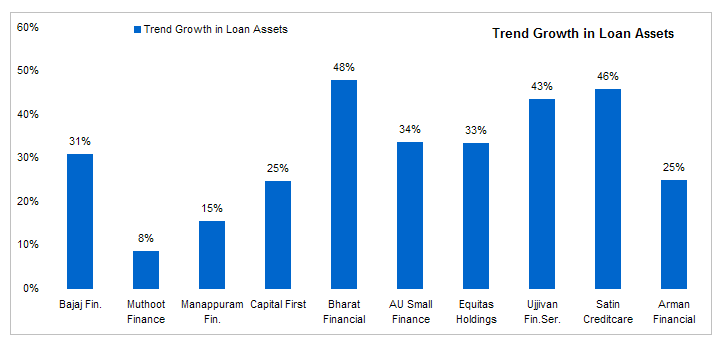
Source: Capitaline
Yield On Avg Assets: - I classify lenders based on the interest rates they charge as determines what type of borrowers they cater to. Bajaj Finance as the lowest lending rate and that is also trending down. MFIs in general have higher rates and consumer finance and gold loan companies. Manappurum and Muthoot have seen their yields going up inspite of growth in their asset base. Mana is now expanding its MFI book but interest rates on its gold loan product is higher than its MFI product.Smaller companies have higher yields. bigger companies are able to offer comparitively lower rates.
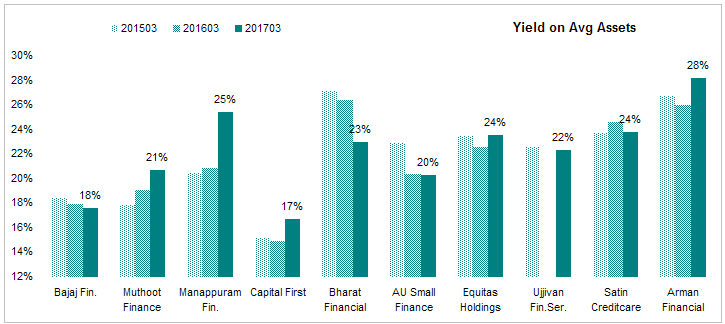
Source: Capitaline
Cost of Funds - Cost of funds is the most important indicator of MFIs as that determines the faith of funding sources (banks) in the business model of these companies. Here again, bigger companies have lower cost of funds so they are able to offer loans at a lower rates.Cost of funds is generally trending down along with overall interest rates in the economy. Tie up with a bank or a small finance bank licence will further reduce this cost.
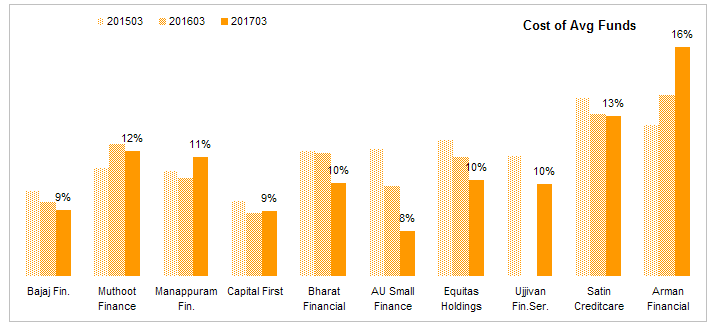
Source: Capitaline
Net Interest Margin A key ratio for any lender is the net interest margin. this ratio is roughly equal to yield - costs of funds. MFIs have a huge net interest margin (10-15%) compared to banks (2$-4%), home loan companies (3-5%) and NBFCs (4-8%) due to their risky assets which yield a high return.
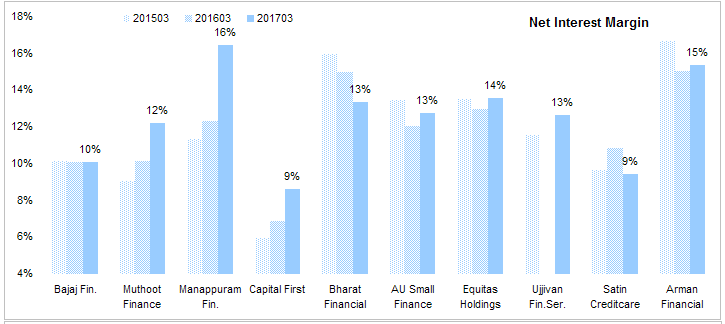
Source: Capitaline
Shareholder return ratios
Return on Average Equity Most important ratio from a shareholder perspective. This industry as a whole is geneating a decent ROE close to 20% with bigger companies generating higher ROE. Although bigger companies have lower yields, their costs are even lower so they are able to generate a high ROE compared to small ones. Scale helps here. Capital First has seen a good increase in ROE. A low but rising ROE is actually better than a high but dropping ROE from an investor perspective.
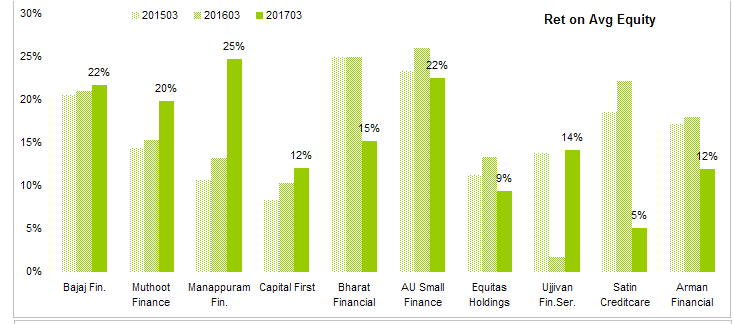
Source: Capitaline
Leverage This ratio shows how much debt is used to leverage equity. This is calculated using total assets / total equity. This is the most important risk indicator. Lower the better. Leverage of MFI industry is much lower (4-6) than others (NBFC (5-7), private banks & home loan companies (6-10) and PSU banks (8-16). This is due to the risky nature of their assets.
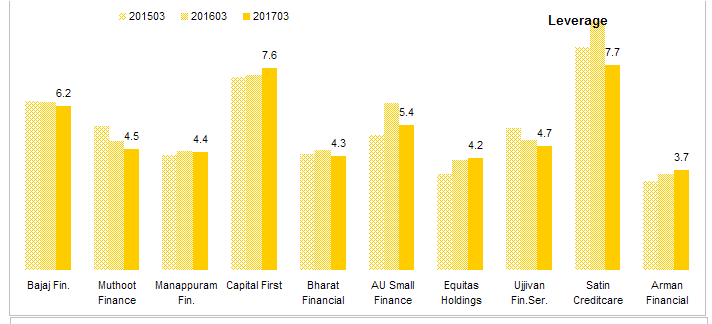
Source: Capitaline
Return on Average Assets This ratio shows returns without the effect of leverage on equity. MFIs have seen a drop in their return on assets due to demonetization related costs. Others especially gold loan companies have seen an increase.
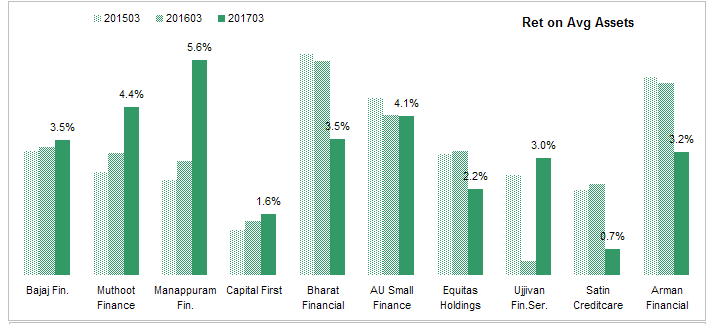
Source: Capitaline
Credit Cost this is the amount of provisions and writes off as a % of total revenue. This is money that a company sets aside to cover bad loans. Lower the better. We can see effects of demonetization here. Most MFIs have seen costs spike. sometimes I wonder how can these companies with their risky assets have relatively modest credit costs. Bajaj Finance does have sizable credit costs and others have lower costs. A higher costs will lower profits but it also reassures that bad loans have been provided for so no future huge write-offs are coming.
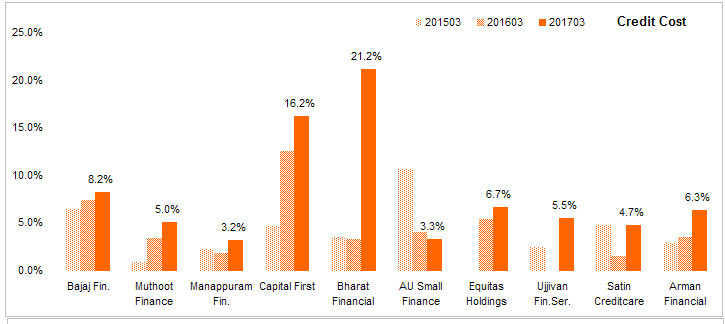
Source: Capitaline
Disc: No position in any of the companies.
34 Likes
Thanks Yogesh for refreshing the charts. Do you mind sharing the rationale behind to exit from Bajaj Finance since your disclosure last year? From above graphs, Bajaj Finance is outperforms most of the aspects compare all other companies from similar business. Do you see / forecast something different apart from stretch in the valuation for Bajaj Finance?
Disc: Holding Manappuram and Ujjivan. No trading in last 6 months. Waiting for right opportunity to enter into Bajaj Finance.
Seems Capital First is improving in most metrics finally. Why is the Credit cost so high though? What does it mean? Are the NPAs increasing and assets getting more stressed?
Disclosure: invested in Manappuram, Capital First, Equitas and Ujjivan
1 Like
Bajaj Finance is an excellent business but at this valuation, not a great investment.
2 Likes
Dear Yogesh,
You bring lot of sanity with your analysis.
Thoughtfully refreshing.
From your earlier clippings, you have added few more.
Thanks for adding AU bank which looks to be another promising candidate.
Is it possible to add PCR or NPA which is the key to financials more than other metrics.
Thanks once again.
Prasad.
I used to track PCR and NPA when I held positions in the industry. Now I just look at the credit costs which actually reflect asset quality very well. After all, credit cost is the real cost of bad loans, NPAs and PCR and other similar ratios are based on estimates and sometimes can be used to distract investors and regulators from real problems.
3 Likes