
Here is the comparison of various MFIs updated with 2017 results. Ratios for Ujjivan for 2016 are skewed because of restructuring.
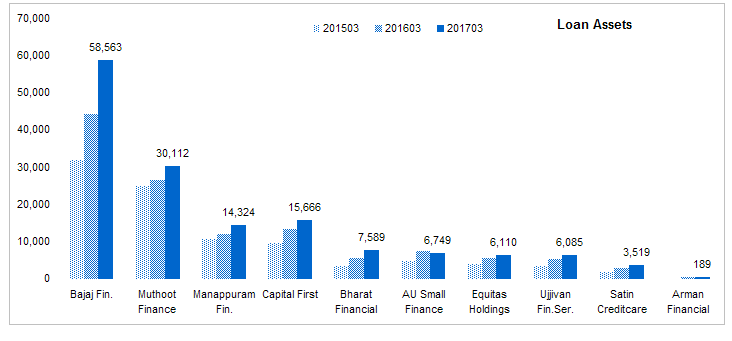
Size: Bajaj Finance (although not a strictly an MFI) is the biggest of all followed by gold loan companies. Bharat Financial is the largest MFI in this set. don’t have data for Janalakshmi and Bandhan. Except Bajaj finance, others are still much smaller than banks and even NBFCs.
Source: Capitaline
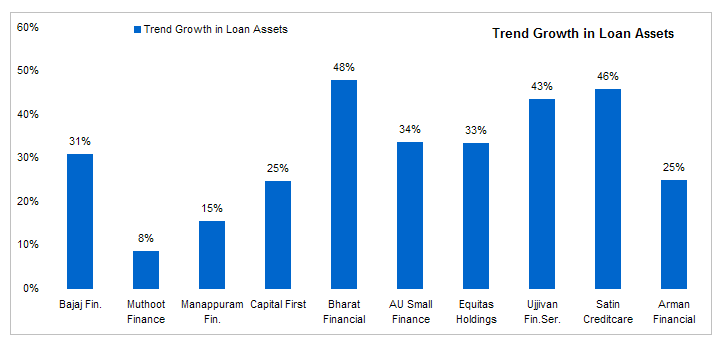
Growth: All companies in this sector are showing high growth rates. gold loans companies have recovered from the regulatory issues and are now growing their asset base. Rest of the pack is growing at healthy rate of 30-40%. This is a 4 year trend growth rate.
Source: Capitaline
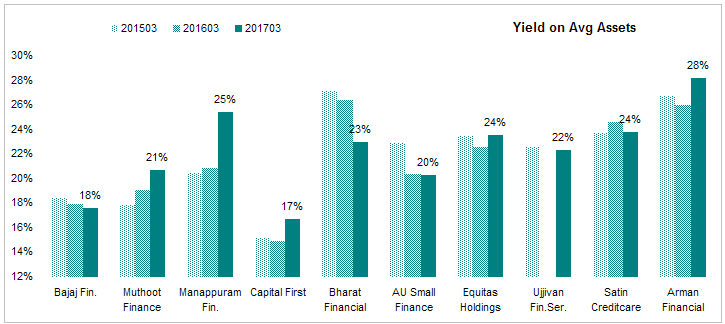
Yield On Avg Assets: - I classify lenders based on the interest rates they charge as determines what type of borrowers they cater to. Bajaj Finance as the lowest lending rate and that is also trending down. MFIs in general have higher rates and consumer finance and gold loan companies. Manappurum and Muthoot have seen their yields going up inspite of growth in their asset base. Mana is now expanding its MFI book but interest rates on its gold loan product is higher than its MFI product.Smaller companies have higher yields. bigger companies are able to offer comparitively lower rates.
Source: Capitaline
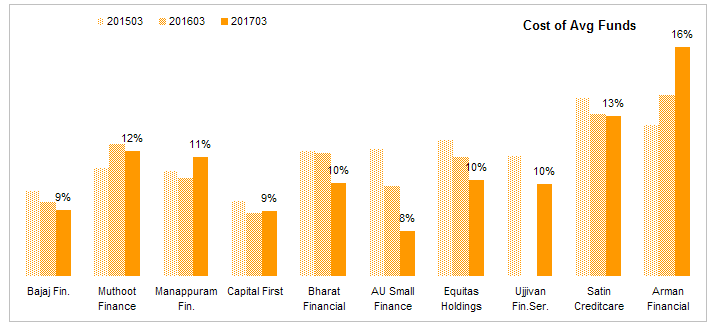
Cost of Funds - Cost of funds is the most important indicator of MFIs as that determines the faith of funding sources (banks) in the business model of these companies. Here again, bigger companies have lower cost of funds so they are able to offer loans at a lower rates.Cost of funds is generally trending down along with overall interest rates in the economy. Tie up with a bank or a small finance bank licence will further reduce this cost.
Source: Capitaline
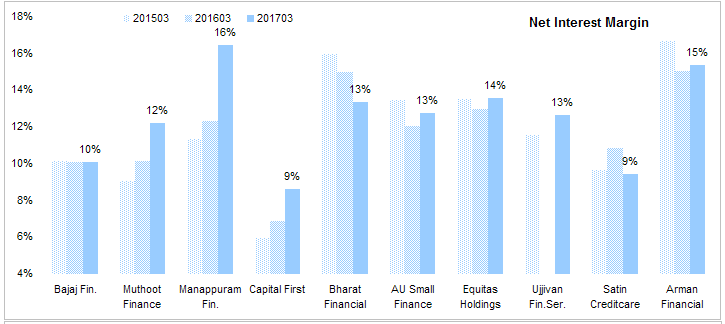
Net Interest Margin A key ratio for any lender is the net interest margin. this ratio is roughly equal to yield - costs of funds. MFIs have a huge net interest margin (10-15%) compared to banks (2$-4%), home loan companies (3-5%) and NBFCs (4-8%) due to their risky assets which yield a high return.
Source: Capitaline
Shareholder return ratios
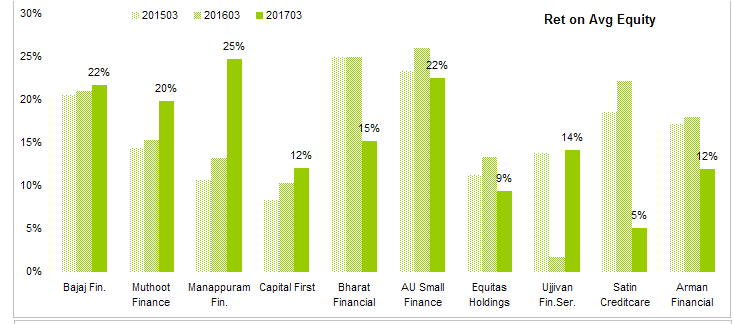
Return on Average Equity Most important ratio from a shareholder perspective. This industry as a whole is geneating a decent ROE close to 20% with bigger companies generating higher ROE. Although bigger companies have lower yields, their costs are even lower so they are able to generate a high ROE compared to small ones. Scale helps here. Capital First has seen a good increase in ROE. A low but rising ROE is actually better than a high but dropping ROE from an investor perspective.
Source: Capitaline
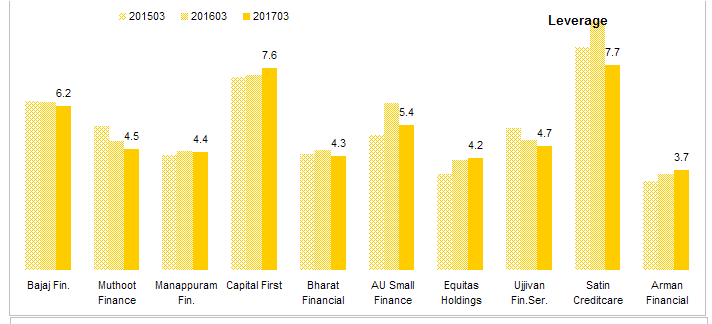
Leverage This ratio shows how much debt is used to leverage equity. This is calculated using total assets / total equity. This is the most important risk indicator. Lower the better. Leverage of MFI industry is much lower (4-6) than others (NBFC (5-7), private banks & home loan companies (6-10) and PSU banks (8-16). This is due to the risky nature of their assets.
Source: Capitaline
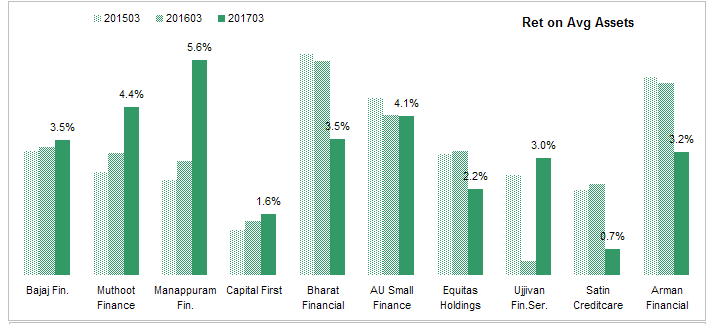
Return on Average Assets This ratio shows returns without the effect of leverage on equity. MFIs have seen a drop in their return on assets due to demonetization related costs. Others especially gold loan companies have seen an increase.
Source: Capitaline
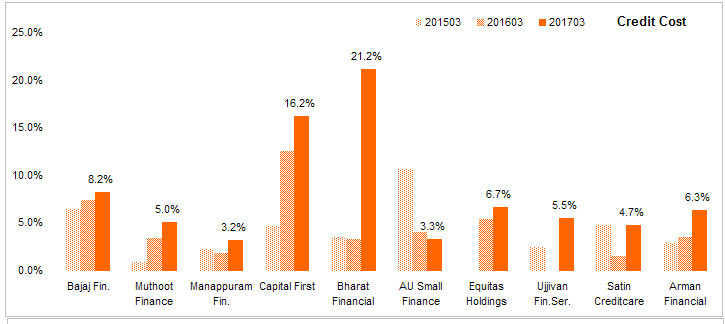
Credit Cost this is the amount of provisions and writes off as a % of total revenue. This is money that a company sets aside to cover bad loans. Lower the better. We can see effects of demonetization here. Most MFIs have seen costs spike. sometimes I wonder how can these companies with their risky assets have relatively modest credit costs. Bajaj Finance does have sizable credit costs and others have lower costs. A higher costs will lower profits but it also reassures that bad loans have been provided for so no future huge write-offs are coming.
Source: Capitaline
Disc: No position in any of the companies.