• Growth momentum looking good for FY2019. Constant currency revenue growth to be at the top-end of the Industry growth rates
• Healthcare and BFSI would lead the growth in FY19. Transformation led revenue acceleration will be evident.
Sales pipeline across BFSI and Healthcare robust.
• Margin expansion to continue in FY2019; 60-80 bps expected. Transformation led gain-share and operating leverage provide continuing tailwinds for margin expansion
My take on results
Profitability has improved as promised by management in last concall.
Management commentary remains optimistic.
Dividend declaration is a welcome surprise. And Rs 1.50 per share is great.
Going forward as mentioned previously, free cash flow should imrpove and that should improve dividend payouts.
As per presentation,
• Net Long Term Debt of $27.4 million as of March 31, 2018
• Full and final repayment of $135 Mn term-loan and $20 Mn ECB in FY2018
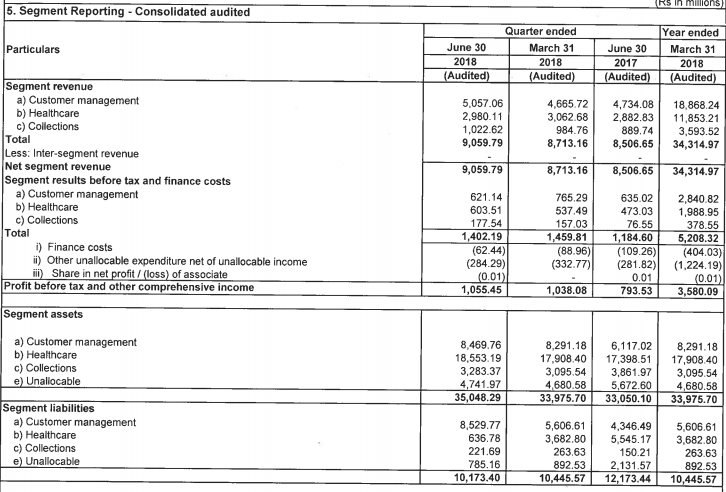
As per balance sheet attached with results,
Short term borrowings are at 658 crores and long term debt is 14 crores.
Cash and equivalents at 157 crores.
Overall balance sheet has improved a lot over FY 18.
			Firstsource Solution Ltd
Key Highlights of Q4 FY18 and FY18
Financial Performance
Q4 FY18
o Revenue grew to 897.3 Cr over 887.2 Cr in Q3 FY18 and 892.3 Cr in Q4 FY17
QoQ growth of 1.1% in INR terms and flat in constant currency terms
YoY growth of 0.6% in INR terms and growth of 0.5% in constant currency terms
Proforma Domestic business, then YoY growth of 6.9 % in INR terms and 6.7% in constant currency terms
o EBITDA grew to 132.5 Cr over 116.1 Cr in Q3 FY18 and 99 Cr in Q4 FY17
QoQ growth of 14.1%, margin expansion by 168 bps from 13.09% to 14.77%
YoY growth of 33.8%, margin expansion by 367 bps from 11.10% to 14.77%
Proforma Domestic business, then growth of 40.6% YoY
o EBIT grew to 115.3 Cr over 99 Cr in Q3 FY18 and 88 Cr in Q4 FY17
QoQ growth of 16.5%, margin expansion by 170 bps from 11.15% to 12.85%
YoY growth of 31.0%, margin expansion by 299 bps from 9.86% to 12.85%
Proforma Domestic business, then growth of 36.5% YoY
o PAT grew to 92.8 Cr over 75.5 Cr operating PAT and 99.5 Cr reported PAT in Q3 FY18 , 65.4 Cr in Q4 FY17
QoQ growth of 23% on operating PAT, margin expansion of 184 bps from 8.51% to 10.35%
QoQ de-growth of 6.7% on reported PAT, margin reduction of 87 bps from 11.22% to 10.35%
YoY growth of 42.0%, margin expansion by 302 bps, from 7.33% to 10.35%
Proforma Domestic business, then growth of 50.1% YoY
o Recommend a dividend of 15% (INR 1.50 per share )
o Revenue by Geography
North America stand at 55.6 % over 54 % last year same quarter
UK stand at 43.2 % over 45 % last year same quarter
From India and rest of world at 1.2 % over 1 % last year same quarter
o Revenue by Verticals
Healthcare stand at 37.60 % over 37.40 %FY18 last year same quarter
Telecom and media stand at 31 % over 33.3 % last year same quarter
BFSI stand at 31.4 % over 29.3 % last year same quarter
o Revenue by Delivery was same as last year
o Revenue by Segment
Customer Management stands at 53.5 % over 54.5 % last year same quarter
Healthcare stands at 35.2 % over 35.5 % last year same quarter
Collections stand at 11.3 % over 10 % last year same quarter
o Revenue by Client Concentration
From Top 5 Client stands at 45.1 % over 47.5 % last year same quarter
From Top client stand at 27 % over 29.2 % last year same quarter
FY18
o Revenue de-grew by 3,535.2 Cr over 3,555.6 Cr YOY
Y-o-Y de-growth of 0.6% in INR terms and growth of 2.8% in constant currency terms
Proforma Domestic business, then growth of 3.7 % in INR terms and 7.1% in constant currency terms
o EBITDA grew by 458.9 crore over 438.0 crore YOY
Y-o-Y growth of 4.8%, margin expansion by 66 bps from 12.32% to 12.98%
Proforma Domestic business, then growth of 8.9% YoY
o EBIT grew by 393 Cr over 379 Cr YOY
Y-o-Y growth of 3.7%, margin expansion by 46 bps from 10.66% to 11.12%
Proforma Domestic business, then growth of 7.5% YoY
o Operating PAT grew by 302.4 Cr from 280 Cr YOY
Y-o-Y growth of 8.0%, margin expansion by 68 bps, from 7.88% to 8.56%
Proforma Domestic business, growth of 13.4% YoY
o Reported PAT grew by 326.5 Cr over 280 Cr YOY
Y-o-Y growth of 16.6%, margin expansion by 136 bps, from 7.88% to 9.24%
Proforma Domestic business, then growth of 22.2% YoY
o Revenue by Geography
North America stand at 53.6 % over 55.3 % last year same quarter
UK stand at 43.6 % over 38 % last year same quarter
From India and rest of world at 2.8 % over 6 % last year same quarter
o Revenue by Verticals
Healthcare stand at 36.8% over 35.8 %FY18 last year same quarter
Telecom and media stand at 33.9 % over 32.2 % last year same quarter
BFSI stand at 29.2 % over 31.8 % last year same quarter
o Revenue by Delivery
Offshore stand at 75.9 % over 72.9 %
Onshore stand at 24.1 % over 27.1 %
o Revenue by Segment
Customer Management stands at 55 % over 55.8 % last year same quarter
Healthcare stands at 34.5 % over 33 % last year same quarter
Collections stand at 10.5 % over 11.2 % last year same quarter
o Revenue by Client Concentration
From Top 5 Client stands at 46.3 % over 43 % last year same quarter
From Top client stand at 28.3 % over 22 % last year same quarter
Key Highlights
Repayment of Debt of $61.7 million in FY2018
o Full and final repayment of $135 million Term Loan and $20 million ECB
Successfully divested Domestic Business in FY18
Employee and Attrition Details
o Headcount
18,703 employees as on March 31, 2018
8,809 employees in India
9,894 employees based outside India
Net reduction of 523 employees in Q4 FY18
o Attrition Details:
Onshore (US and Europe) – 47.3% compared to 39.4% in Q3 FY18
Offshore (India and Philippines) – 46.6% compared to 39.8% in Q3 FY18
Outstanding FX hedges at $71 million for USD and £107 million for GBP
o Next 12 months: 58% coverage for USD at INR 70.7 levels, 62% coverage for GBP at INR 101.1 levels, 38% coverage for USD at PHP 51.7 levels and 73% coverage for GBP at PHP 68.6 levels
o Next 12 – 24 months: 61% coverage for USD rates at INR 69.8 levels, 71% coverage for GBP at INR 99.2 levels and 25% of GBP at PHP 72.0 levels
o Post 24 Months: 83% coverage for GBP at INR 108.0 levels
Business Outlook
o Growth momentum looking good for FY2019. Constant currency revenue growth to be at the top-end of the Industry growth rates
o Healthcare and BFSI would lead the growth in FY19. Transformation led revenue acceleration will be evident. Sales pipeline across BFSI and Healthcare robust.
Margin expansion to continue in FY2019; 60-80 bps expected. Transformation led gain-share and operating leverage provide continuing tailwinds for margin expansion
Q&A
What would be the Growth in number term ? What will be the impact of currency ?
o 9-10 % growth in FY19
o In profitability there will be 25% growth shown in Q1FY19 compare to Q1 FY 18
o Company had 60-80 % currency hedges . Any growth will benefit on the pound
o If dollar and pound hold the same position where they are then there will be same upside
What will be the Dividend policy in FY19 or capital allocation ?
o 35-40% payout of PAT. 47-48 Million of interest expense will be over as company will become debt free in October 2018
Why does company get low benefit from currency movement compare to others ?
o Earlier loan book was there so cash flow book was hedged toward foreign currency payment
What is company CAPEX plan for FY19?
o Around 10-12 $ Million range
What is driving the growth for the company and benchmark for the company ?
o Mortgages , BFSI , Healthcare, customer management service support by banking segment , Collection part are the drivers of growth
How much margin company is targeting ?
o 14 % EBITDA margin
Why there is flattish growth in Q4 revenue ? Is current margin sustainable ?
o Flattish growth is because of change in client revenue from one of top client
o Margin is seasonality element next year target is 14 %
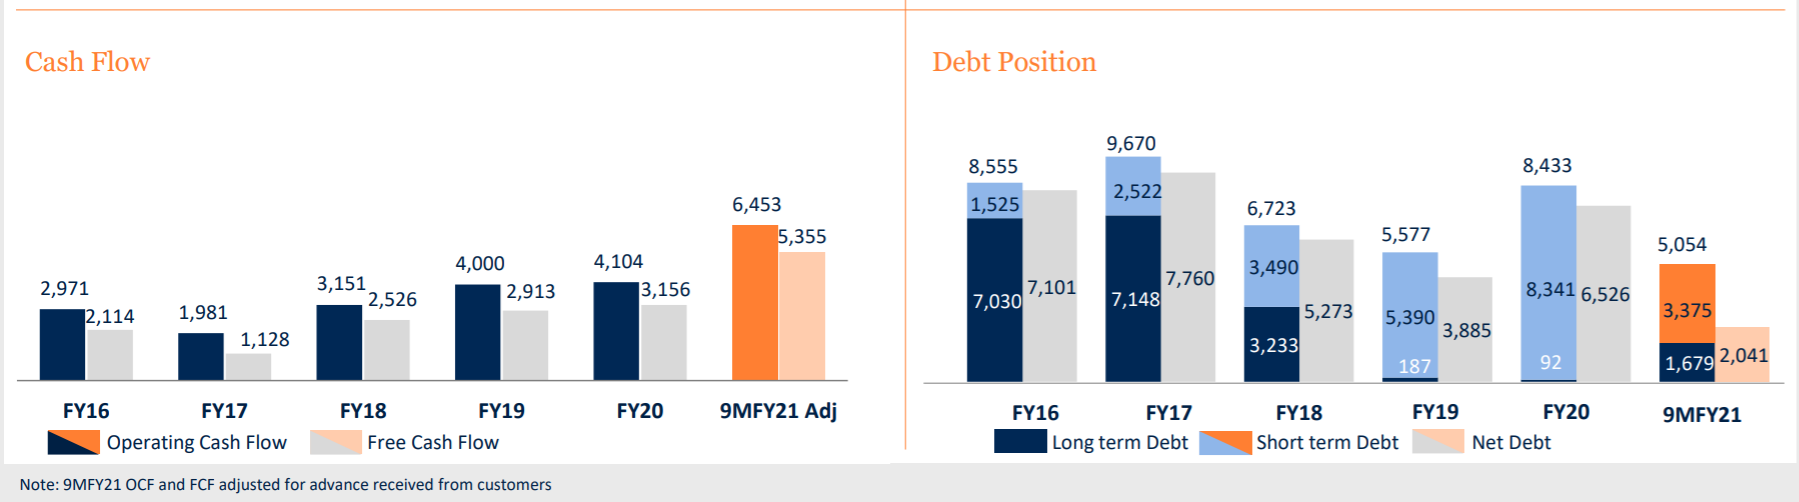
FSL reduced the long term debt from 3,579.94 million to 142.20 million within 1 year which i find is really good which means they are generating good amount of cash flow . Their Cash and cash equivalents have increased from 387.31 million to 1230.00 million in FY17-18 which indicates that their balance sheet is improving . Can anyone explain me what will be growth factor for fsl in FY18-19 and how they will improve the profitability ??.
Goenkas have not been known to be a very investor friendly group in the past. I also read a reference to this group in the VP Forum discussing Philips Carbon Black. I have read through the posts on FSL and would like to know if a company like FSL under the Goenka group would also remain a short to medium term play. Disc: small investment in FSL
[/quote]
Decent result by fsl .
Revenues at Rs. 9,547 million, 9.4% Y‐o‐Y; 3.9% Q‐o‐Q
EBIT at Rs. 1,144 million or 12.0% of revenues, 22.5% Y‐o‐Y; 3.9% Q‐o‐Q
PAT at Rs. 928 million or 9.7% of revenues, 35.0% Y‐o‐Y; 4.7% Q‐o‐Q
Finance costs reduce 34%.currently trading at 11.4x fy19e earnings which is available at decent valuation
FSL should do 5.4-5.5Rs EPS in FY19 and be free of LT debt. FY20 can move up by 10-15% given further debt paydown/possibility of inorganic acquisition given cash build up and management aim towards deploying cash and the back ended ramping up of a few UK deals. Dividend payout will be 40% so this is at a 5% yield. I’m not sure why this is trading so cheap when comparable BPOs trade at 20x in the US (Genpact, WNS) or have recently been taken out at 12x EV/EBITDA multiples (Convergys). FSL trades at 6x EV/EBITDA which is ridiculous.
My guess is that the main overhang on the stock is Brexit related - worst case if GBP goes to 80/INR, you lose one years revenue growth and then see much more business opportunities in the UK as companies will be desperate to outsource business functions to save costs. FSL will be very well positioned for this.
The other worry might be SKY dominance and some business losses here (driven by SKYs desire to show great margins pre COMCAST acquisition). This is unsustainable and FSL has a great relationship with COMCAST, being one of their BPO vendors and constantly gaining from another COMCAST vendor in the US. So i don’t see them losing this at all and possibly getting back some of the SKY business
Overall at this price, this is a nice 18-20% IRR compounder IMHO
Going by mgmt guidance a conservative est for PAT for this yr wud be 370cr. At this level div yield wud be around 3.4% on a price of 53 considering post tax payout of 40% (higher end of mgmt guidance). This wud mean 1.8 rupees div which wud be a 20% inc over LY which wud be far higher than the 13% inc in PAT. LY payout was close at 37% incl tax.
For 5% div yield at 53, FSL will need to do a PAT of 525cr. Is your estimate hinting at this level of PAT?
Good analysis and estimate; I think they’ll do closer to 400cr but it really depends on FX; the INR has come up strongly in the last one month.
I am looking at one year forward i.e FY20 where i think there can be 15%+ PAT growth over FY19. I’d calculated the 5% based off of this. But yes, I hadn’t factored in pesky DDT. They should rather be doing buybacks than dividends. Let’s hope DDT is done away with this budget!
PAT at 378cr has come quite close to the estimate though 33% increase in div is a pleasant surprise. A mere 10% inc in next yr div puts the yield at 4.5%. And for PAT growth est we have to wait for mgmt call which isnt a good thing to do :)…but another conservative est of 10% PAT gr next yr makes it quite attractive at 49.
Would request seniors inputs on owing this thru CESC ventures (holding co. discount 50%), along with a good attempt being to create a good snacks brand “Too Yumm” (VC kind of opportunity).
Market response of “Too Yumm” seems to be ‘decent to good’.
Main interest is to participate in Too Yumm brand, along with safety of Firstsource sol stable Cash flow. Stock has corrected ~35% post demerger.
Feedback on Sanjiv Goenka Group (esp. capital allocation) in the past. Not negative about the promoter, but I always feel there is some complexity in groups published results, which creates doubt. Though didnt find any averse results against promoters.
Interesting to see, no post in last one year, whereas the company is doing quite well. Growth has been good, recent acquisition of “PatientMatters LLC” in USA ( cost: 96 crs, funded through internal accruals ) is going to help company consolidate its leadership position in USA health segment.
Look at the ,cash flow, 9 month FY21 cash flow from operation is 160%+ of the Full year FY20 cash flow, thats huge. ( 3 Rs interim dividend in Feb 2021, that itself is 1% dividend yield, going to be much more for full year).
Overall, I see the business to scale up rapidly, with profitability improving, strong cash flow and debt reduction and these should help stock price appreciate.